
Upcoming webinar on 'Inforiver Charts : The fastest way to deliver stories in Power BI', Aug 29th , Monday, 10.30 AM CST. Register Now
Upcoming webinar on 'Inforiver Charts : The fastest way to deliver stories in Power BI', Aug 29th , Monday, 10.30 AM CST. Register Now
In our latest release, new, row-level edit permissions for data input measures and forecasts make your data input even easier. And a broader range of default value options for data input fields also brings new ways to visual your data.
Discover the latest Inforiver innovations that drive better planning, analytics, and data visualizations across your organization in this release:
1.1. Row edit user validation for data input/forecast
2.1. Adjustment workflow enhancements
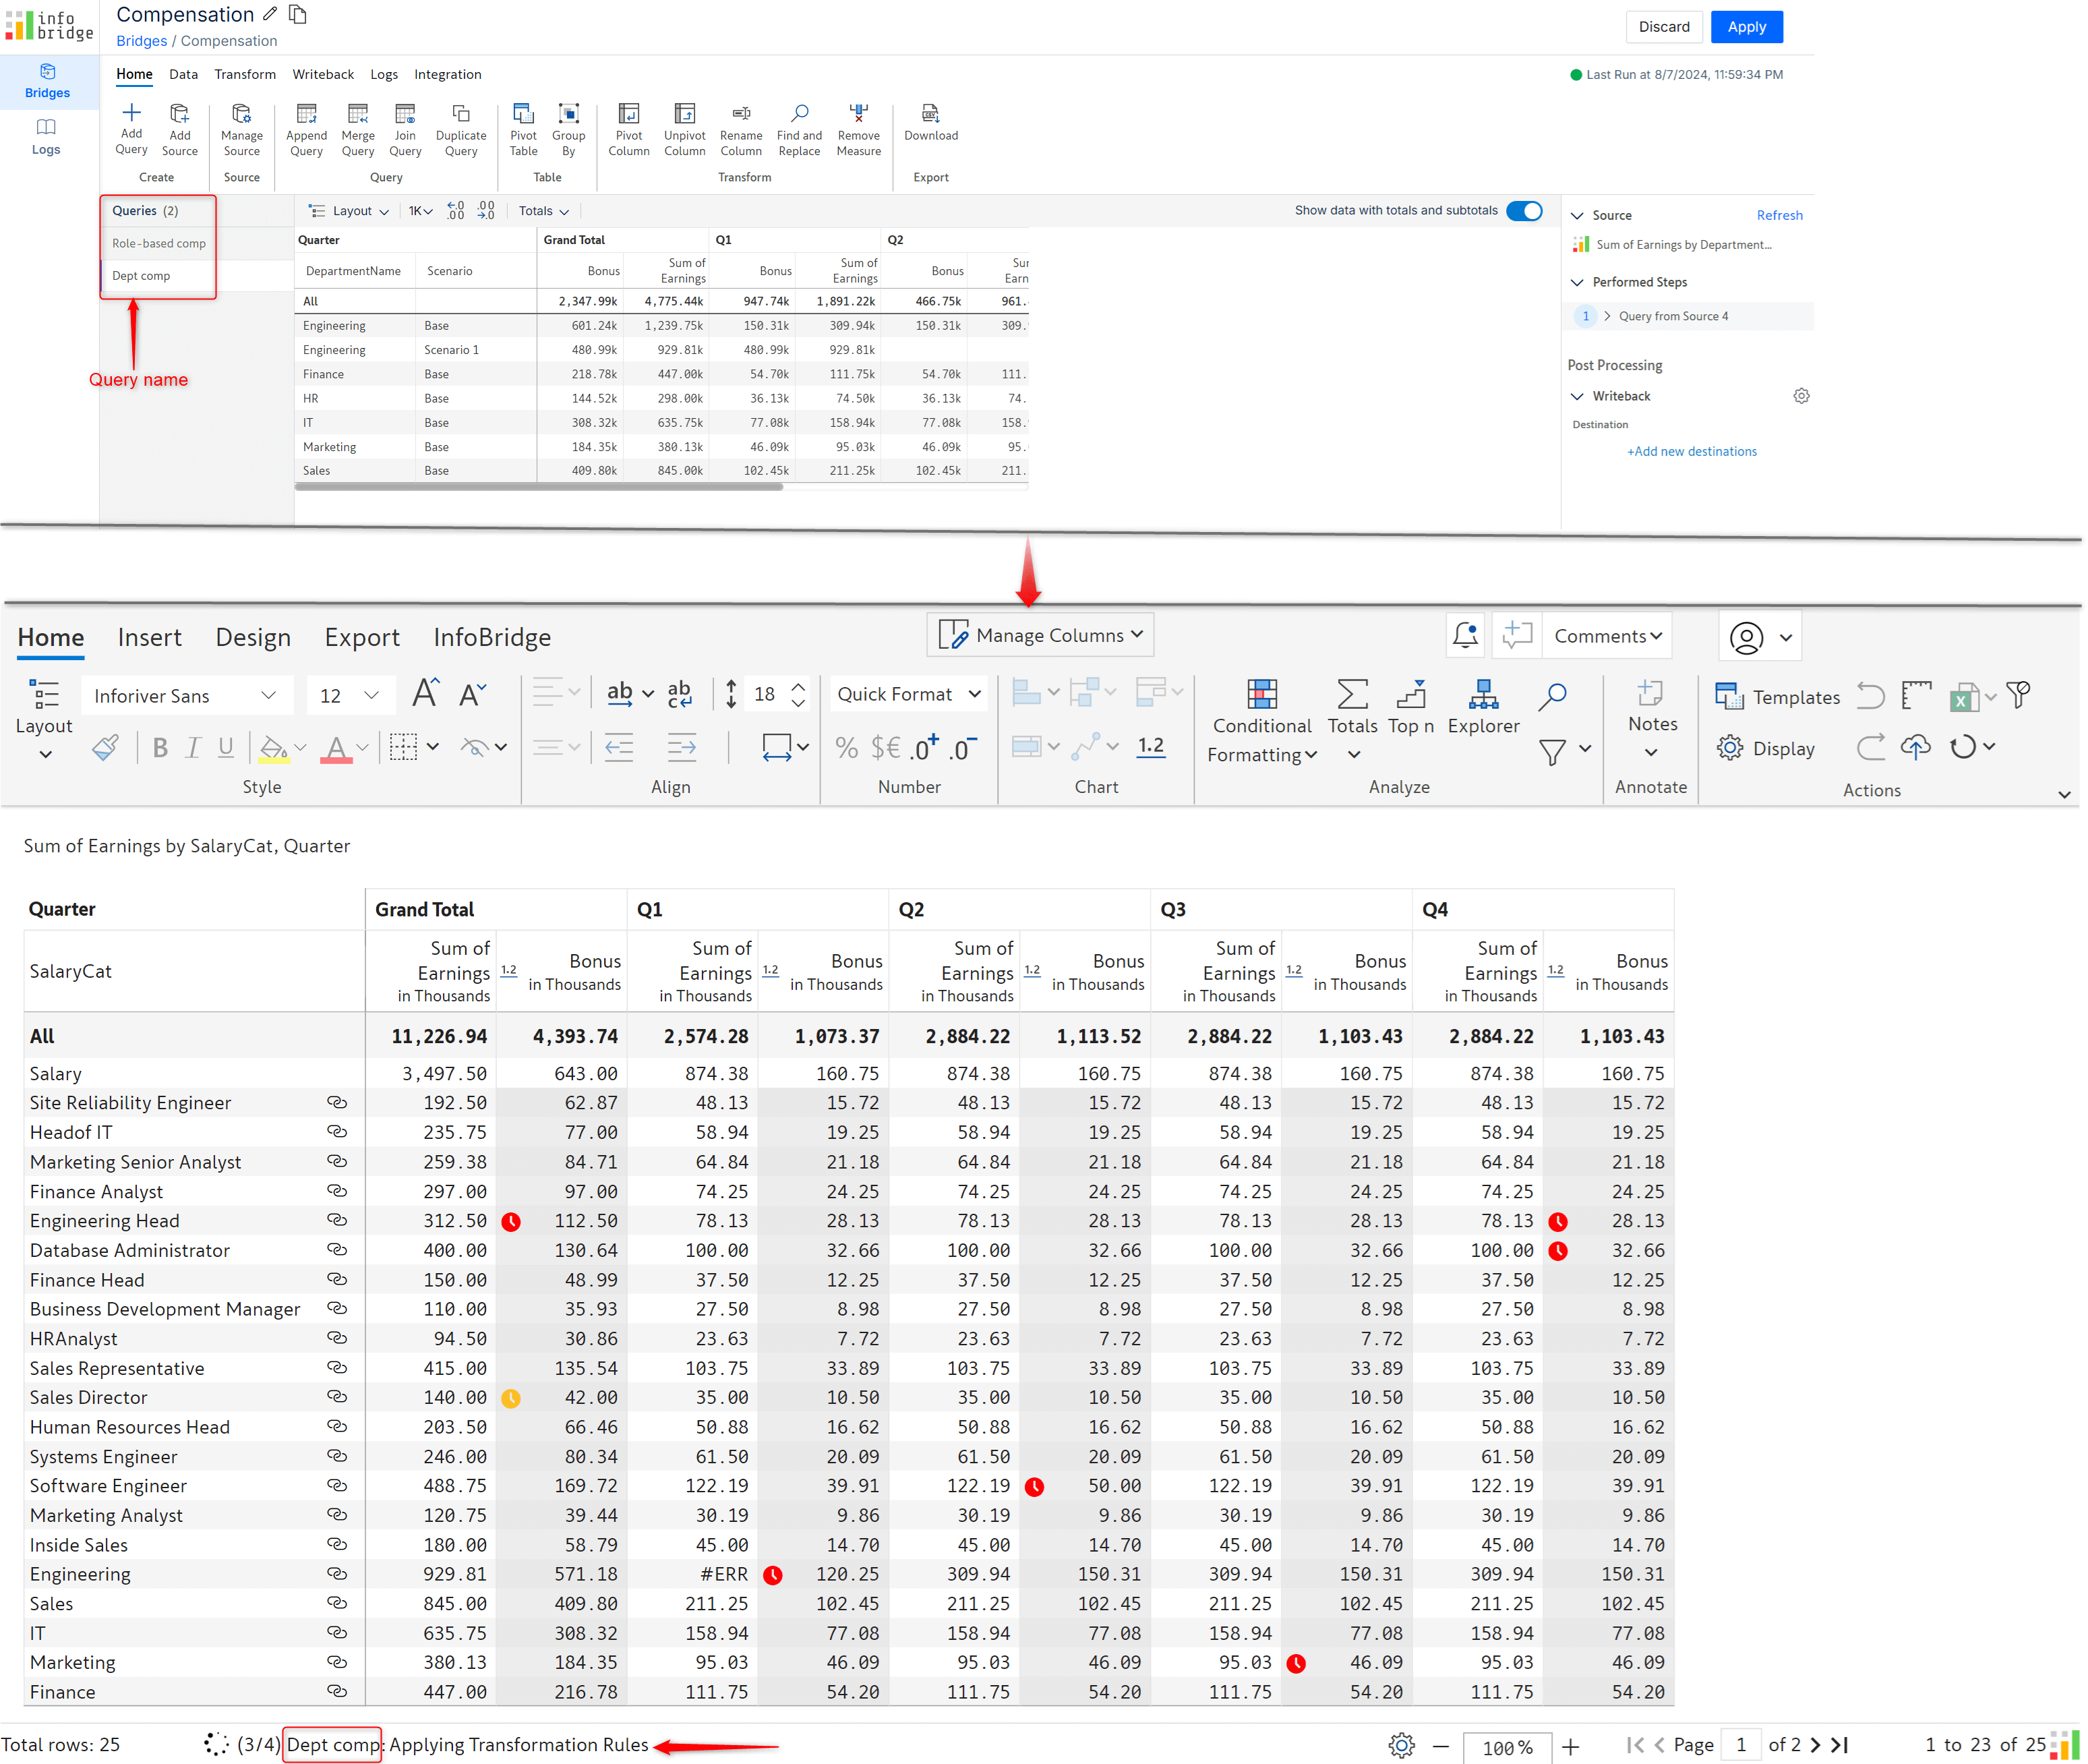
2.2. Infobridge data consolidation
2.3. Query name with progress milestones in notifications
For collaborative reporting, access control is required to ensure that users only edit data within their purview. For instance, the marketing managers for a particular region or product segment should be able to enter and update data only for the regions and products that they handle. Power BI provides row-level security for native measures, but this was not quite enough.
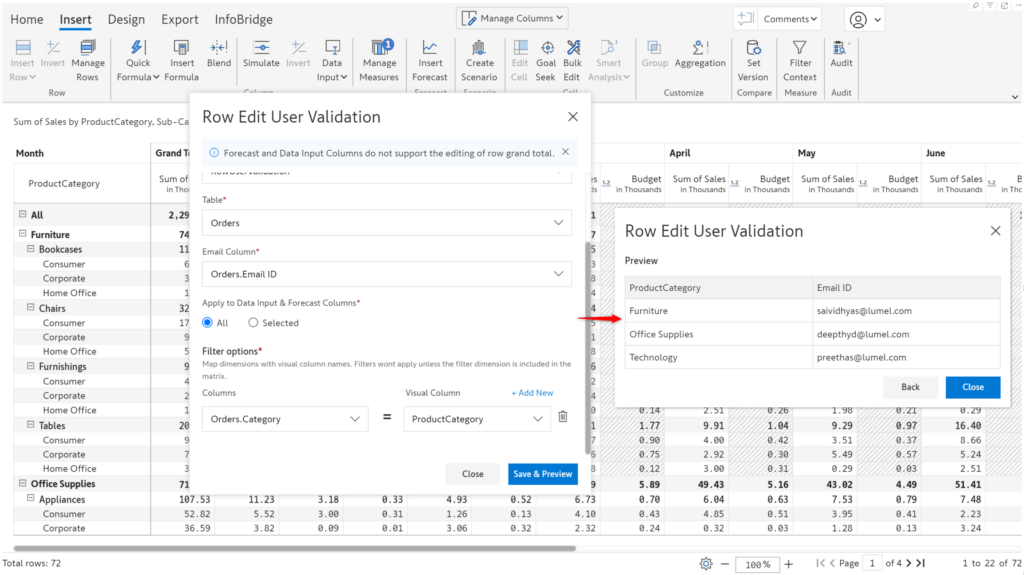
This is where row-level user validation shines. If your semantic models contain e-mail IDs, you can regulate edit access to data input and forecast fields based on the e-mail ID. The permissions set will also be applied to bulk edits and scenarios.
Navigate to Manage Rows > Row Settings > Row Edit User Validation to specify the semantic model and the e-mail ID field.
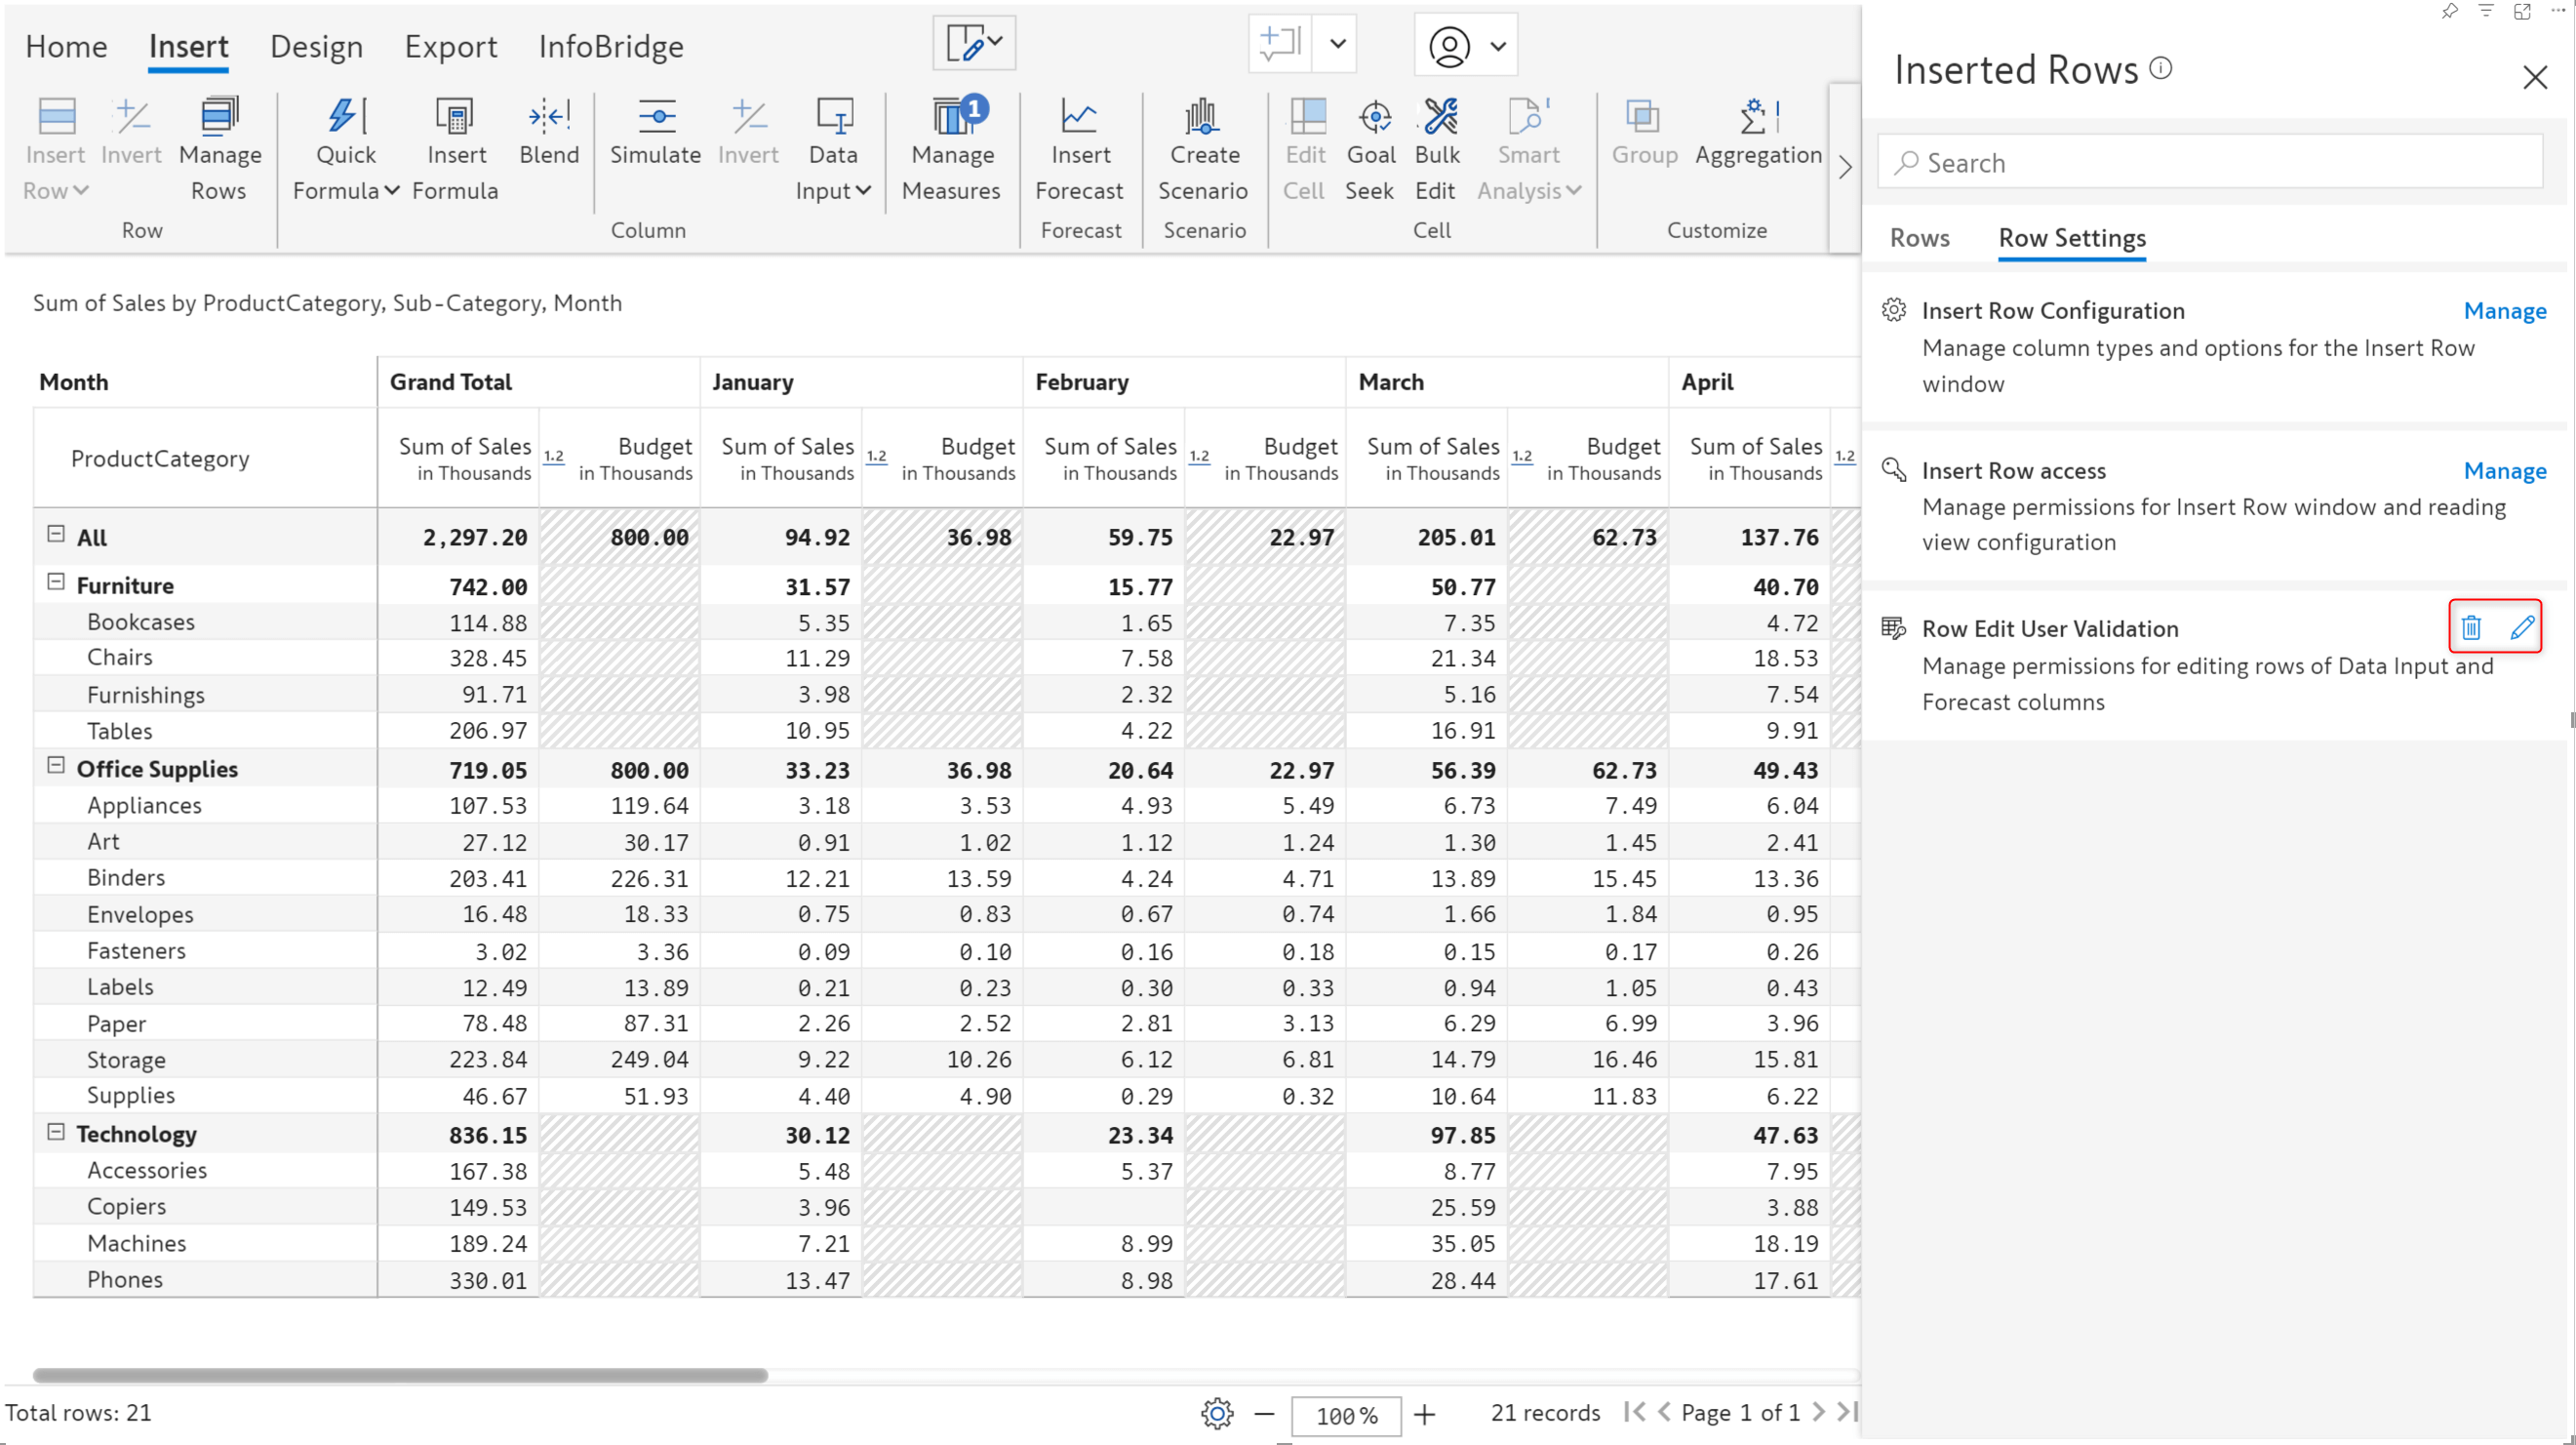
Click the delete icon in the Row Settings side pane to remove row-level user validation for a report page.
Users can enter and edit data input measures based on the e-mail ID configured for each dimension category. The categories for which the user is not permitted will be greyed out and cannot be modified.
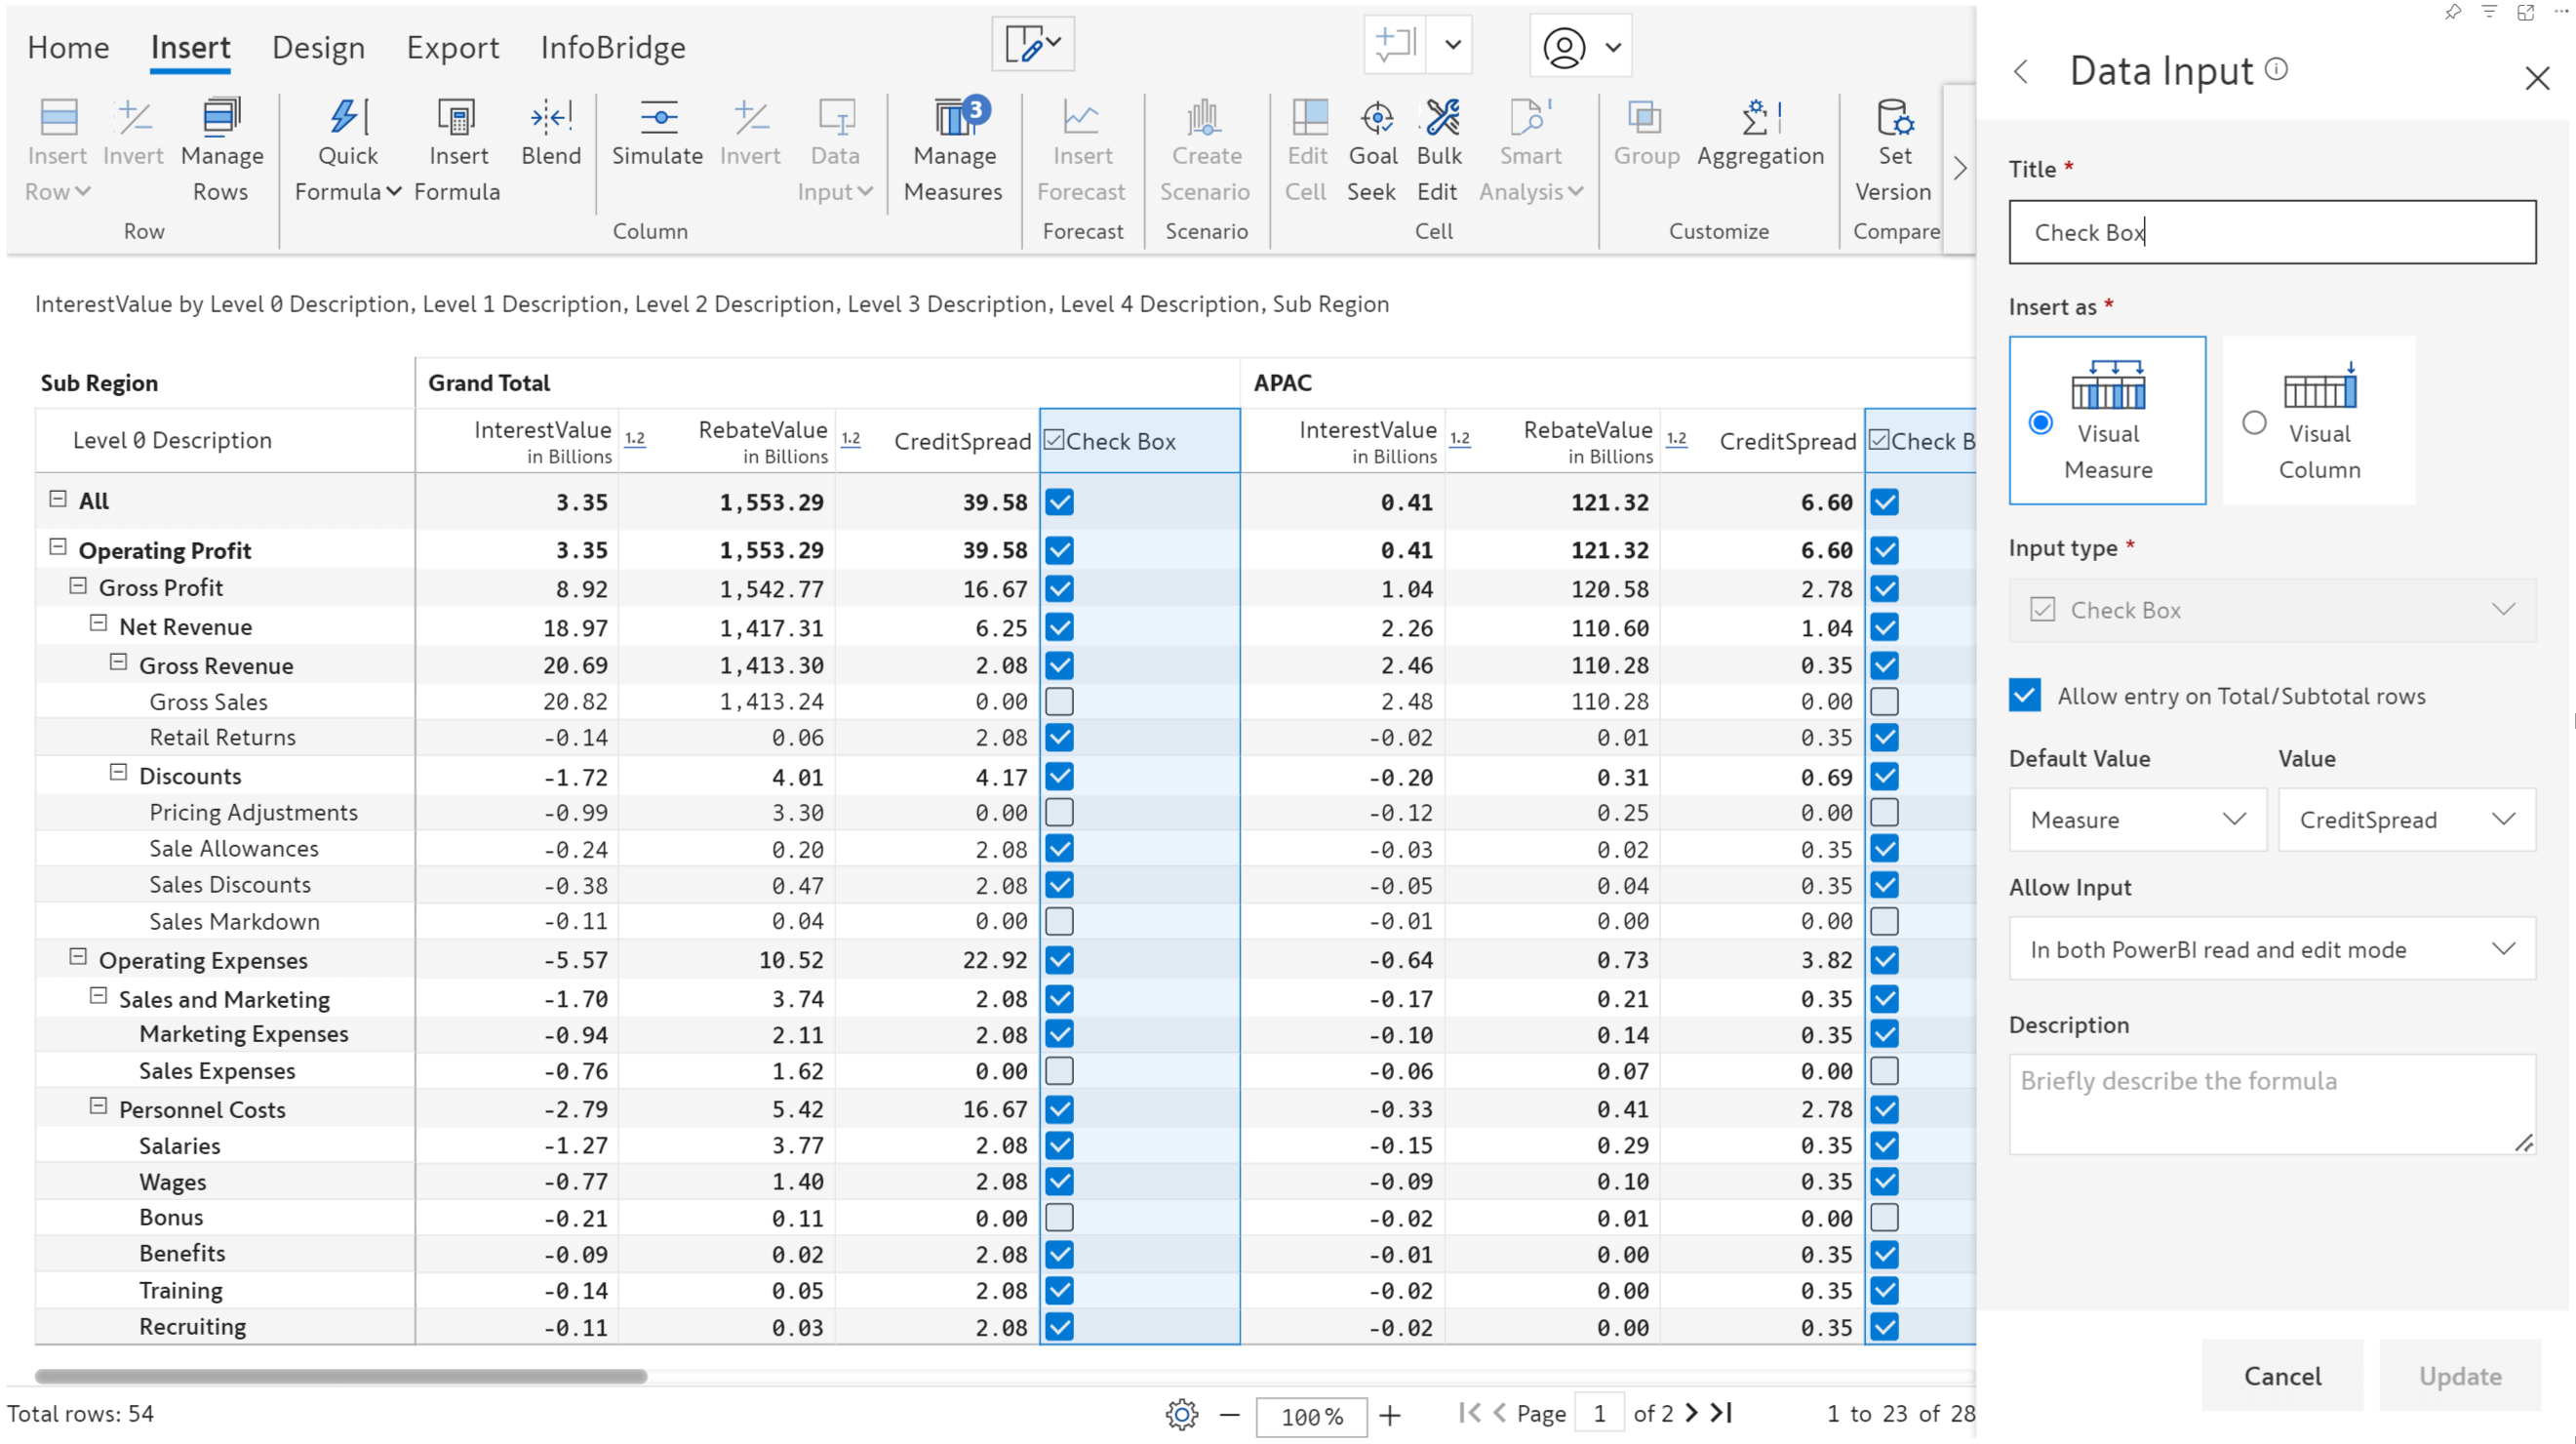
Inforiver provides a wide range of options for setting default values. For numeric data input, you can use visual columns and measures or formula measures as default values.
You can even use measure values as the default for checkboxes, text inputs, or dropdowns.
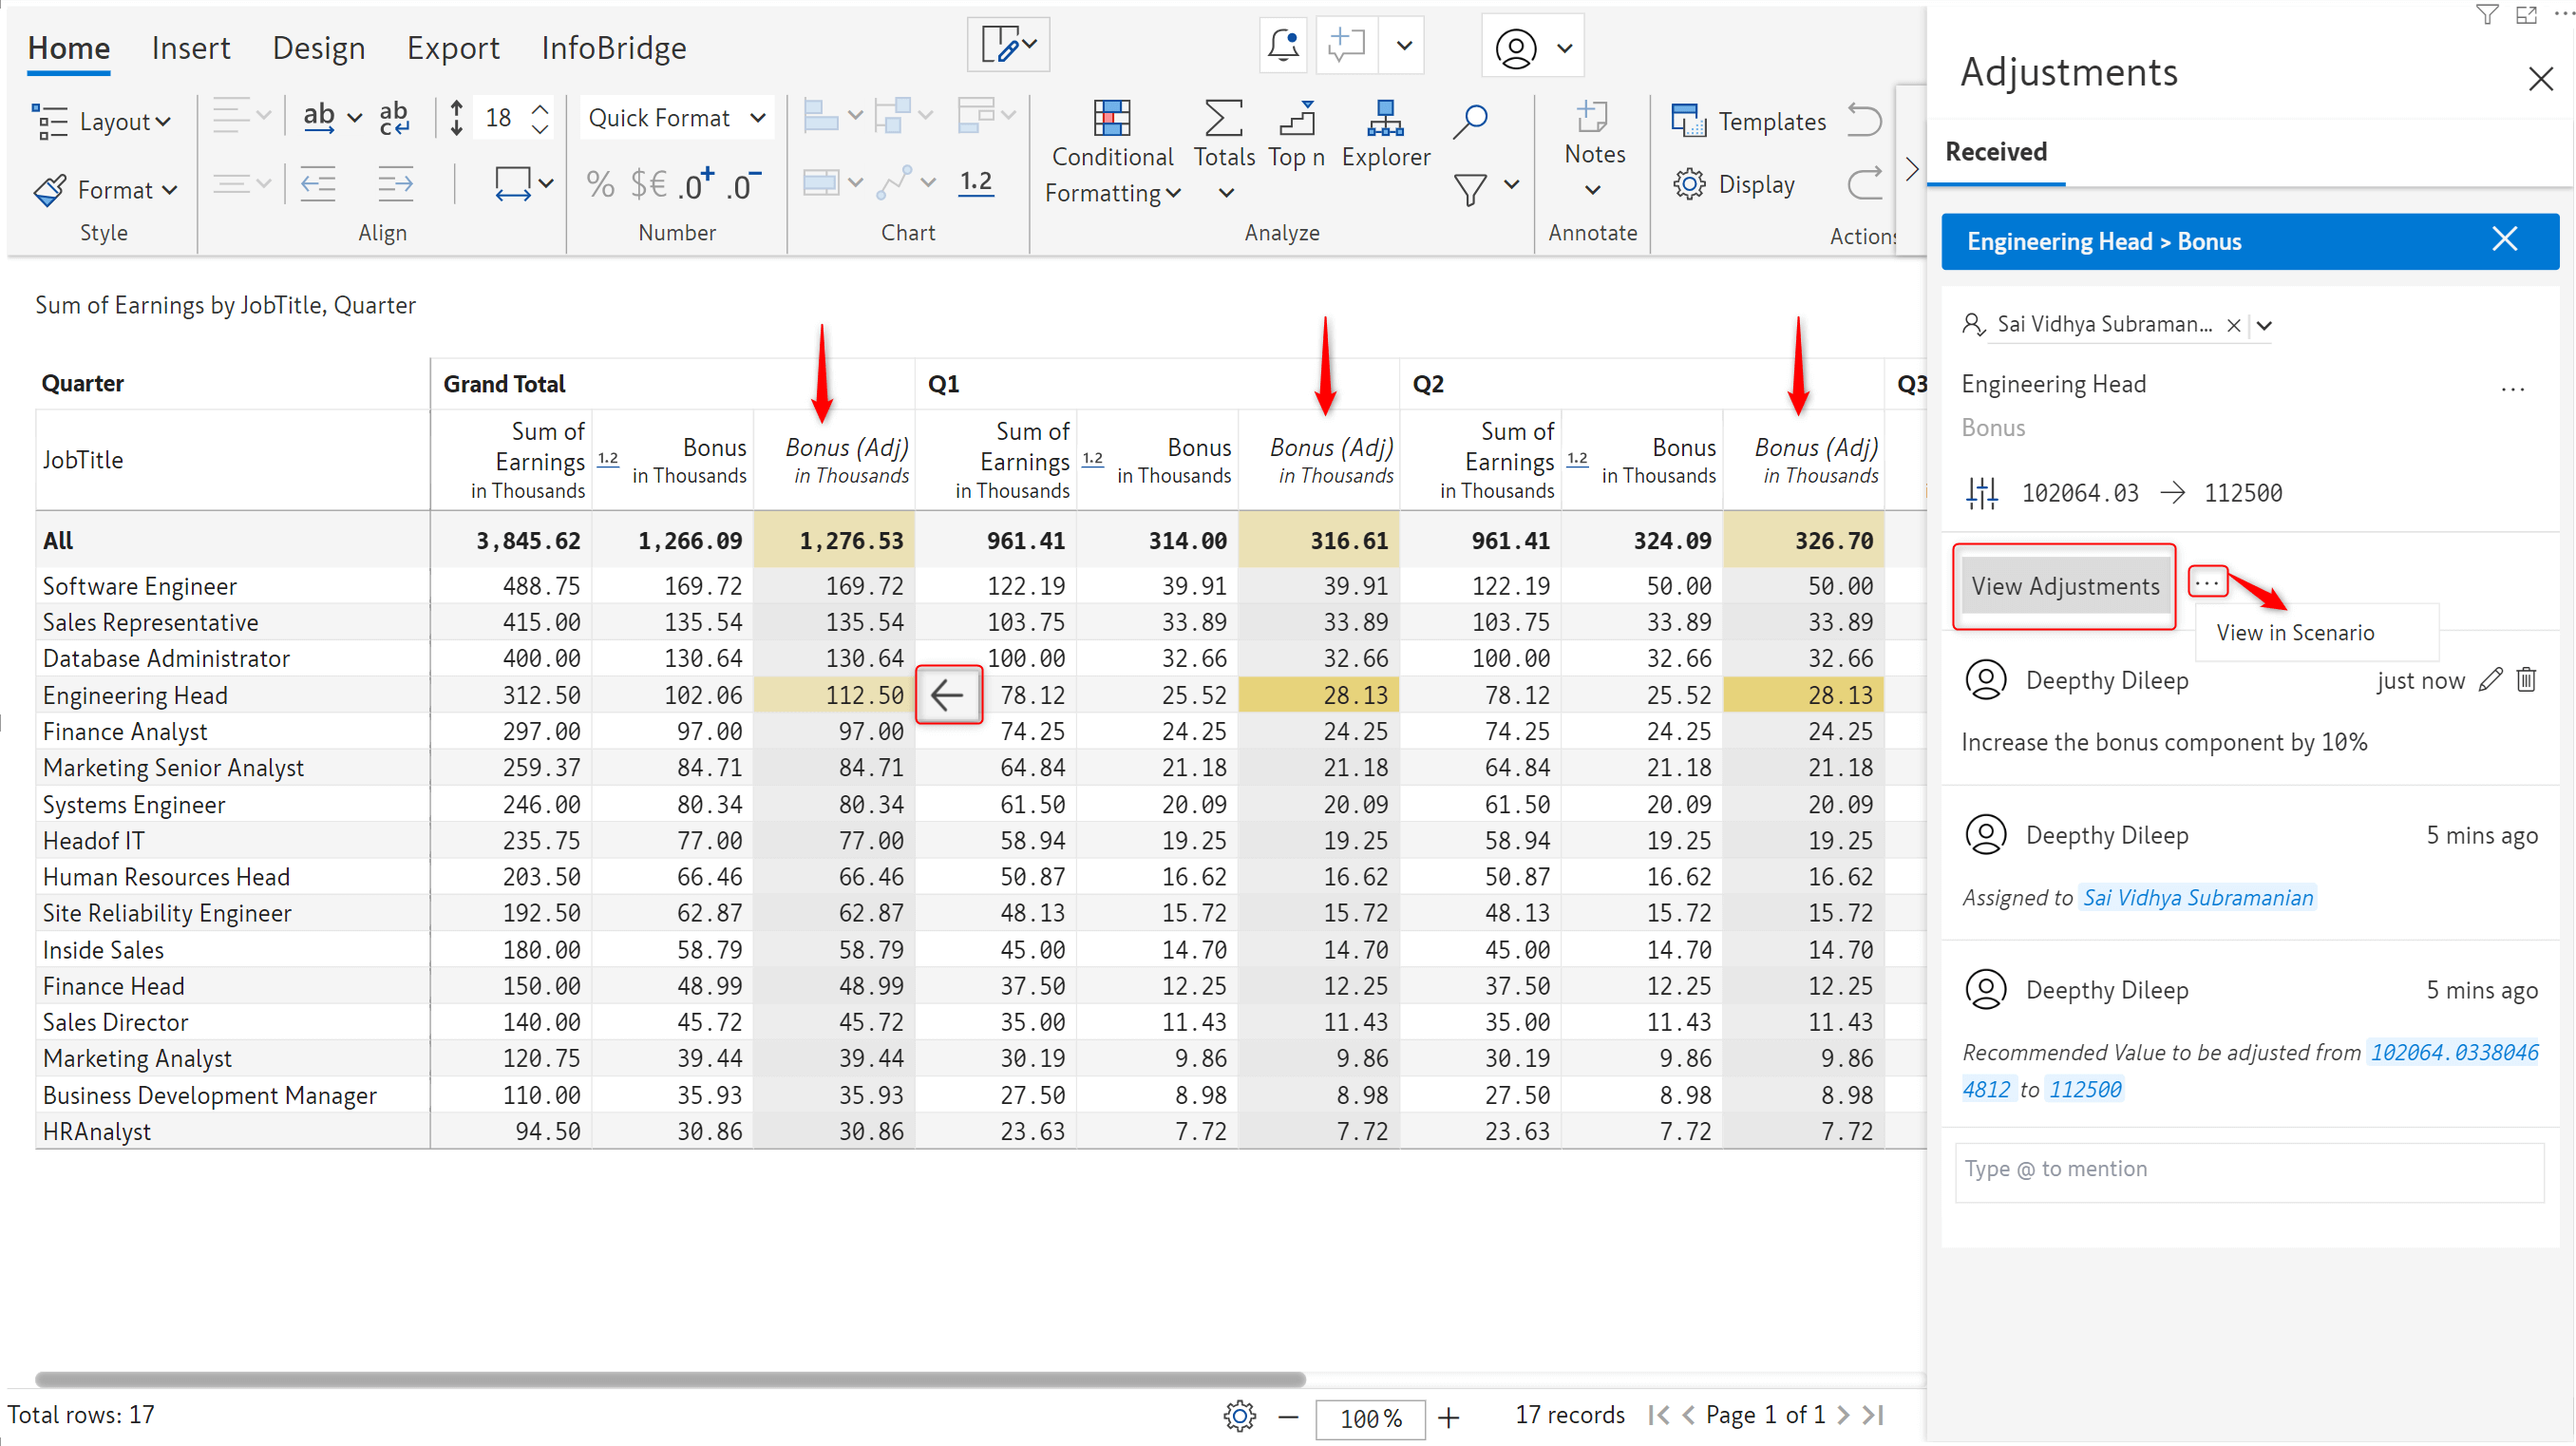
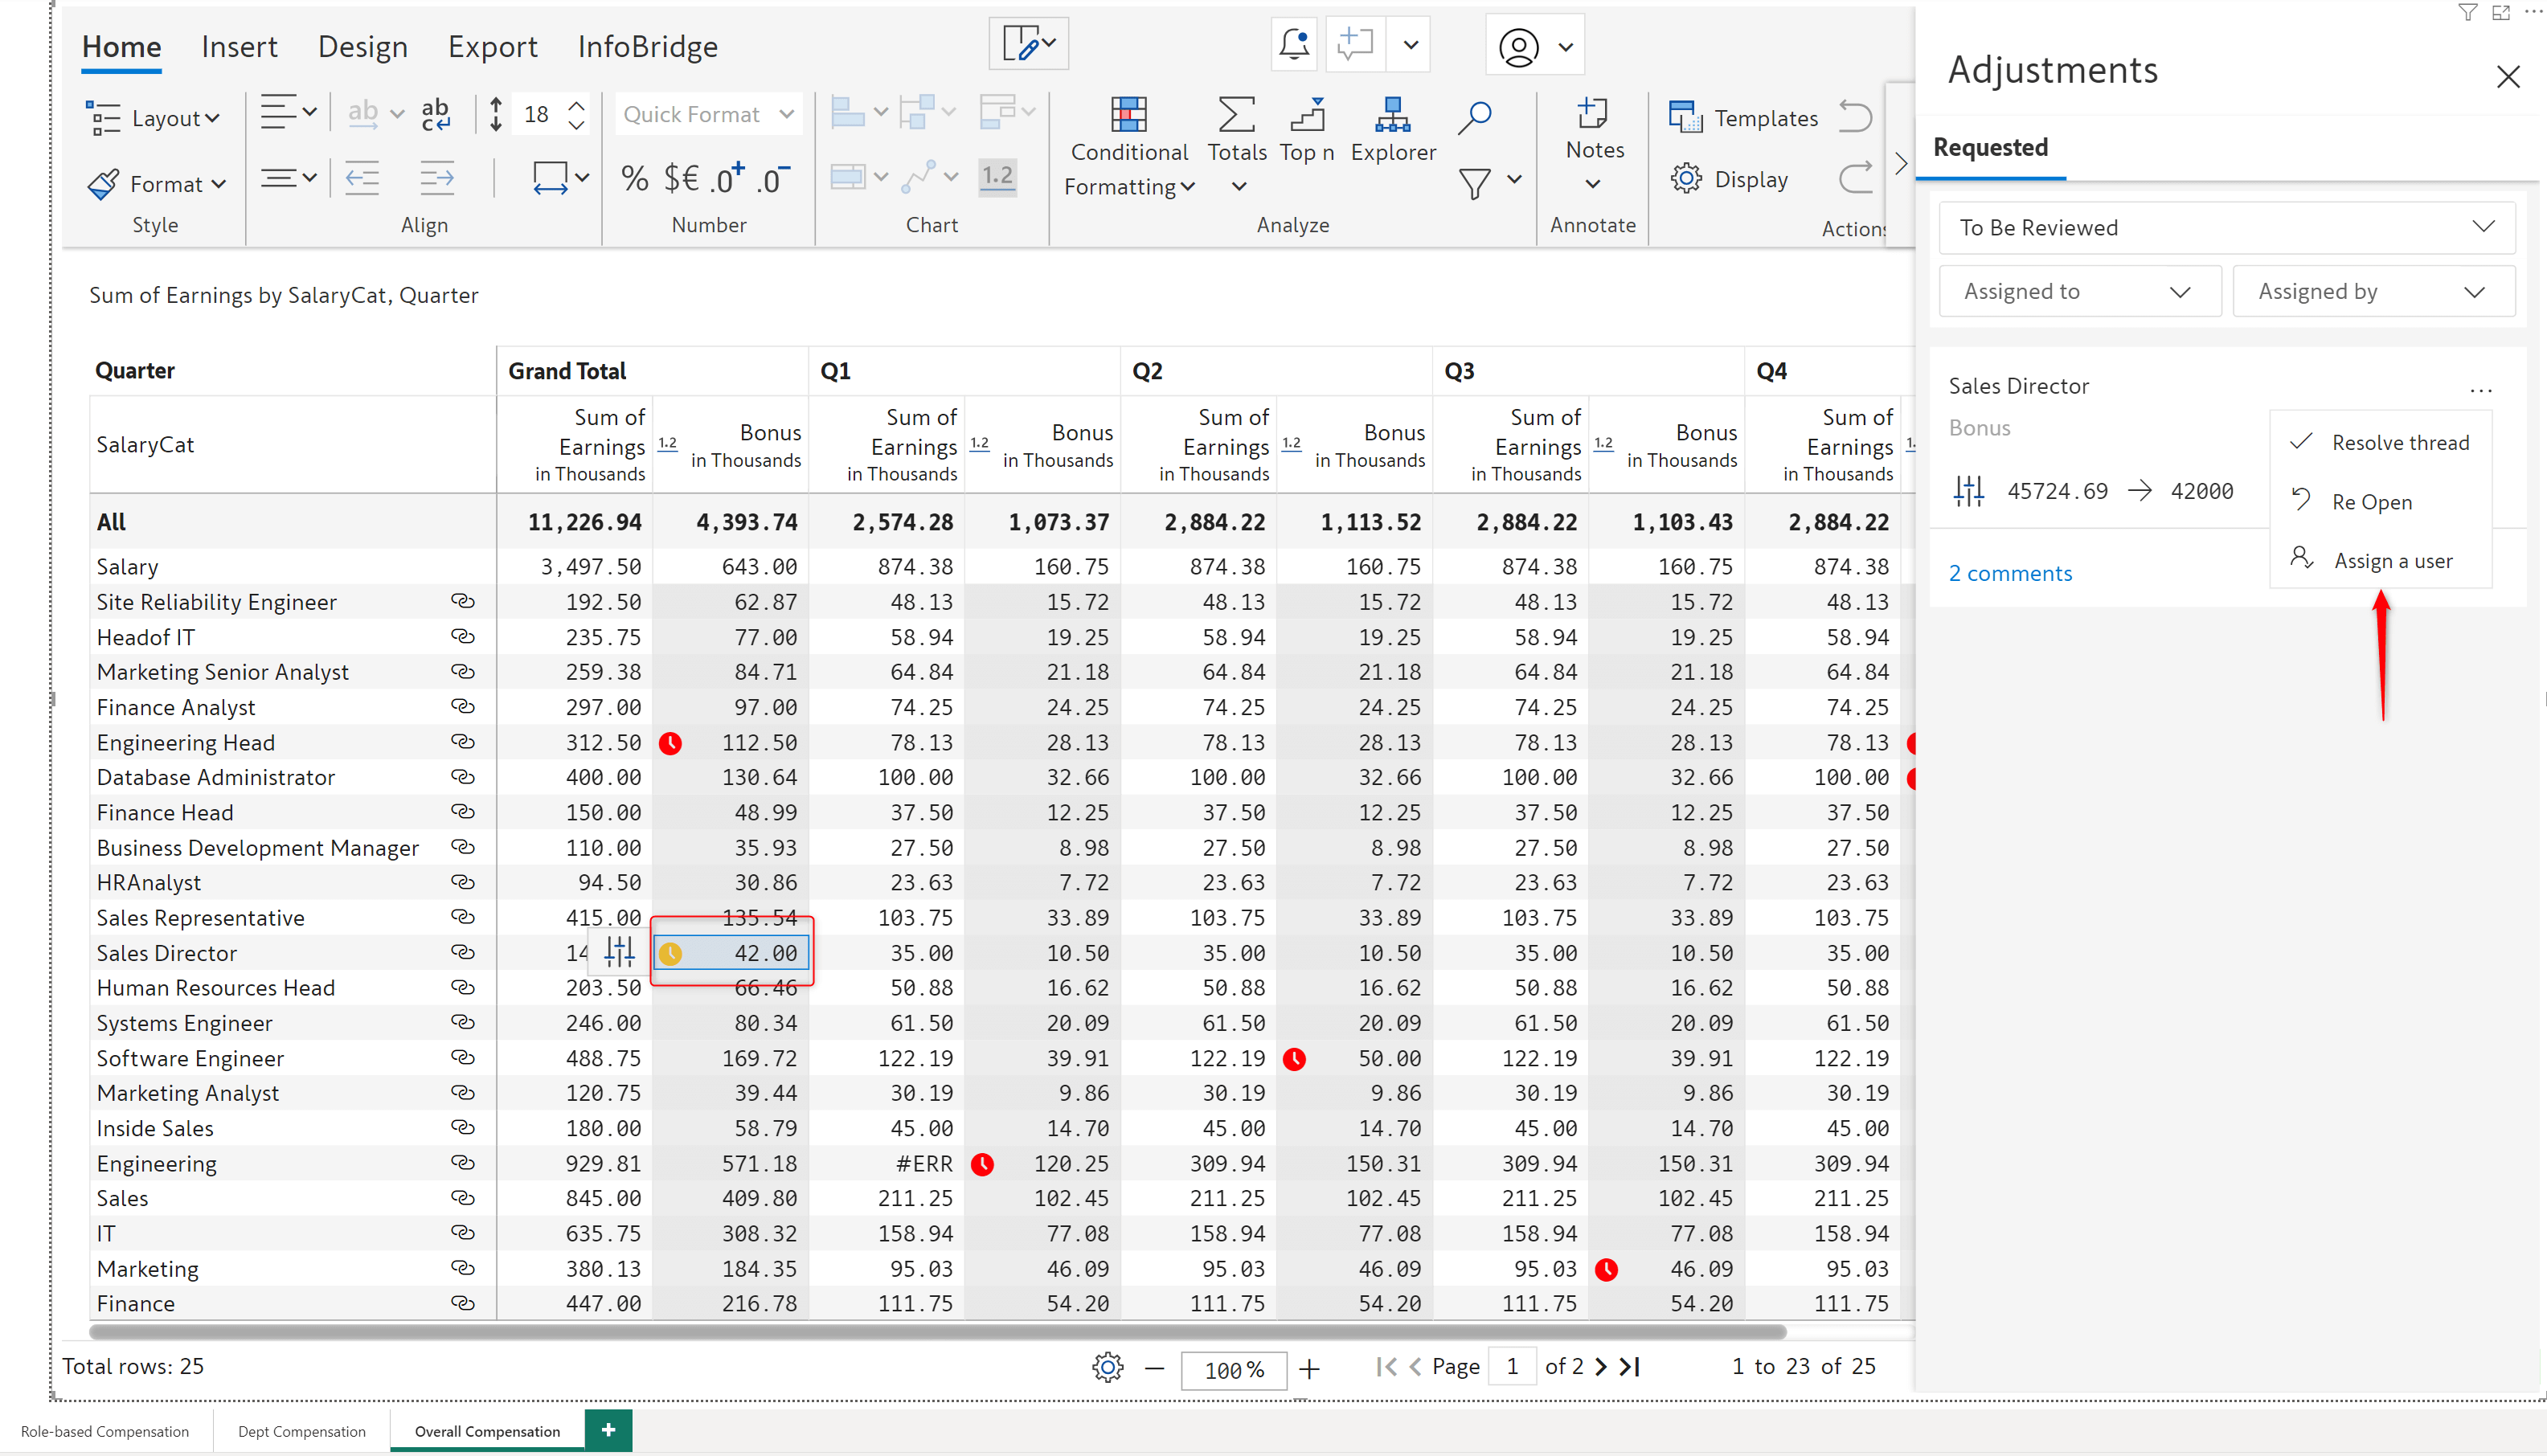
The Infobridge adjustment feature is designed to support collaborative adjustments between source and target visuals. In this version, we have made the adjustments workflow more intuitive and user oriented.
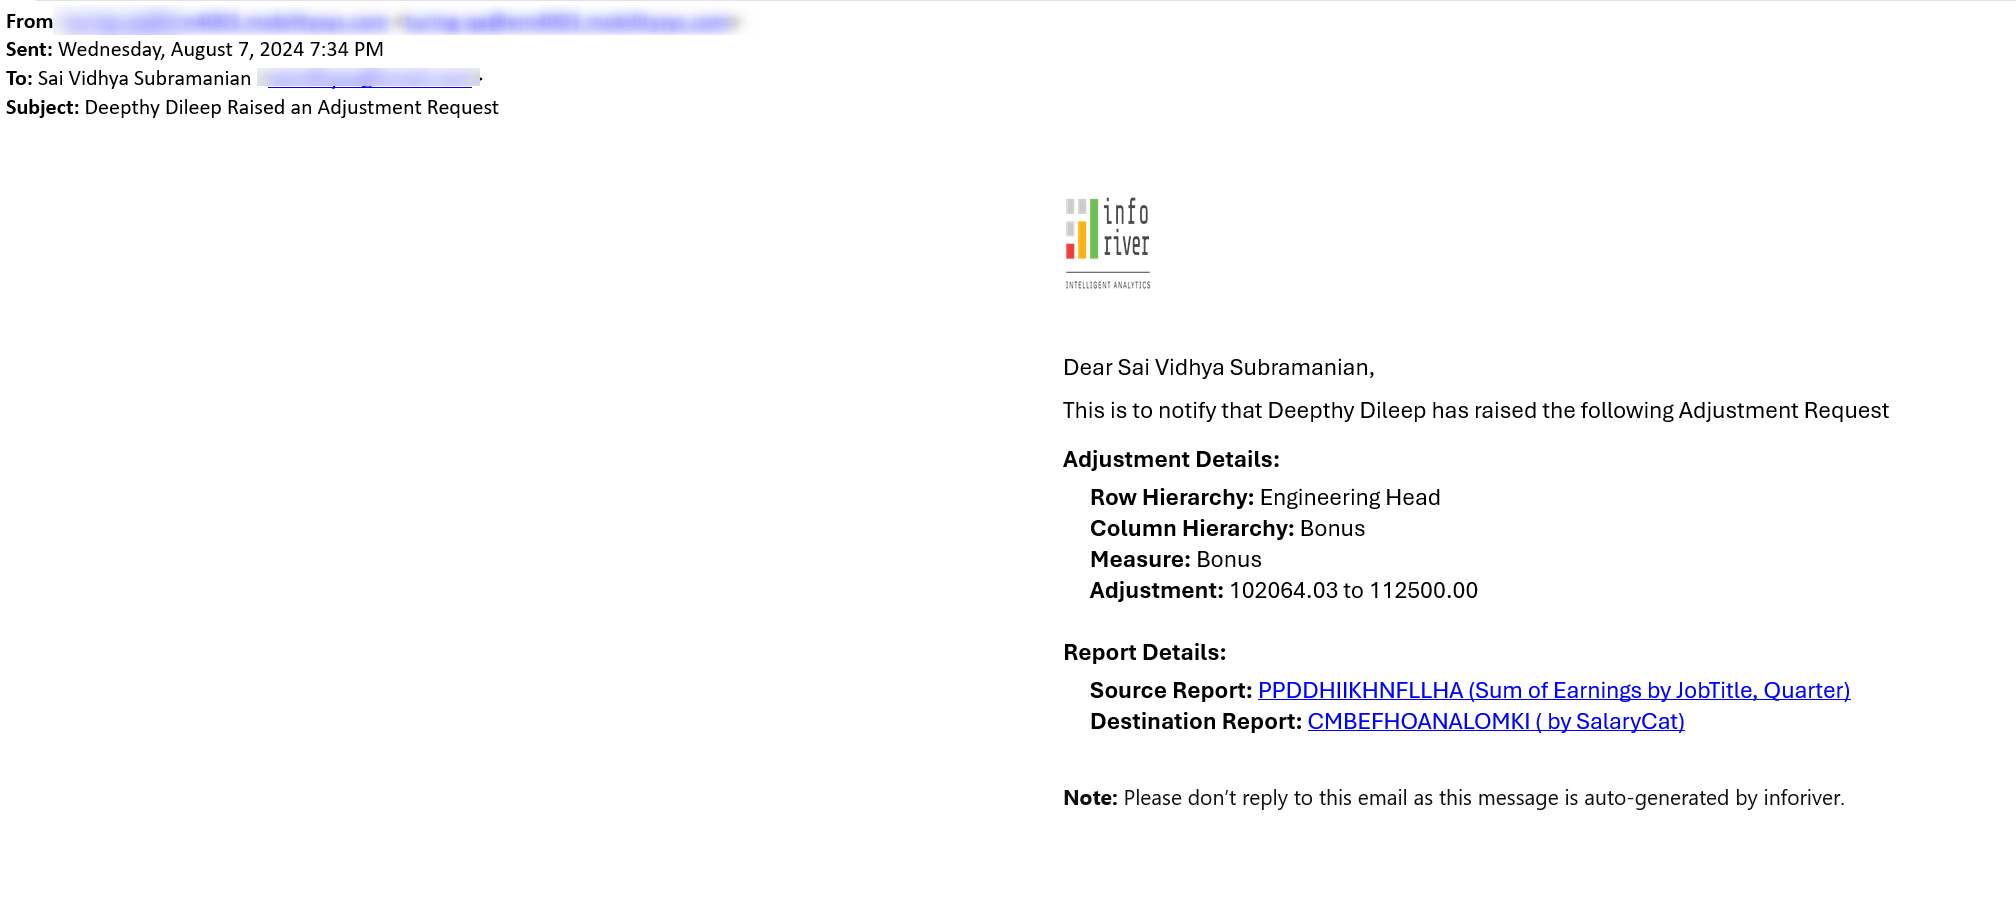
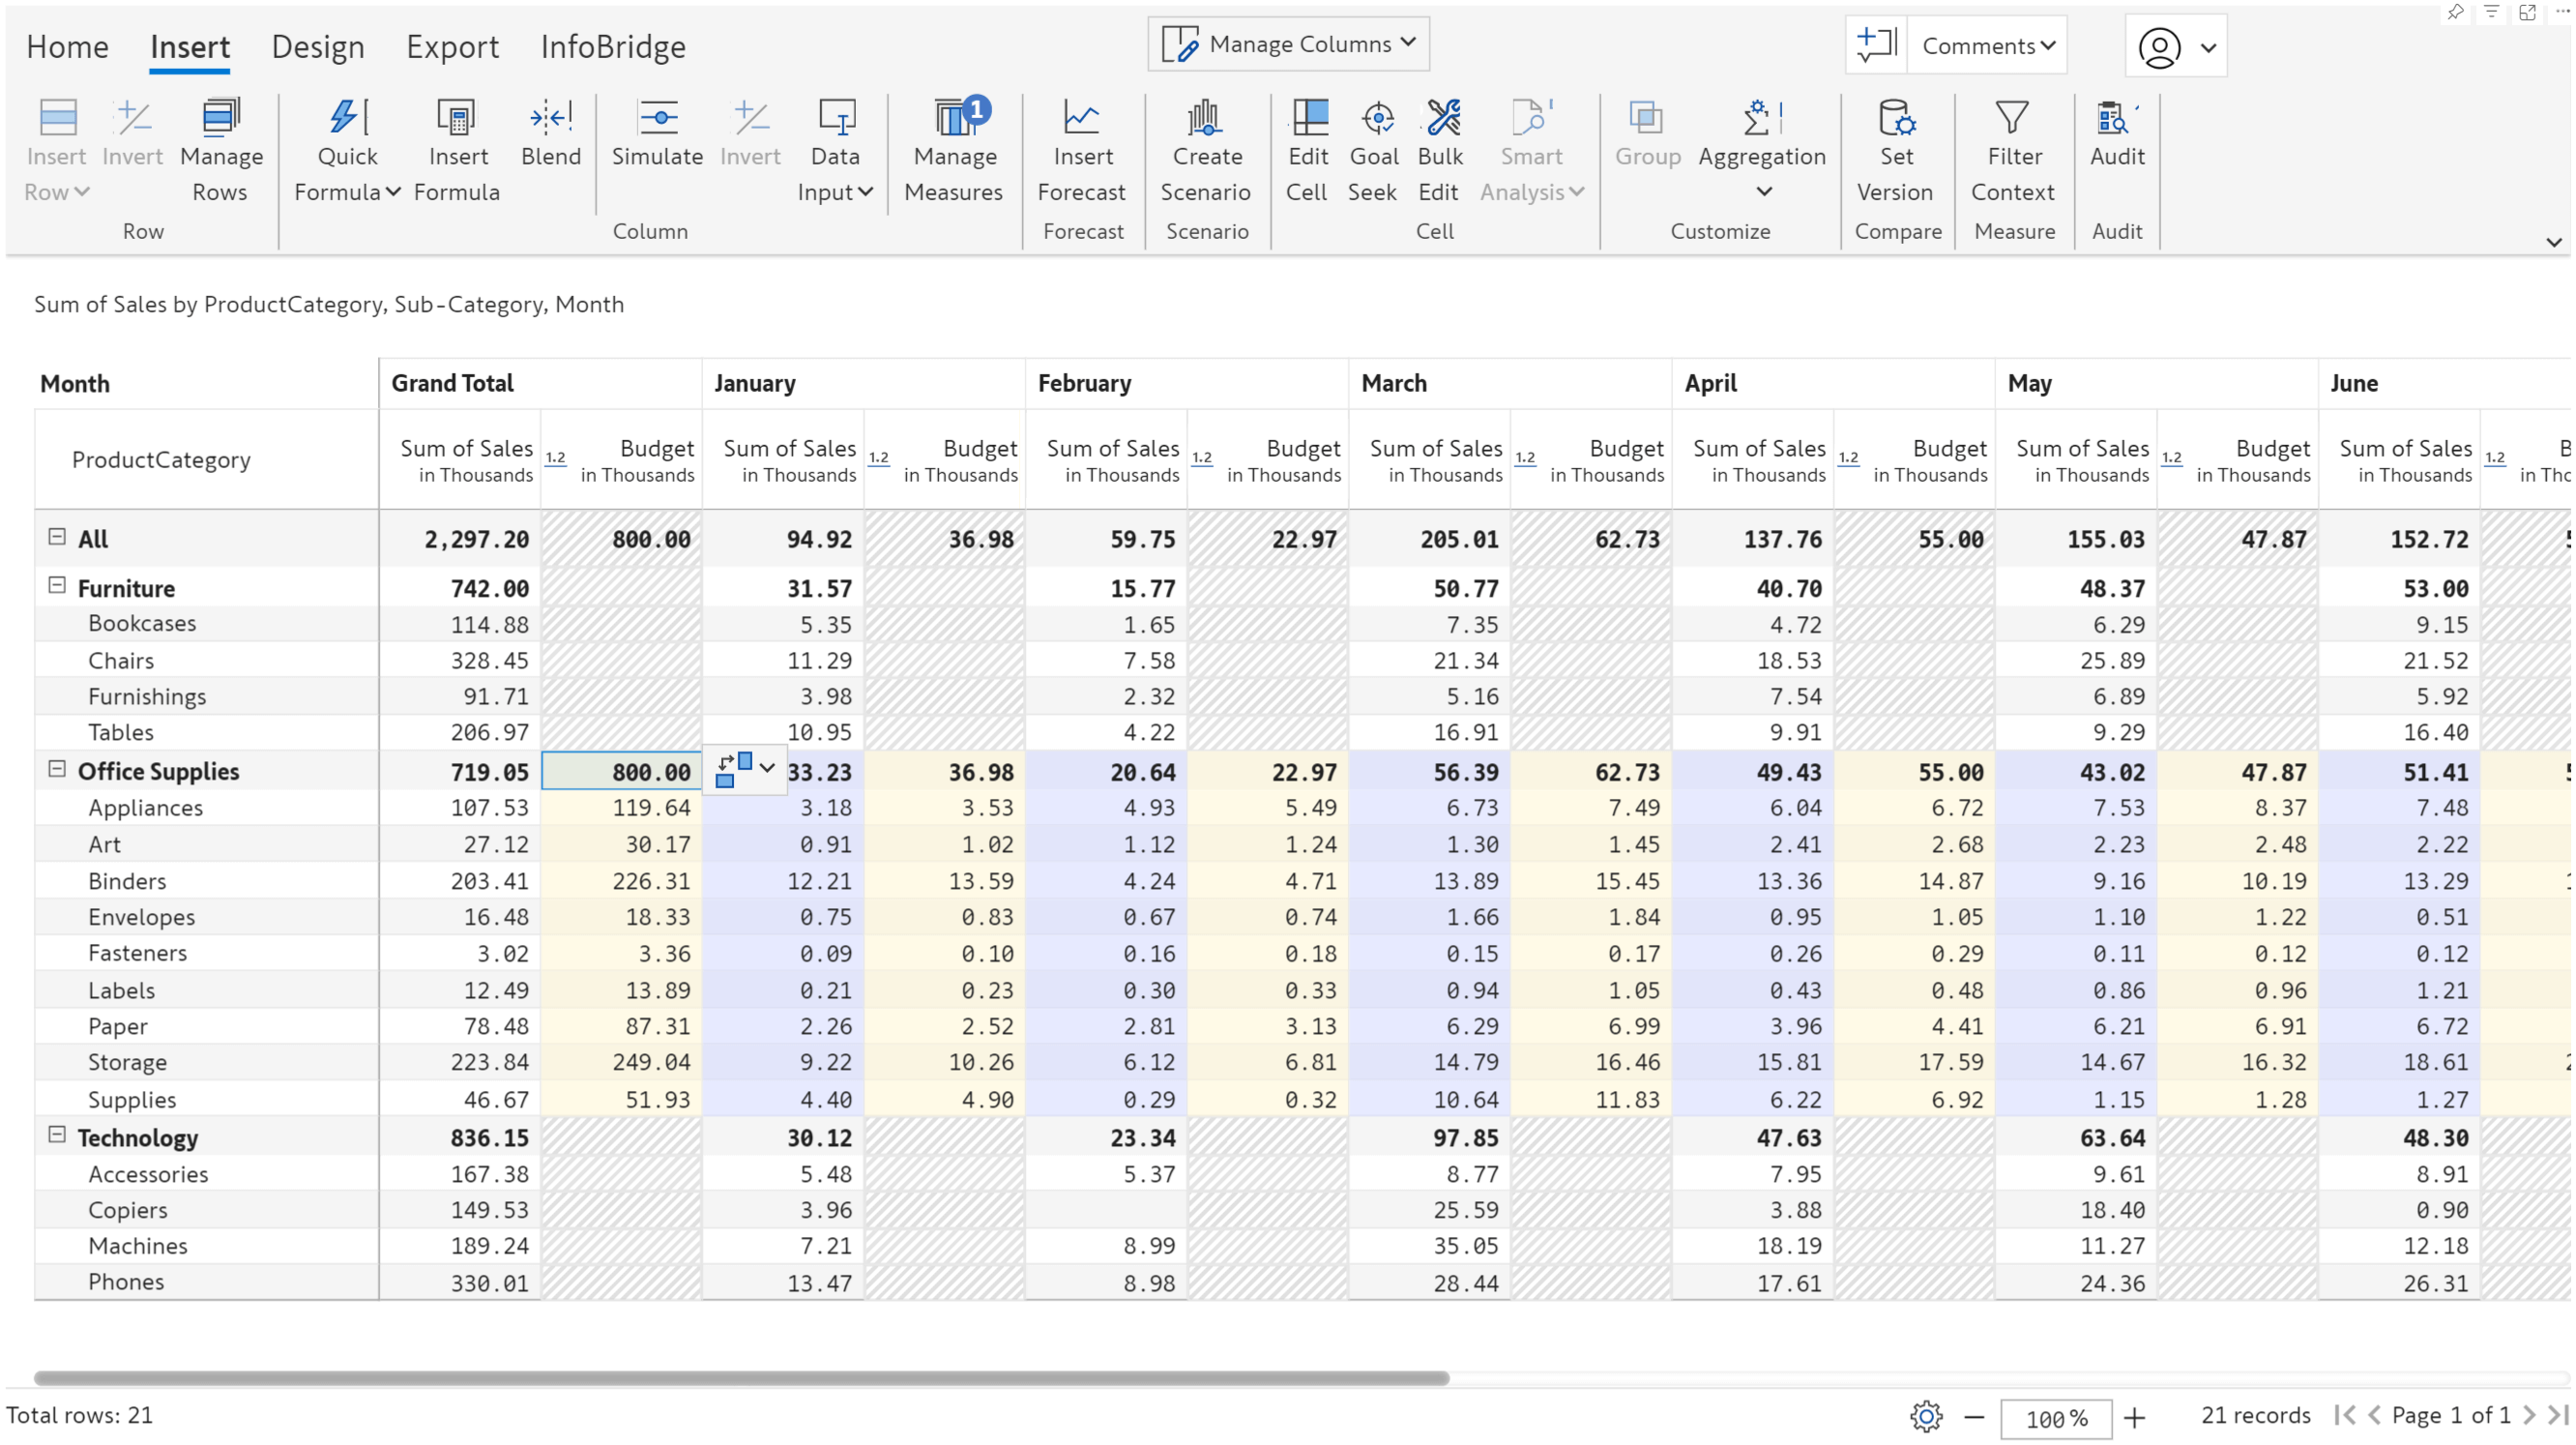
In the latest version, you can just click on the arrow that appears next to the adjustment value to copy and apply it.
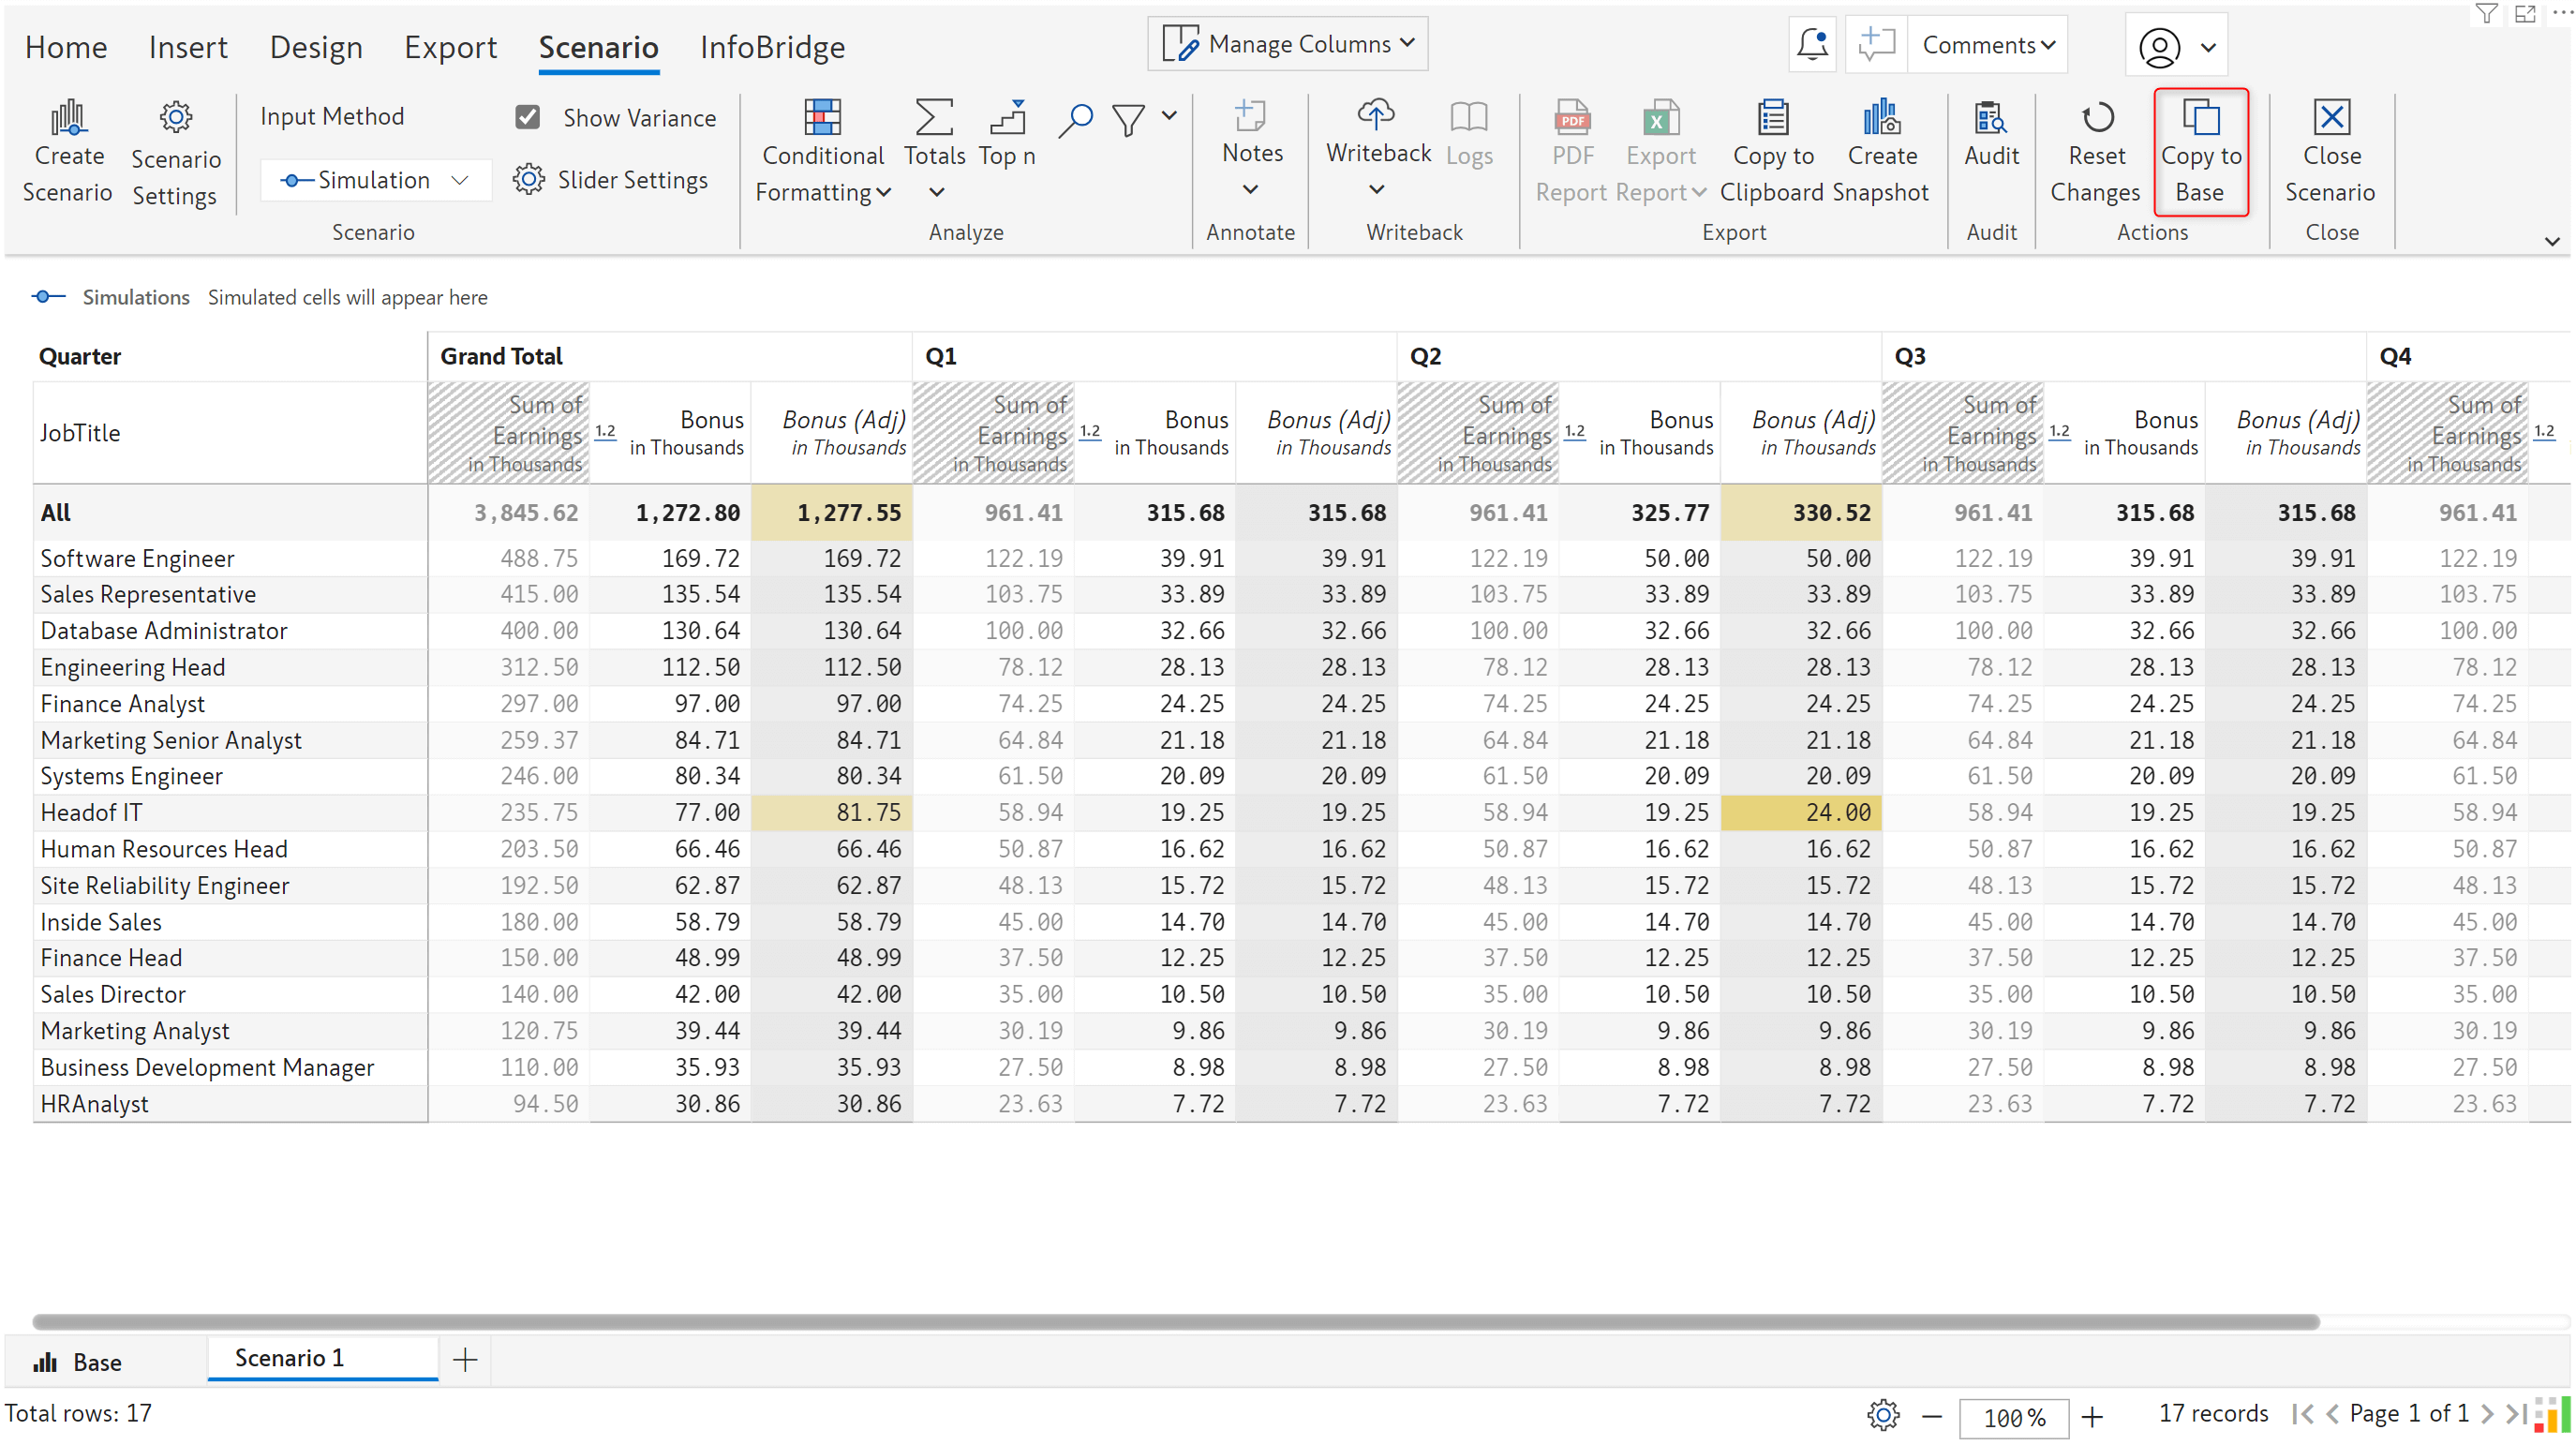
If you prefer to view adjustments in a scenario and run simulations before accepting the request, you will notice the Copy to Base option is now available in the scenario toolbar.
Infobridge facilitates data consolidation with its append feature. You can combine the data from different visuals corresponding to multiple regions or entities into a single target. When the data in any of the visuals is updated, the target query is refreshed automatically.
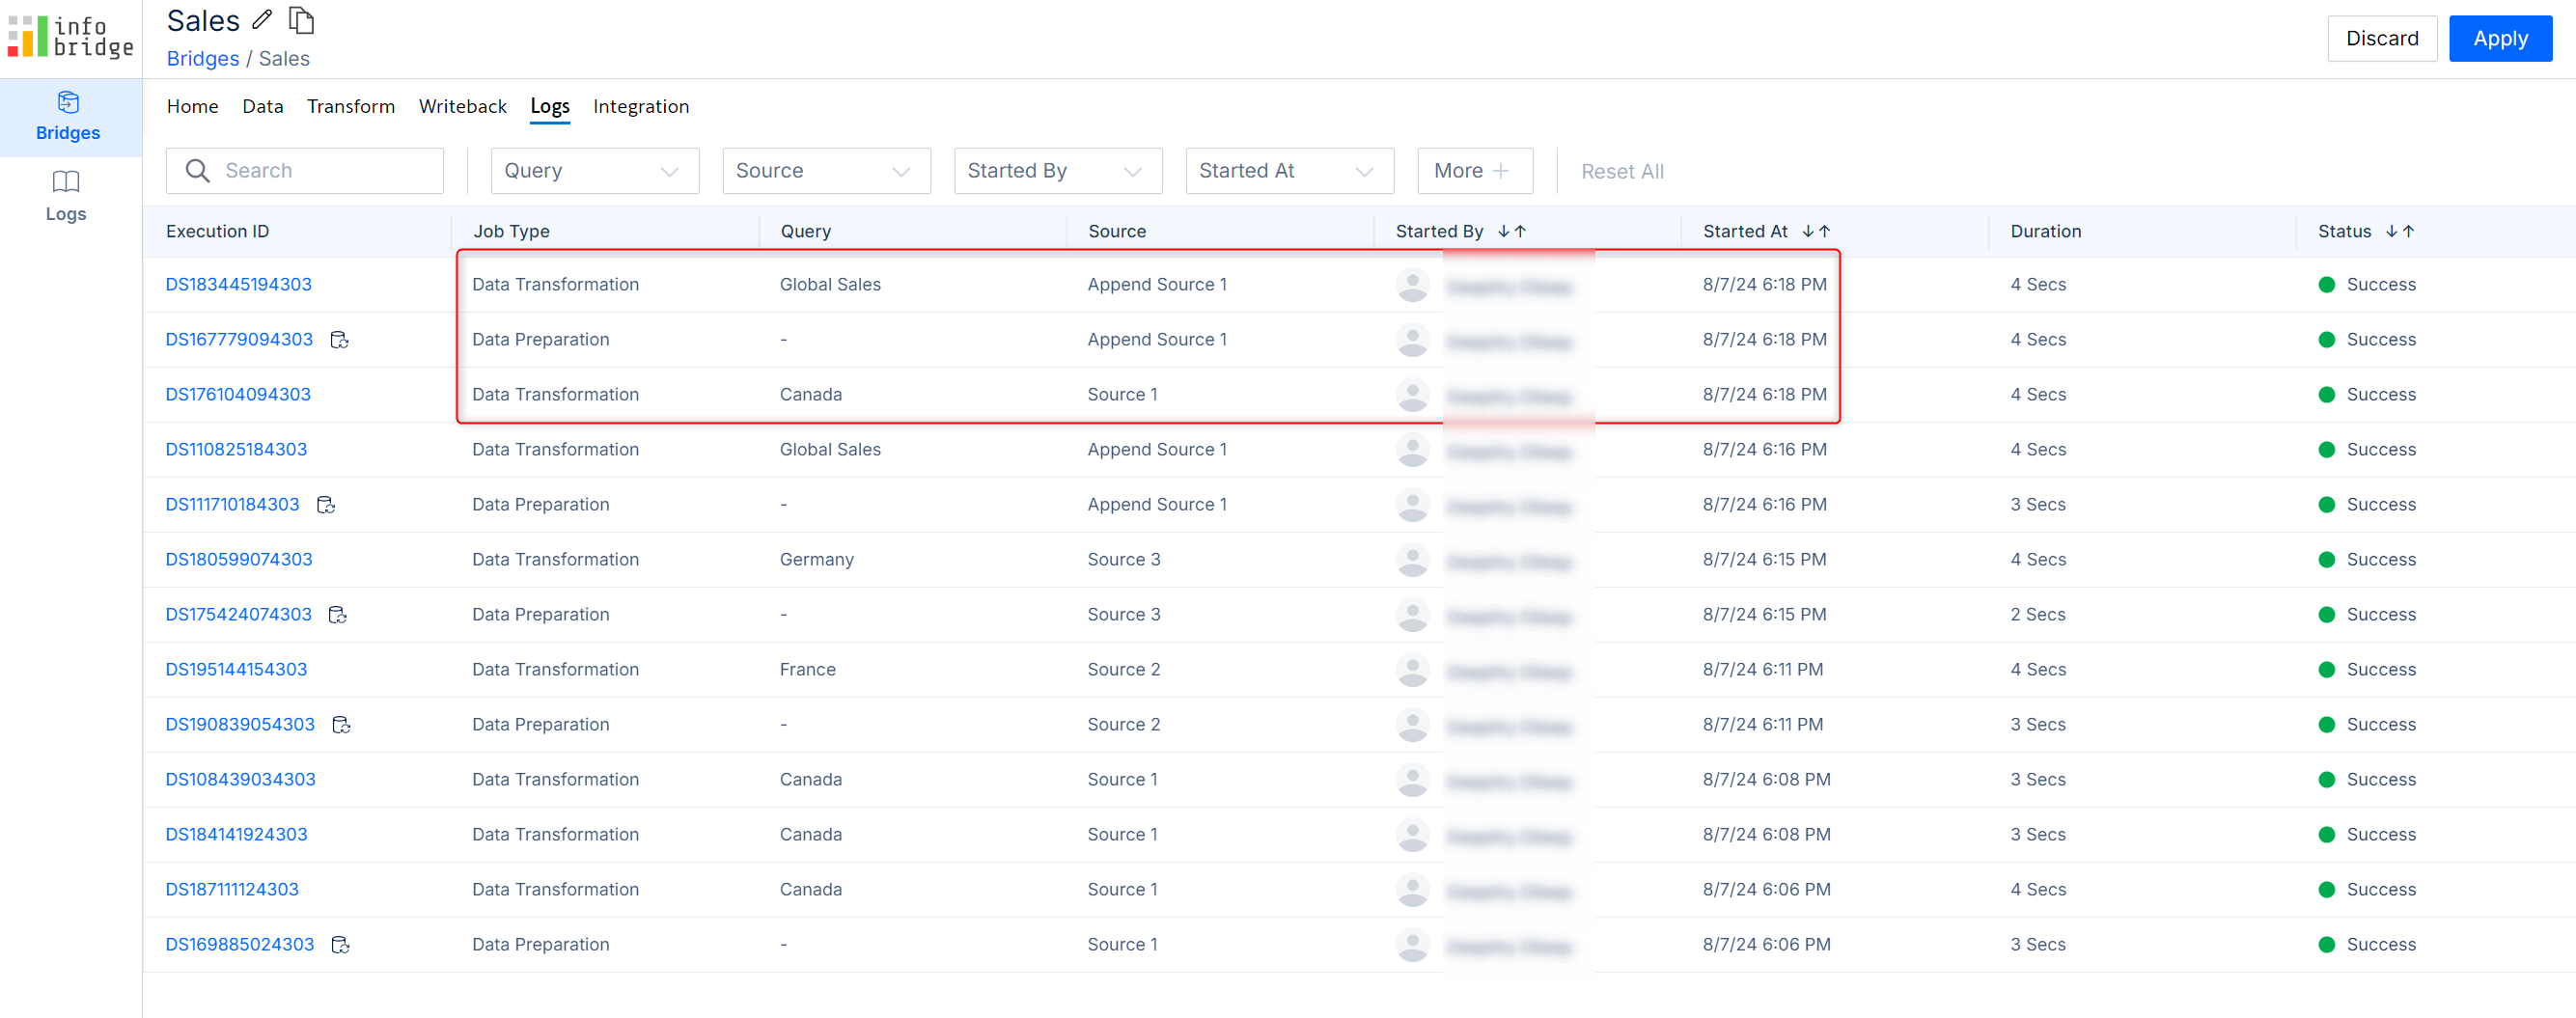
Infobridge generates progress notifications while syncing the source and target visuals. You will now be able to see the query name in the notifications, enabling you to easily recognize the source for a value update.
You can add measures in Infobridge with formulas referencing data input and native measures from the source visual.
The Infobridge measures can then be imported and referenced in other formulas in the target visual. This target visual itself can be a bridge to a third visual.
When the data input measure in the source visual is updated, irrespective of whether the target visual is open, the formula measure derived from the Infobridge measure will be automatically updated in the destination, and the corresponding values in the bridge will be updated.
Inforiver, and all of our planning and analytics products, continue to be updated to provide users of all types with optimal performance. With continual improvements and innovations planned, we welcome your feedback.
Visit the Inforiver Community to share your ideas, vote on others’ submissions, and interact with other users.
Discover new planning, reporting, and analytics innovations with Inforiver today.

Inforiver helps enterprises consolidate planning, reporting & analytics on a single platform (Power BI). The no-code, self-service award-winning platform has been recognized as the industry’s best and is adopted by many Fortune 100 firms.
Inforiver is a product of Lumel, the #1 Power BI AppSource Partner. The firm serves over 3,000 customers worldwide through its portfolio of products offered under the brands Inforiver, EDITable, ValQ, and xViz.

Learn how to accelerate your migration from Tableau, Qlik, Cognos, Spotfire, and SAP to Power BI using Inforiver - featuring faster development, advanced visuals, and a live demo.