Upcoming webinar on 'Inforiver Charts : The fastest way to deliver stories in Power BI', Aug 29th , Monday, 10.30 AM CST. Register Now
Upcoming webinar on 'Inforiver Charts : The fastest way to deliver stories in Power BI', Aug 29th , Monday, 10.30 AM CST. Register Now
In this release, we've significantly optimized the data processing for Inforiver visuals and other sources within InfoBridge. We have also released enhancements to template rows and data inputs that will give you increased control over your visual rows and columns.
Discover the latest Inforiver innovations that drive better planning, analytics, and data visualizations across your organization in this release:
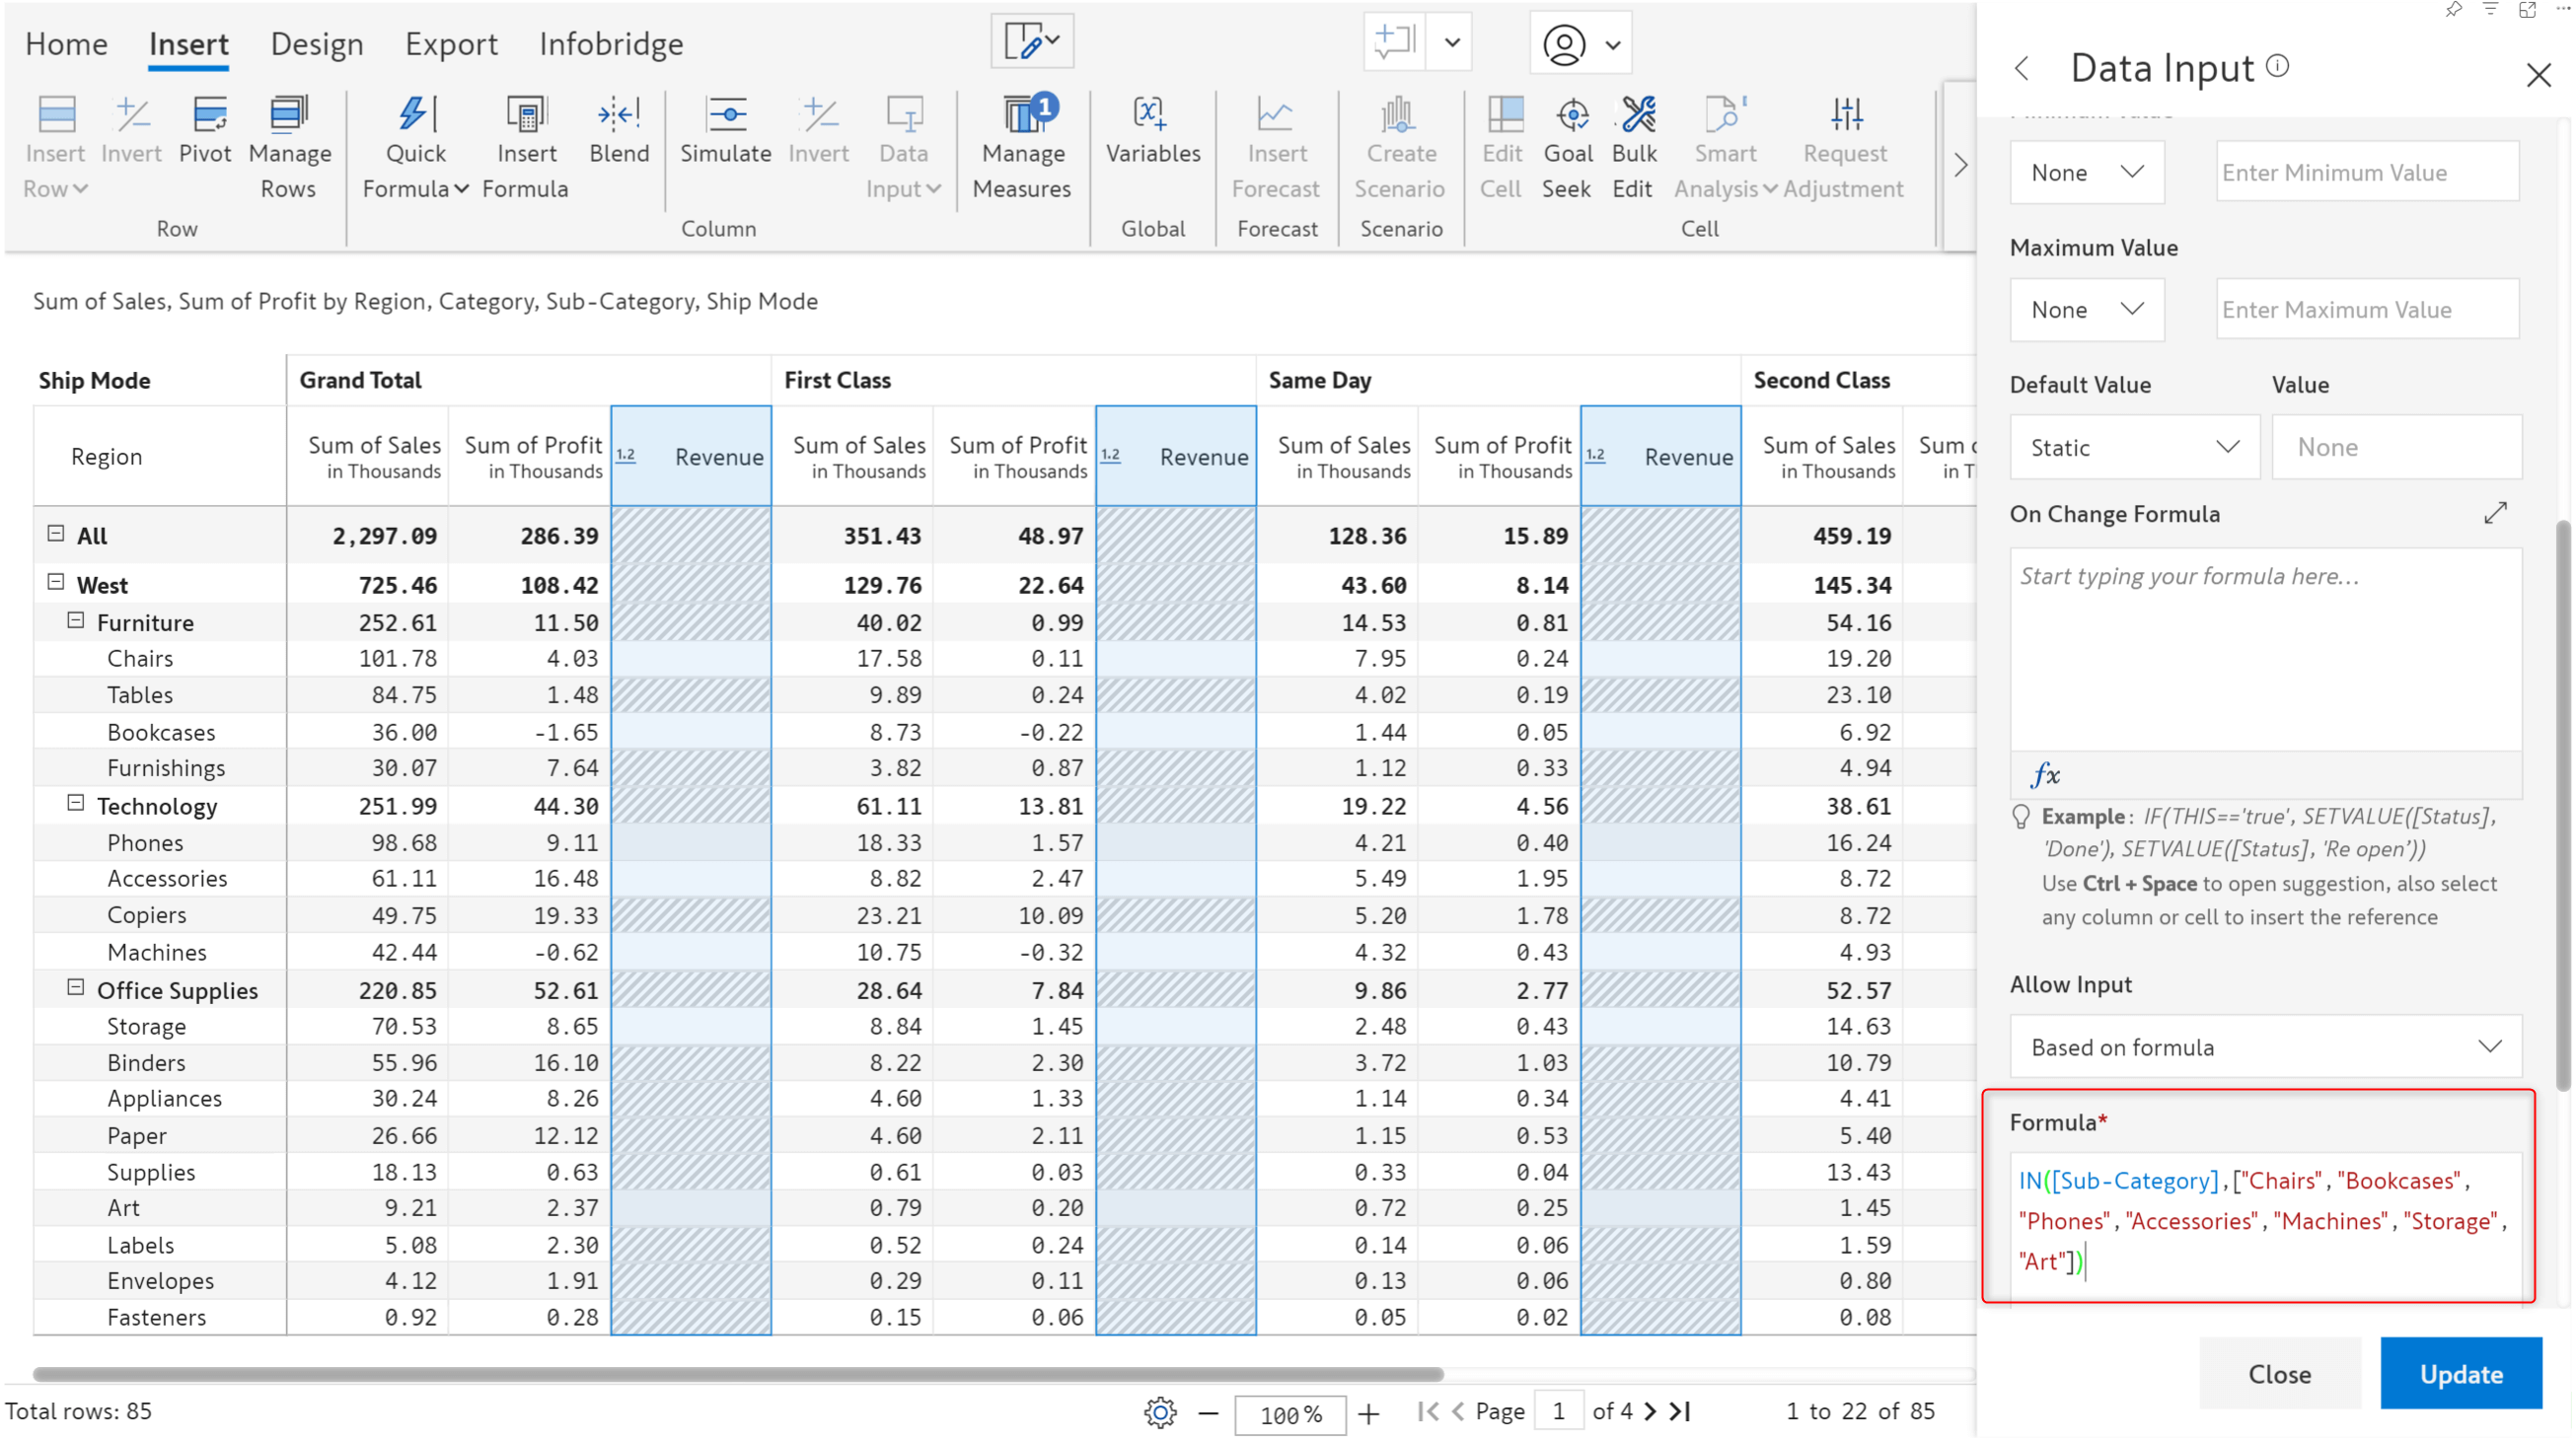
Inforiver allows report authors to restrict data input based on a formula. You can choose the ‘Based on Formula’ option in the Allow Input dropdown. Data entry will only be allowed in cells where the formula is evaluated to be true.
In earlier versions, when data input was allowed on a child row, the parent row would also be editable.
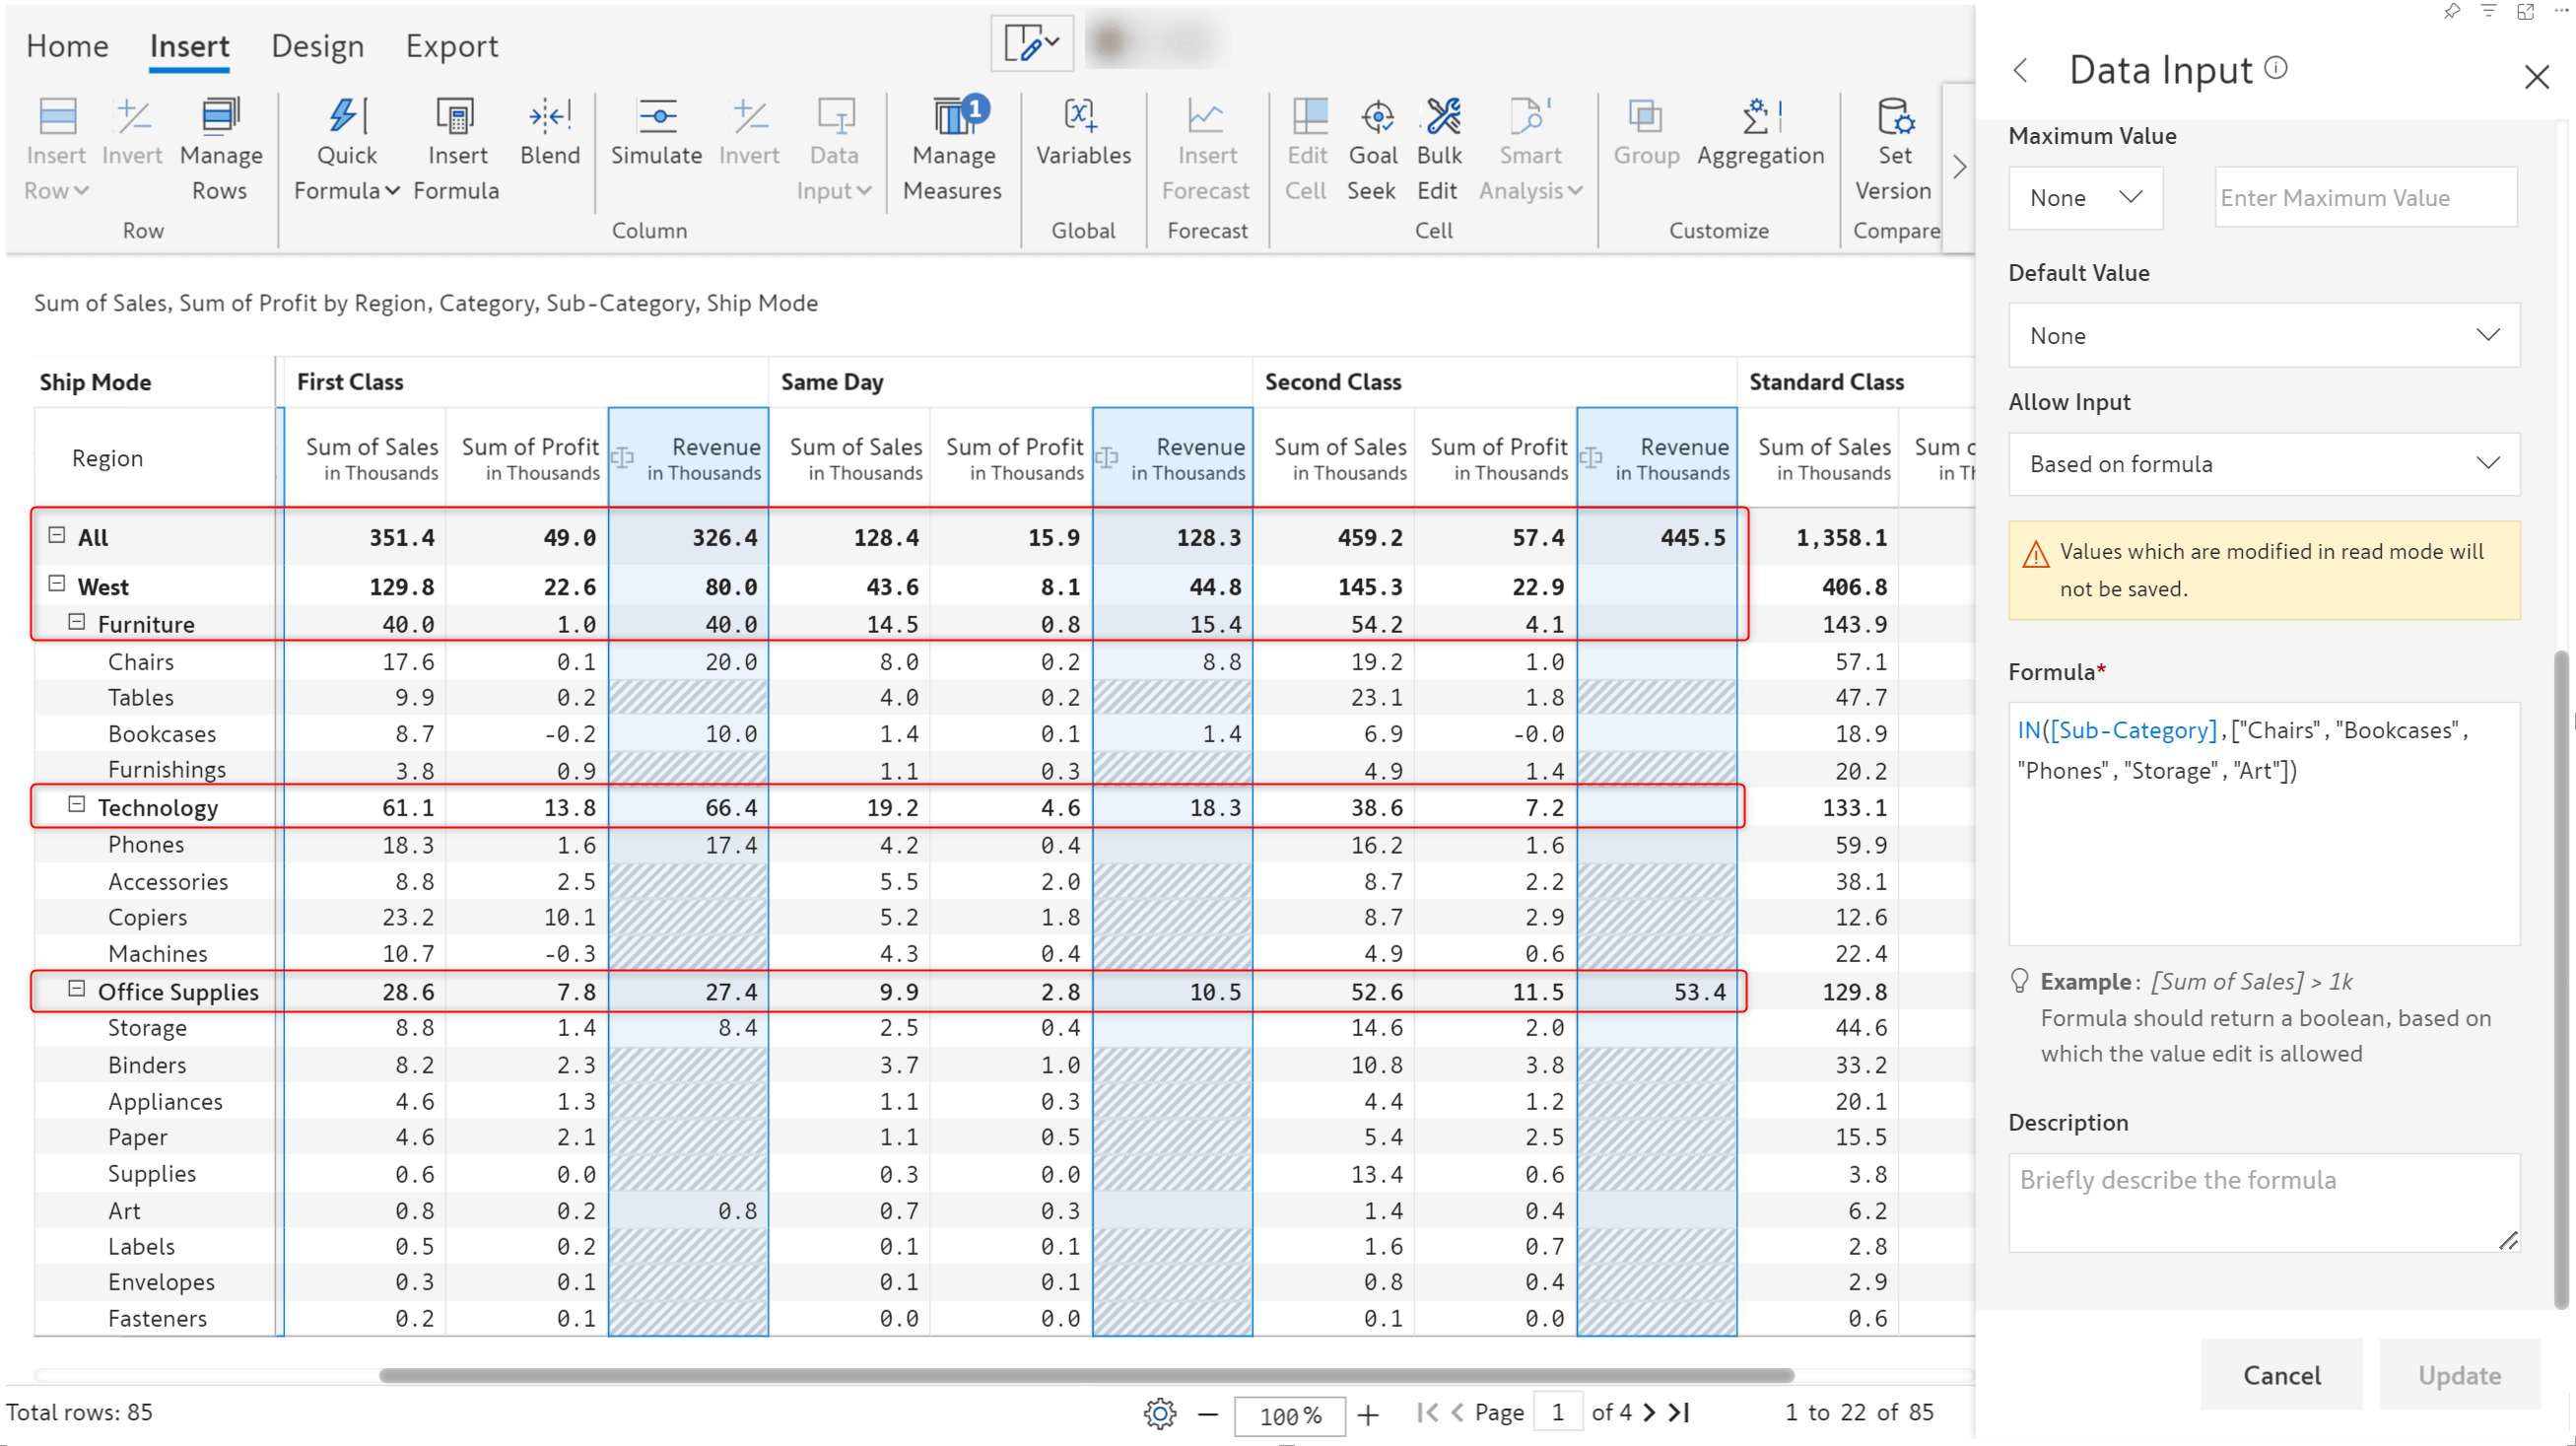
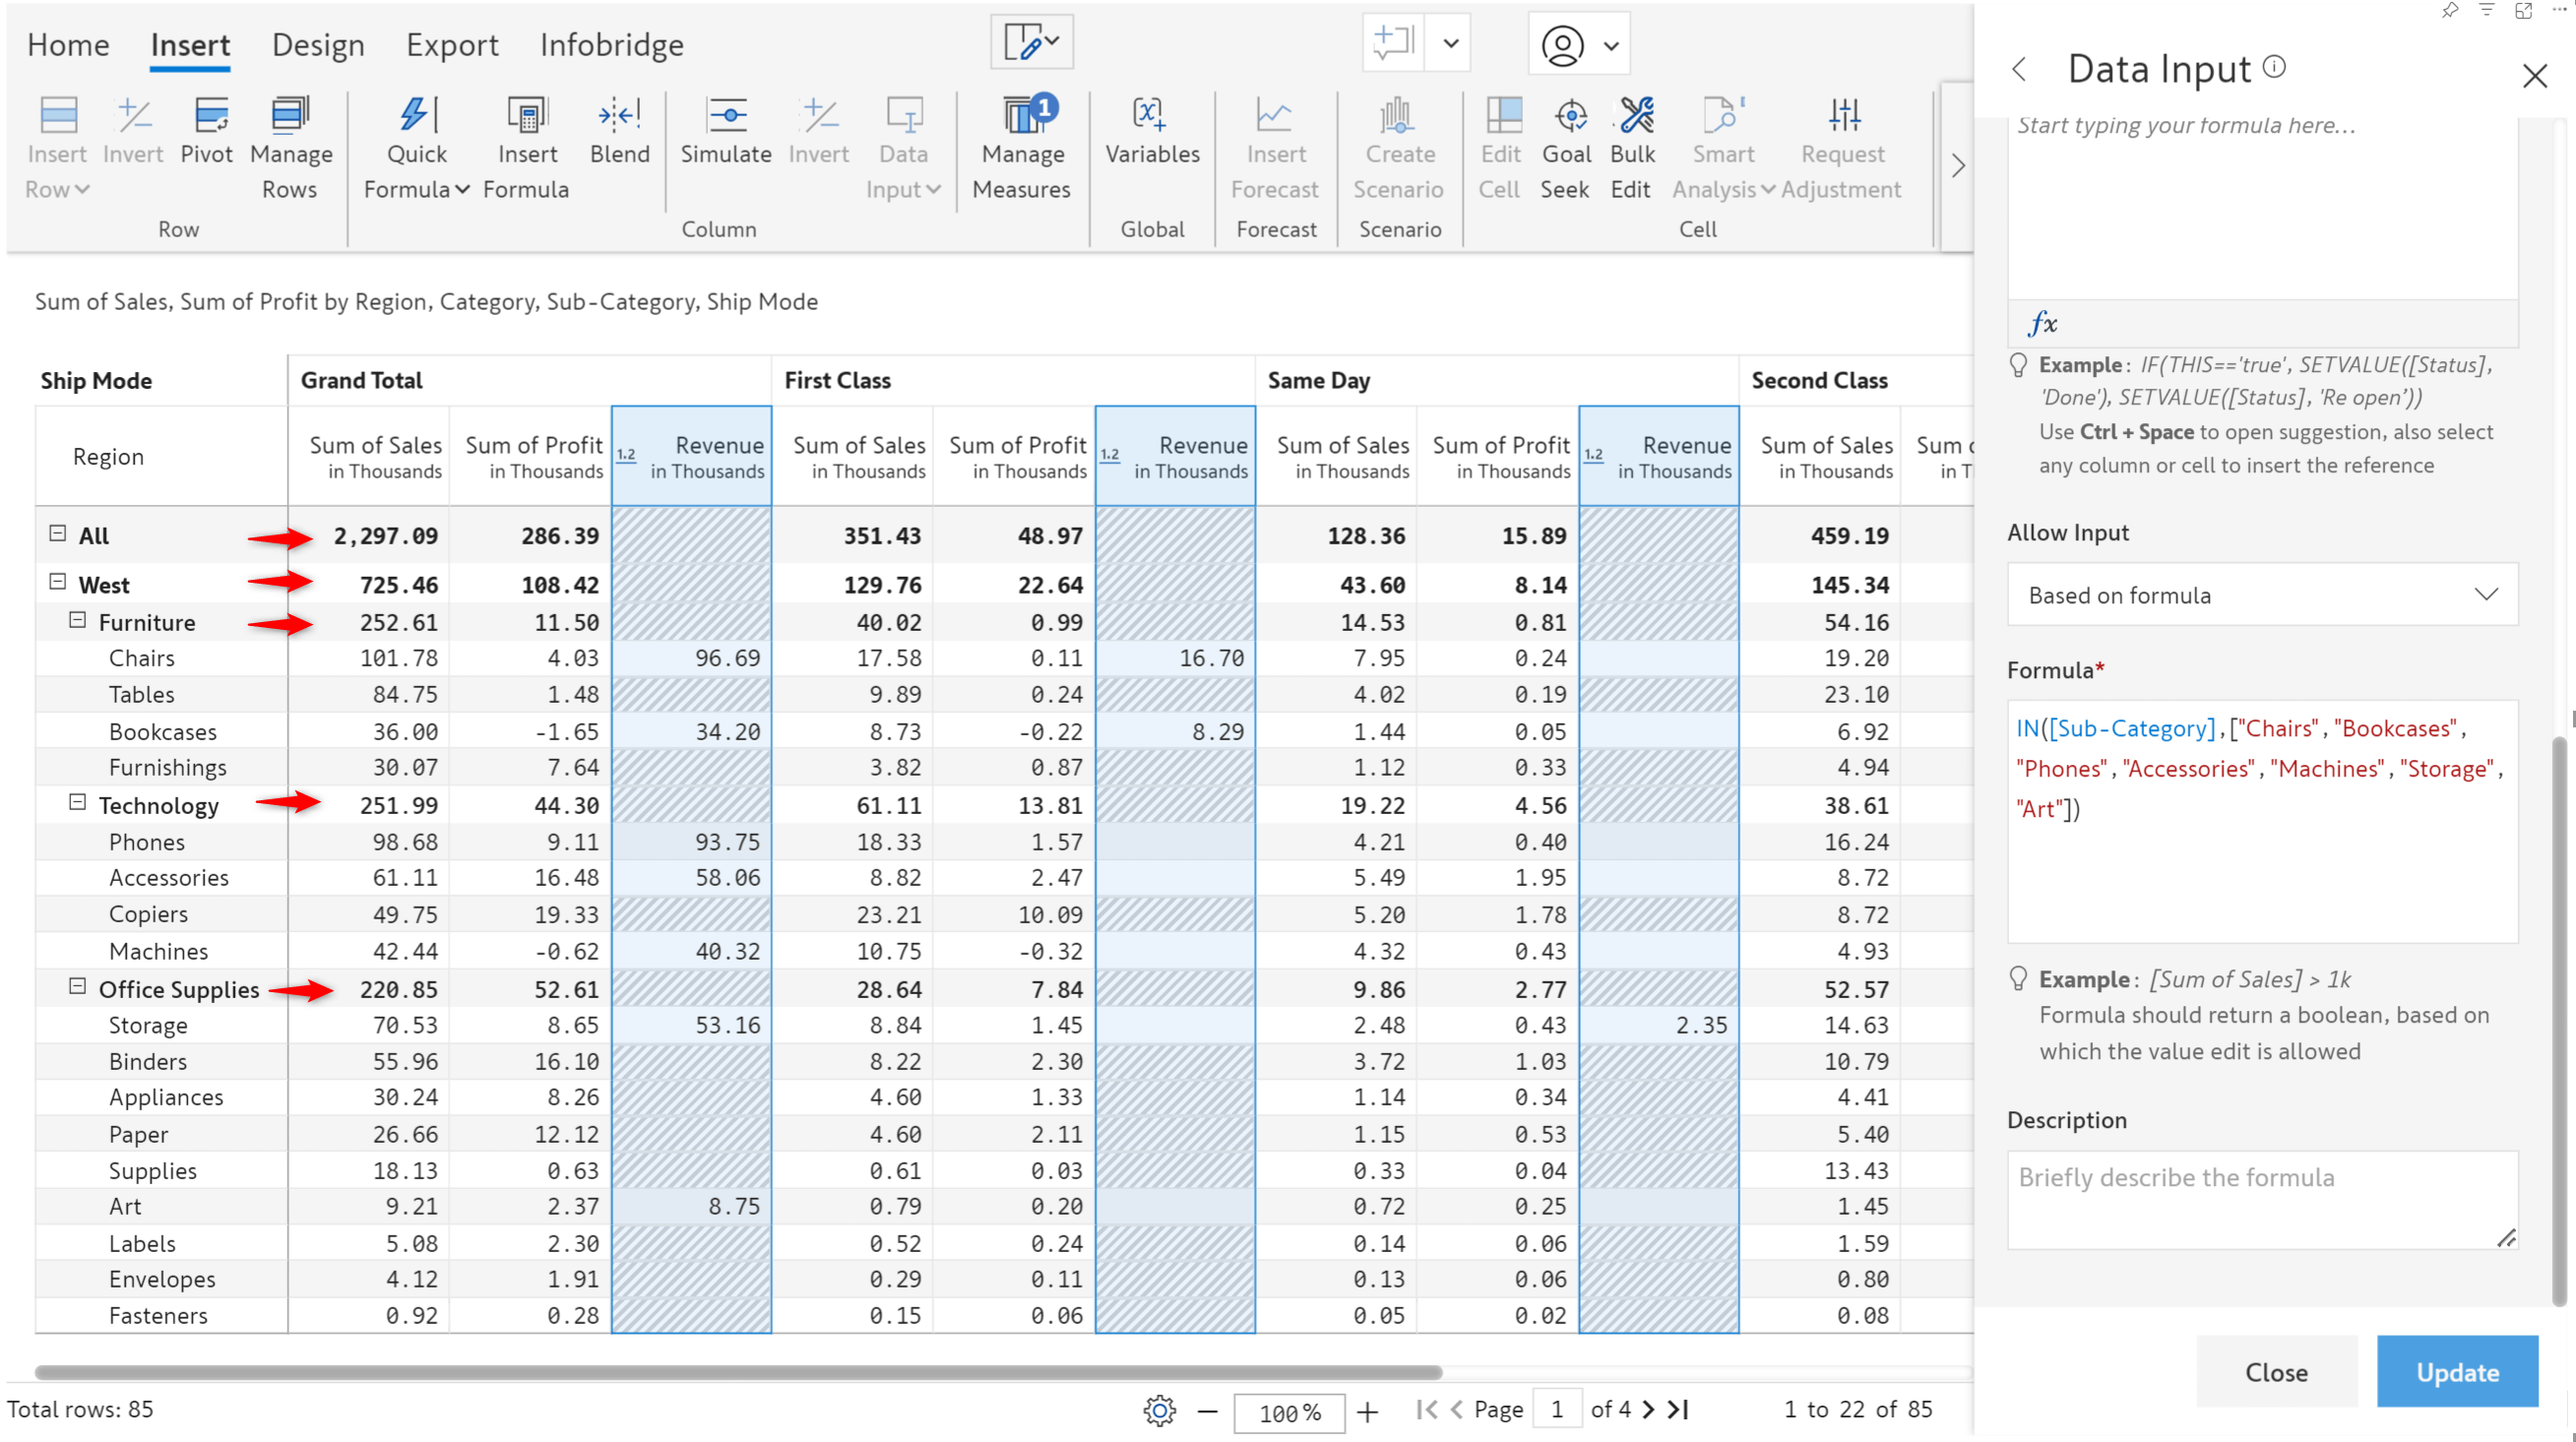
In the latest version, data entry will be restricted to parent rows even if child rows are editable. Remember that this will work only when aggregation is set to ‘None.’
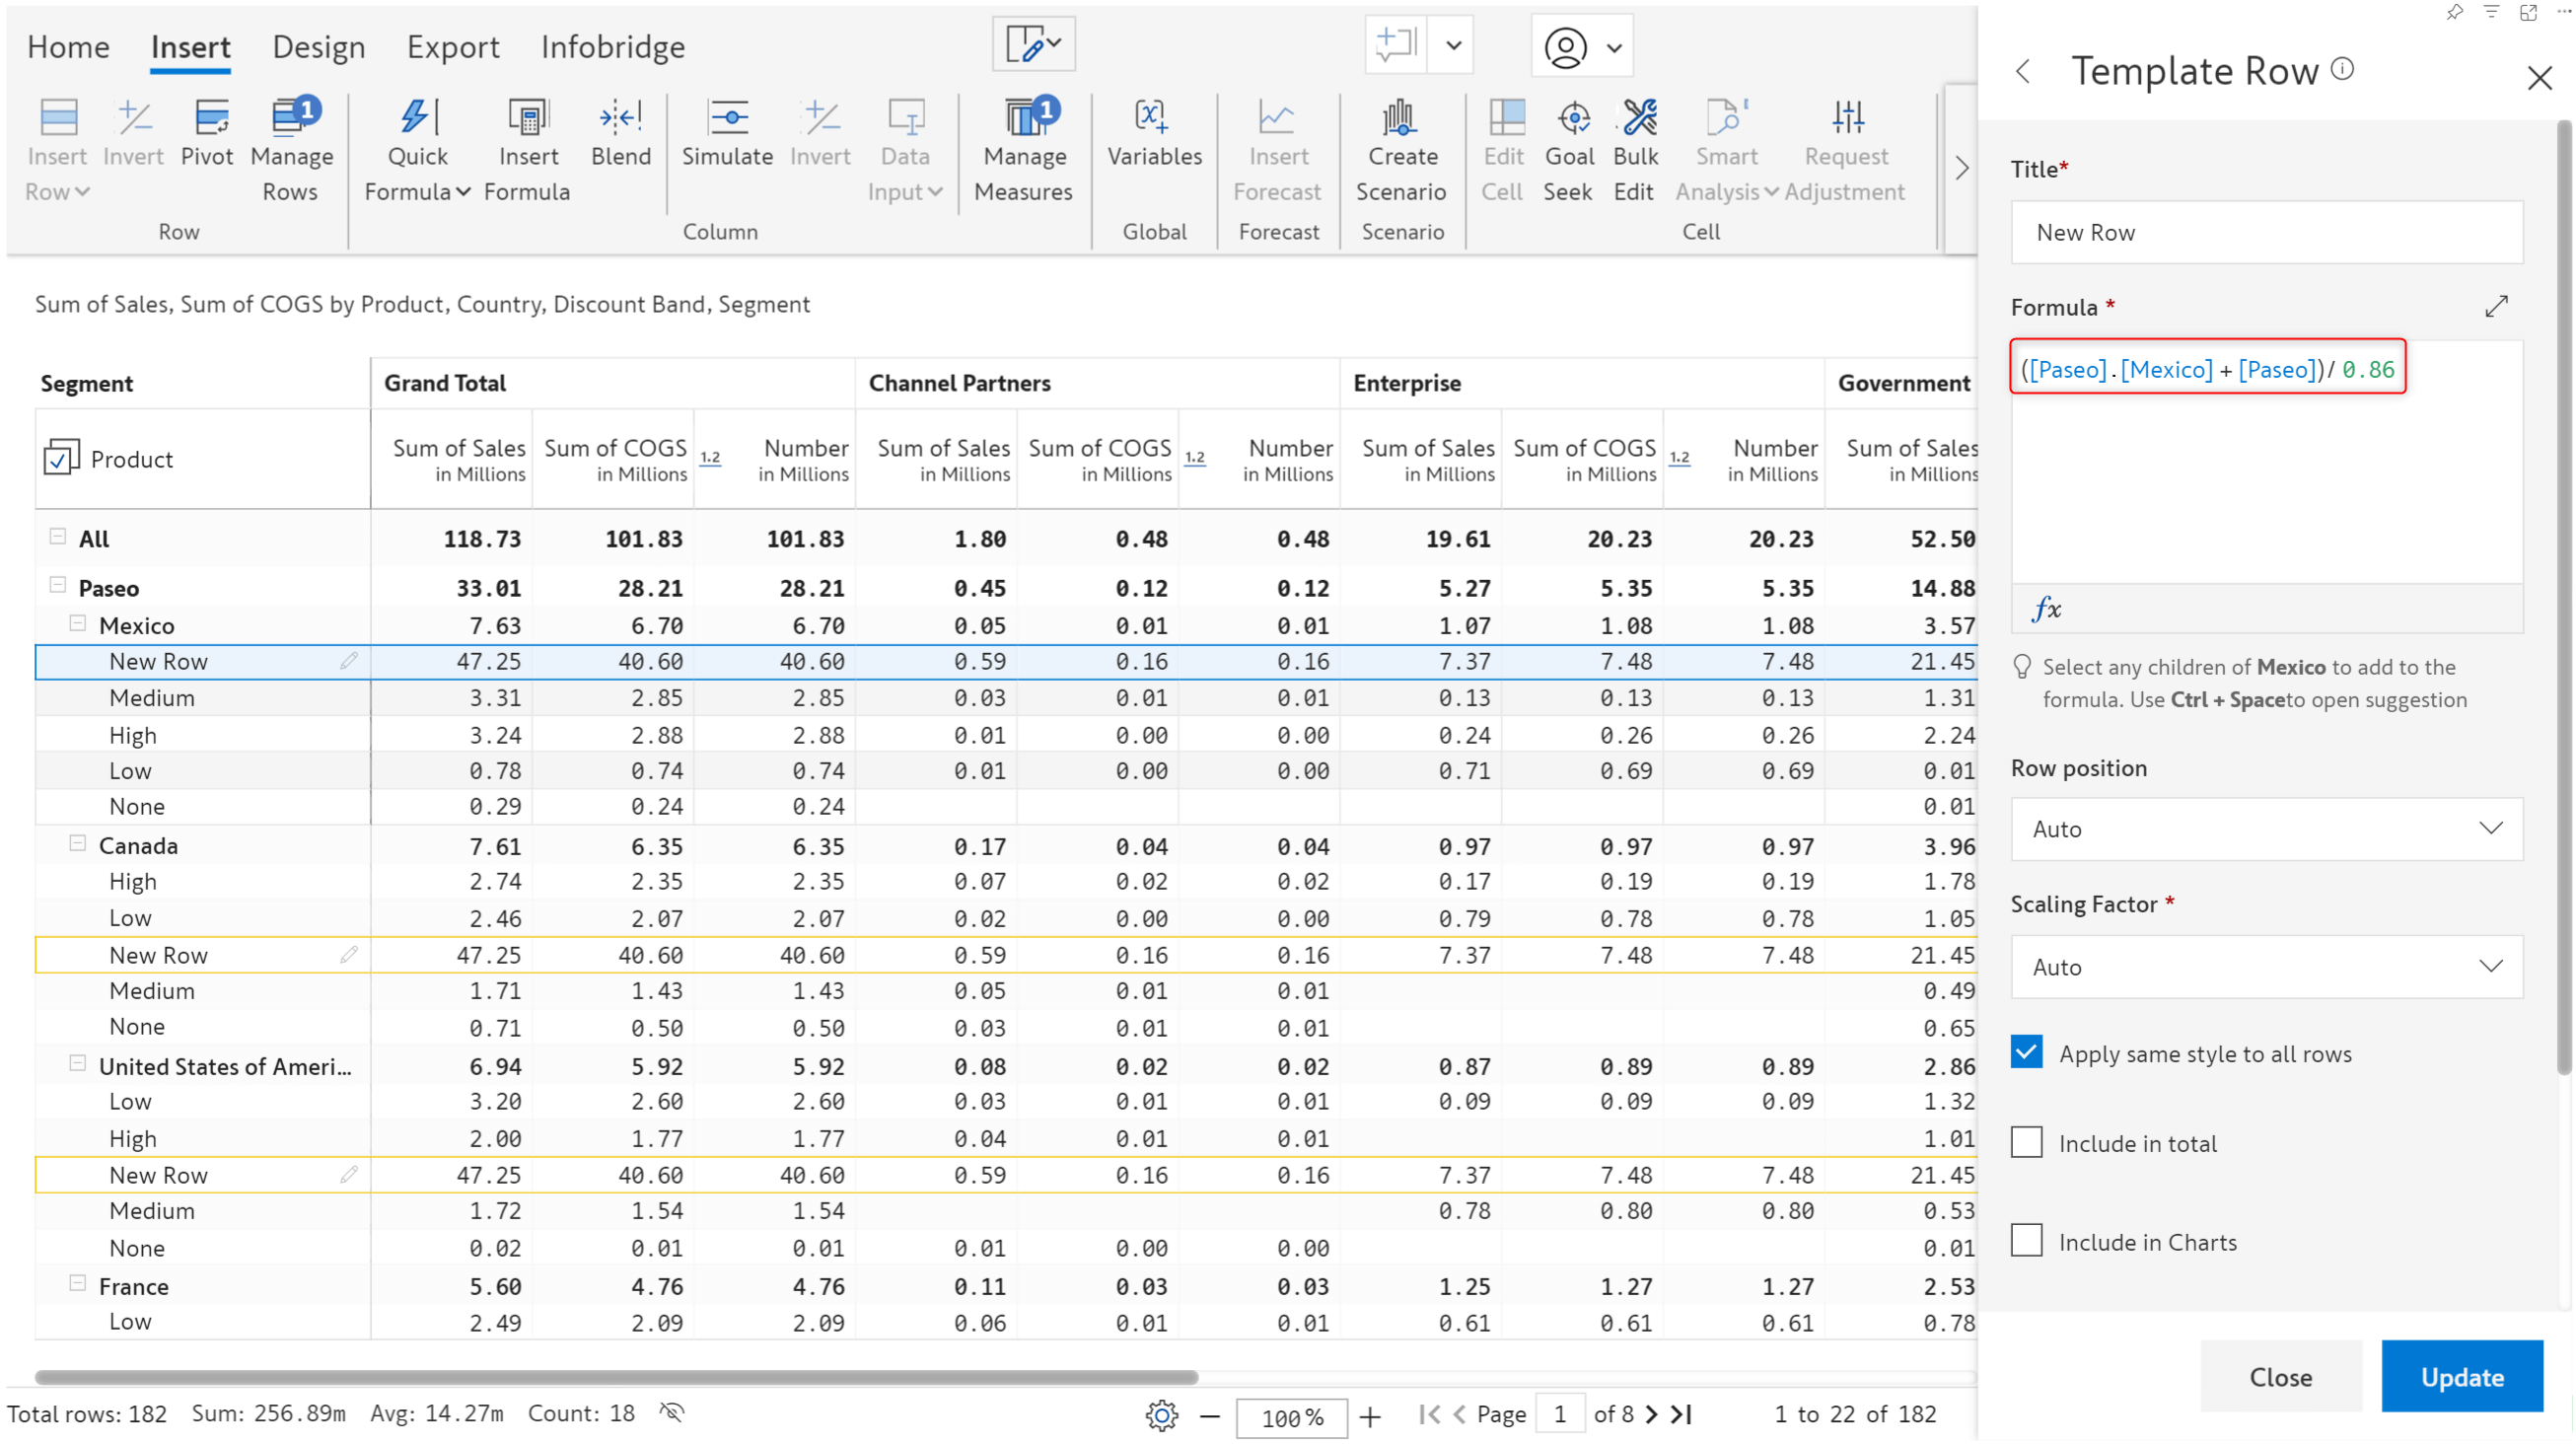
Inforiver allows you to insert Template Rows at each hierarchy level for hierarchical datasets. In earlier versions, you could not refer to parent rows or categories from higher levels. The latest release will allow you to reference row dimension categories at higher levels while creating a template row. Just click on the parent category to reference it in a formula.
The data processing optimizations made in Infobridge include not only faster processing of individual visuals but also enhanced data transfer from the visual to InfoBridge. These improvements ensure that transformed data is consumed more swiftly by other integrated visuals, boosting the performance of connected planning models. The result is a much more efficient flow of data through the visuals. Learn more from Infobridge documentation.
This brings us to the end of the Inforiver Writeback Matrix release updates.
Inforiver and all of our planning and analytics products continue to be updated to provide users of all types with optimal performance. With continual improvements and innovations planned, we welcome your feedback. Visit the Inforiver Community to share your ideas, vote on others’ submissions, and interact with other users.
Discover new planning, reporting, and analytics innovations with Inforiver today.

Inforiver helps enterprises consolidate planning, reporting & analytics on a single platform (Power BI). The no-code, self-service award-winning platform has been recognized as the industry’s best and is adopted by many Fortune 100 firms.
Inforiver is a product of Lumel, the #1 Power BI AppSource Partner. The firm serves over 3,000 customers worldwide through its portfolio of products offered under the brands Inforiver, EDITable, ValQ, and xViz.