
Upcoming webinar on 'Inforiver Charts : The fastest way to deliver stories in Power BI', Aug 29th , Monday, 10.30 AM CST. Register Now
Upcoming webinar on 'Inforiver Charts : The fastest way to deliver stories in Power BI', Aug 29th , Monday, 10.30 AM CST. Register Now
Welcome to the Inforiver Writeback Matrix 3.0. release updates!
The 3.0 release is a giant leap forward in broadening Inforiver into a full-spectrum data integration, advanced connected & integrated planning, and business reporting suite. In this landmark release, we’ve integrated InfoBridge with Inforiver.
The Infobridge story
Business reporting and planning with Inforiver often involves a multi-page report with data at varying granularities. The data from multiple visuals would also need to be written back into a single writeback table or be consumed in a consolidated P&L statement or in an executive dashboard that aggregates data to the highest level. Common use cases are:
Traditionally, such requirements would incur overheads and process inefficiencies via composite modelling, extensive DAX & SQL scripting, BI development & IT expertise. This is where Infobridge can turn the tide.
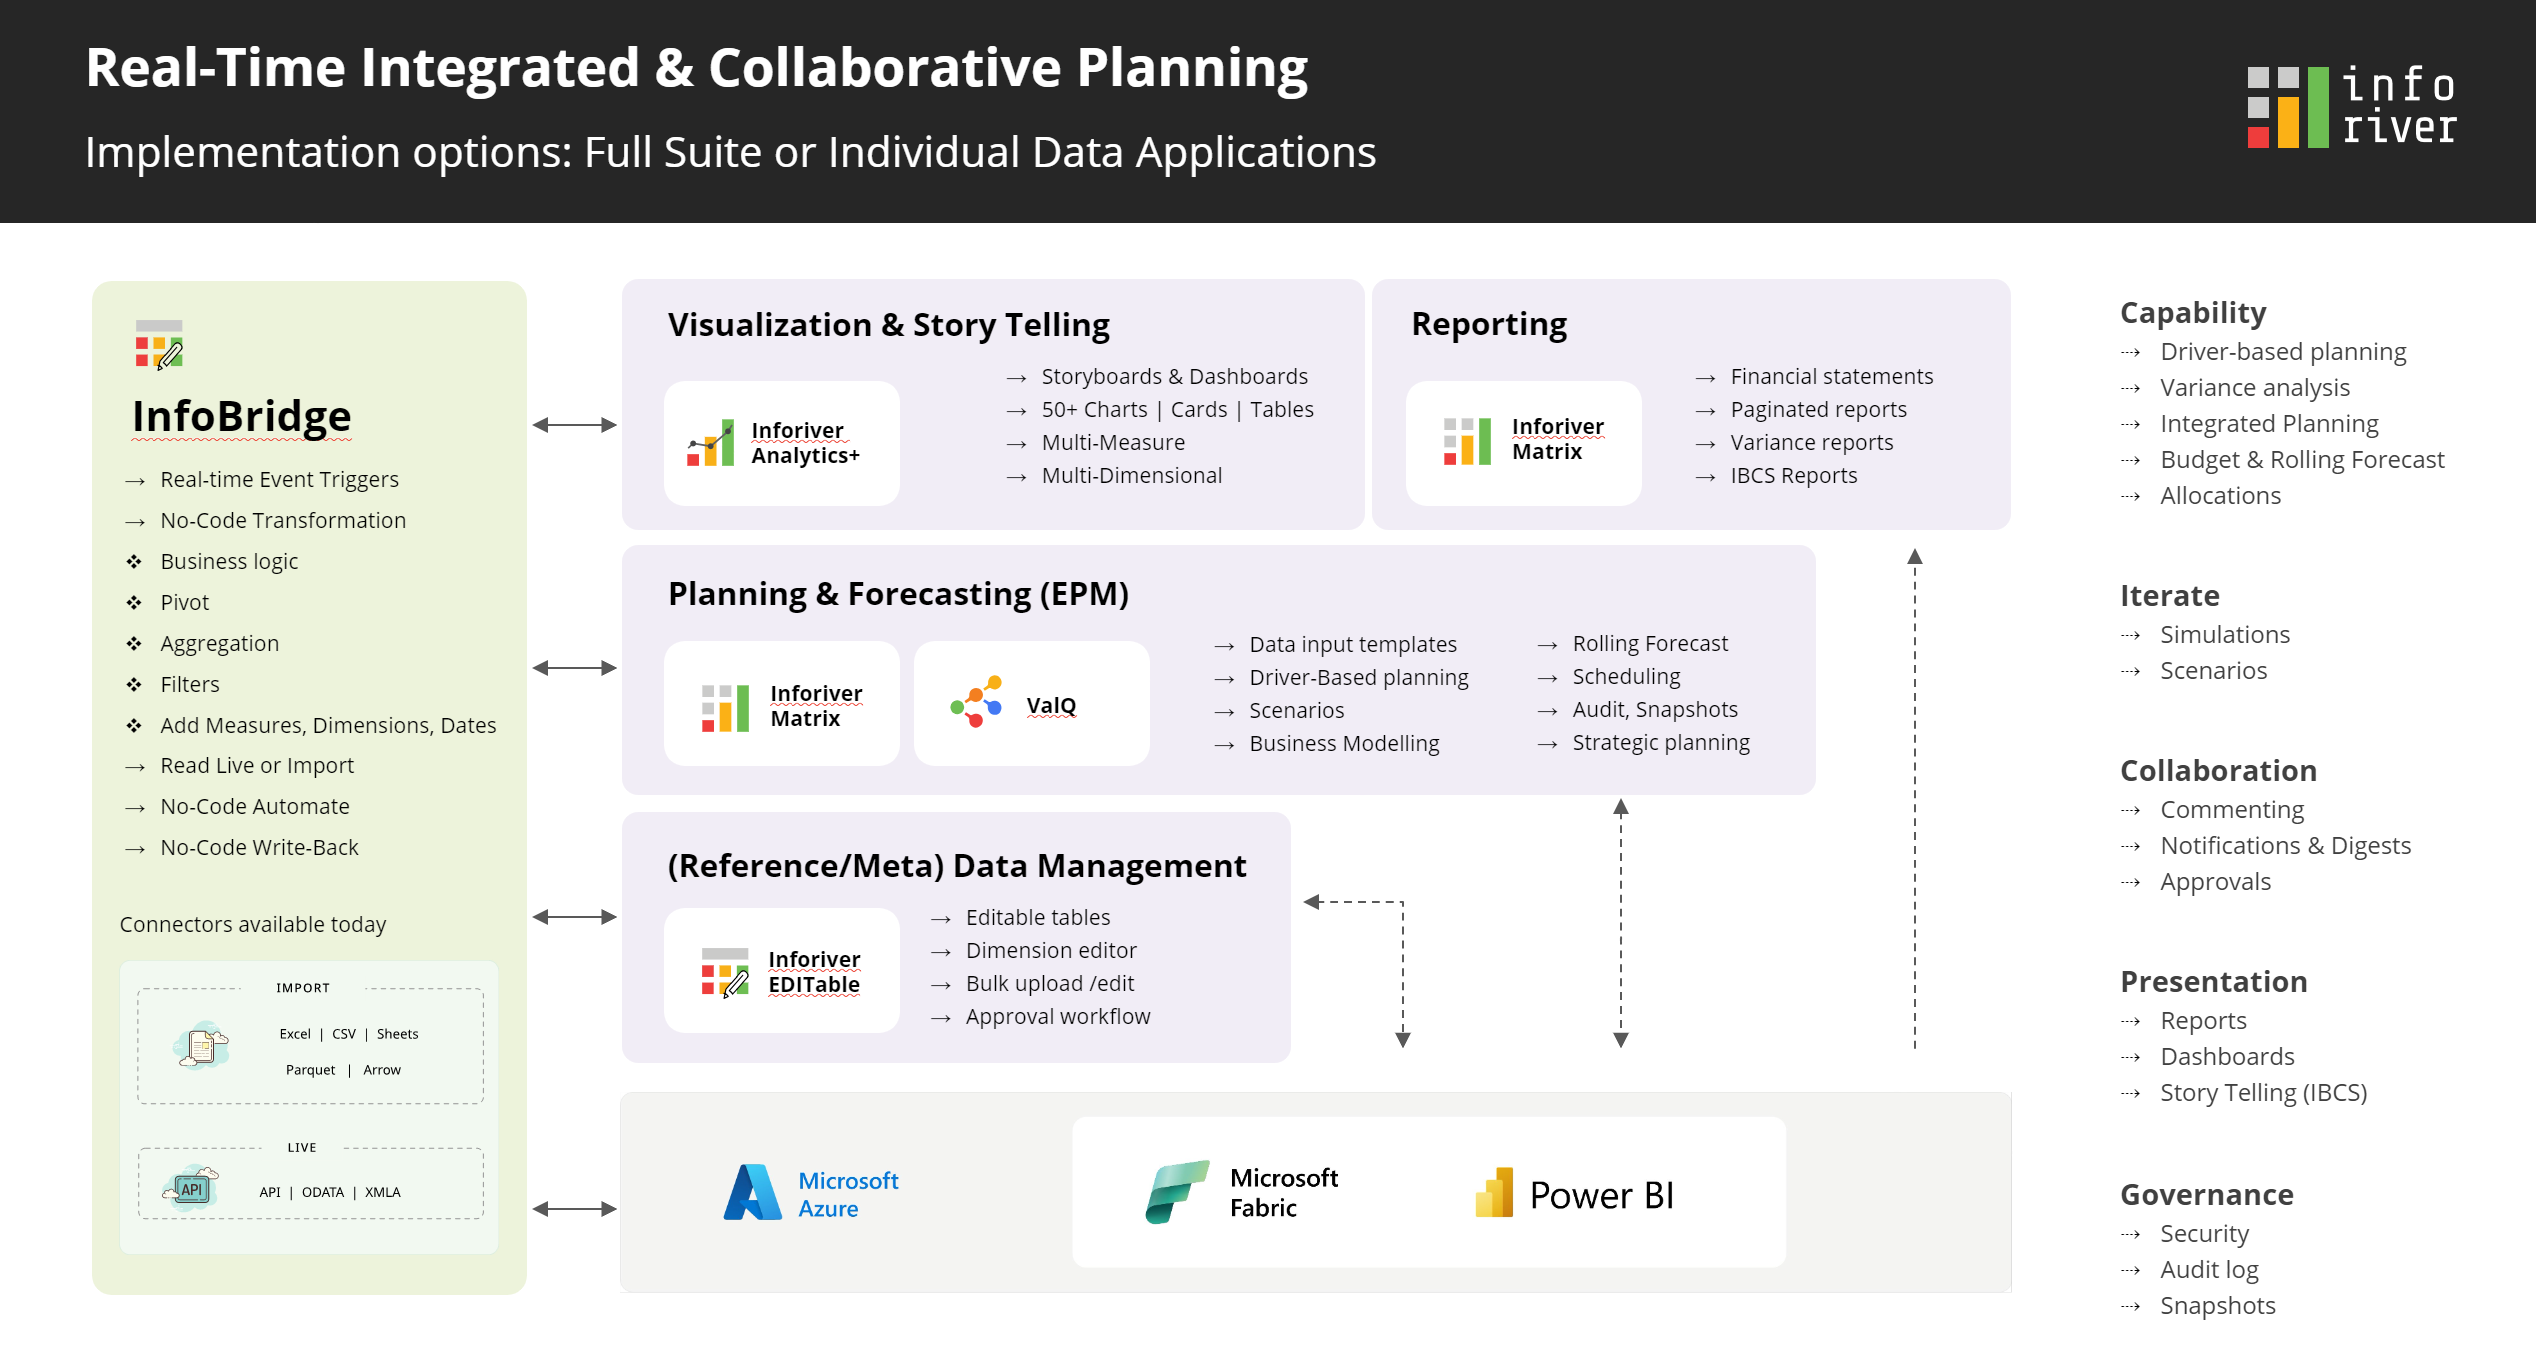
Infobridge is a no-code, collaborative planning portal that brings inter-visual communication, data consolidation, and transformation capabilities inside your existing Power BI reports. With InfoBridge, you can perform real-time data transformations with the capabilities of Power Automate, Power Query, and the Inforiver Writeback engine all rolled into one!
What makes Infobridge a cut above the rest?
In parallel, we are also launching One Workspace – a single access point for all Lumel product offerings. Among the numerous features being rolled out as part of this release, the key enhancements are performance boosts for high-volume writeback, weekly/daily forecasts, an upgraded interface for creating visual hierarchies, and the bulk edit feature for updating cells.
Discover the innovations driving our product as we continue to deliver the features most anticipated by the Inforiver community. Thank you for choosing Inforiver!
The release notes are organized into toolbar sections. Feel free to explore the sections that interest you.
1.2 Mapping data from a bridge
1.3 Inserting data from the bridge
1.4 Real-time inter-visual updates
1.5 Inserting measures from another visual
1.6 Transforming data within InfoBridge
3.1 Superior performance for high-volume writeback
3.2 Replace dimensions in writeback with the corresponding ID field
4.1 Formula measures as default values
4.2 Redesigned interface for creating custom hierarchies
4.3 API to refresh Semantic data model
4.5 Copy from rows for non-power BI date formats
5.1 Daily and weekly forecasts
6.1 Copy formatting for scenarios
7.1 Row and column aggregation at measure level
7.2 Row and column aggregation for formula measures
7.3 New column aggregation types – first and last
In the 3.0. version, you’ll notice an additional InfoBridge tab in your Inforiver visuals.
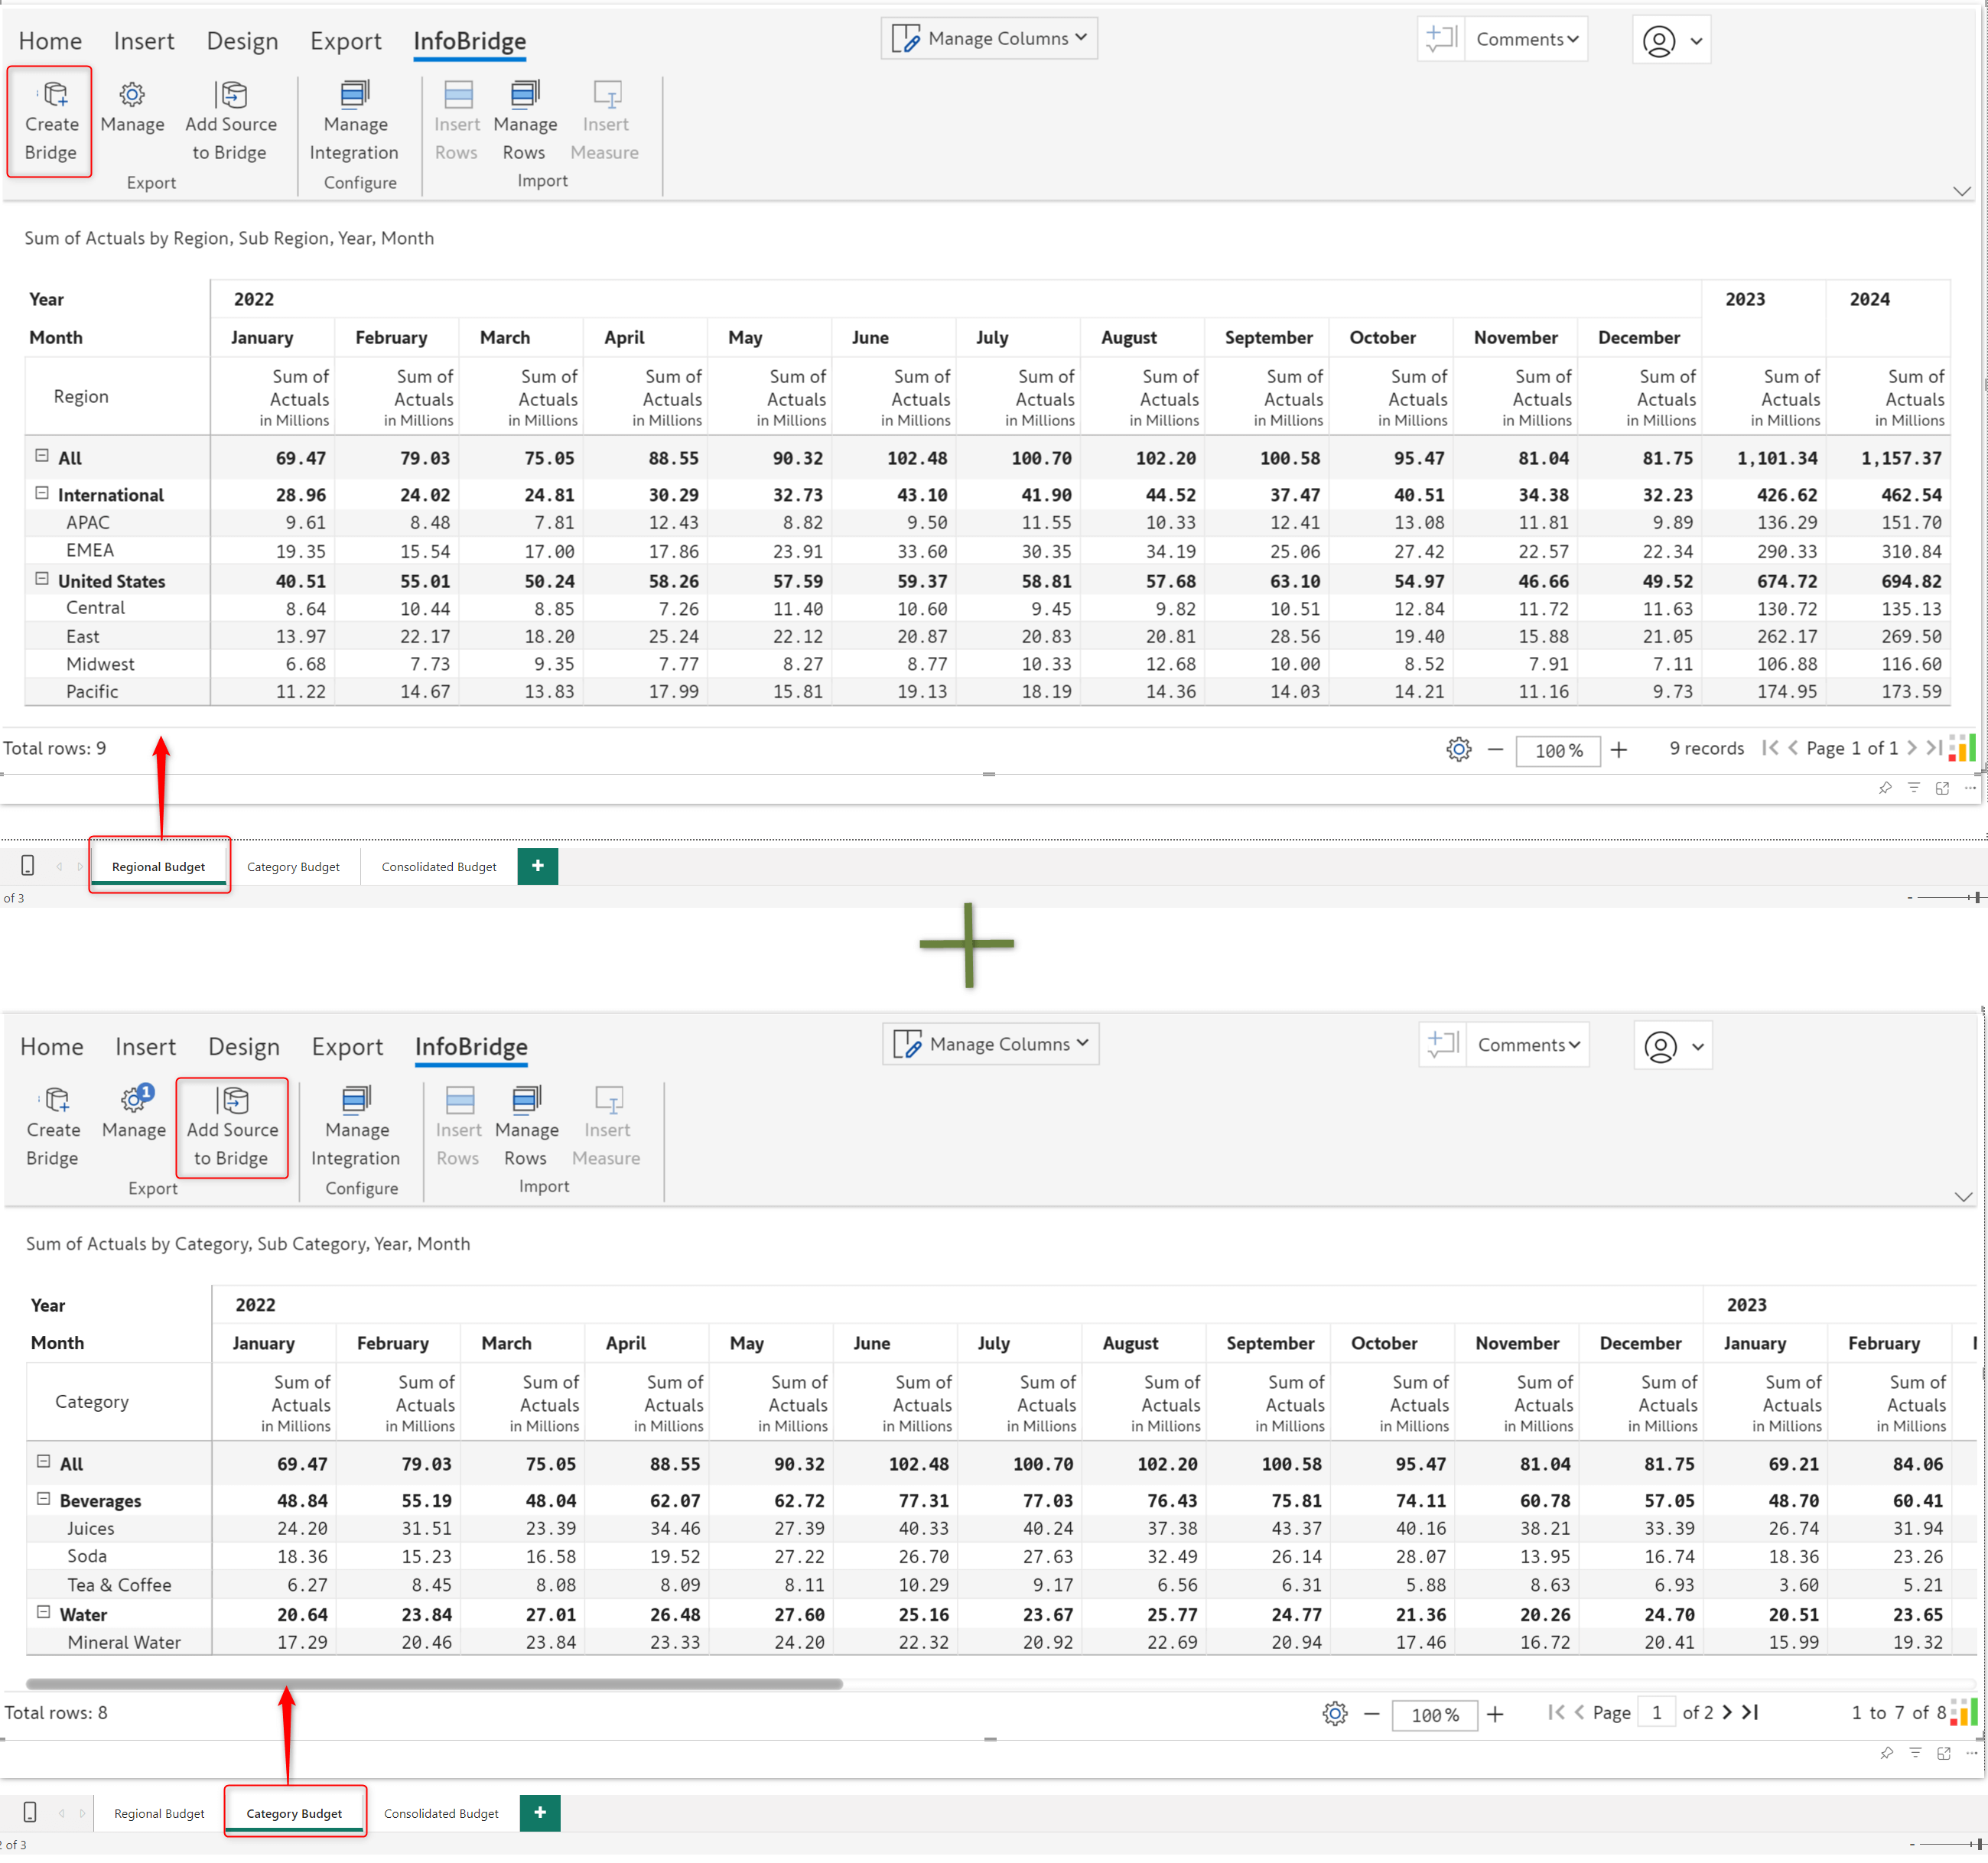
In the context of Inforiver, one of InfoBridge's capabilities is integrating data from separate visuals and writing it back to a single table. For demonstration purposes, let’s create a Consolidated Budget based on the Regional, Category, and Account-wise budgets.
We can create a bridge using the data from a particular visual and then add data from other visuals to the same bridge. The regional and category budgets from different visuals are combined into a single bridge.
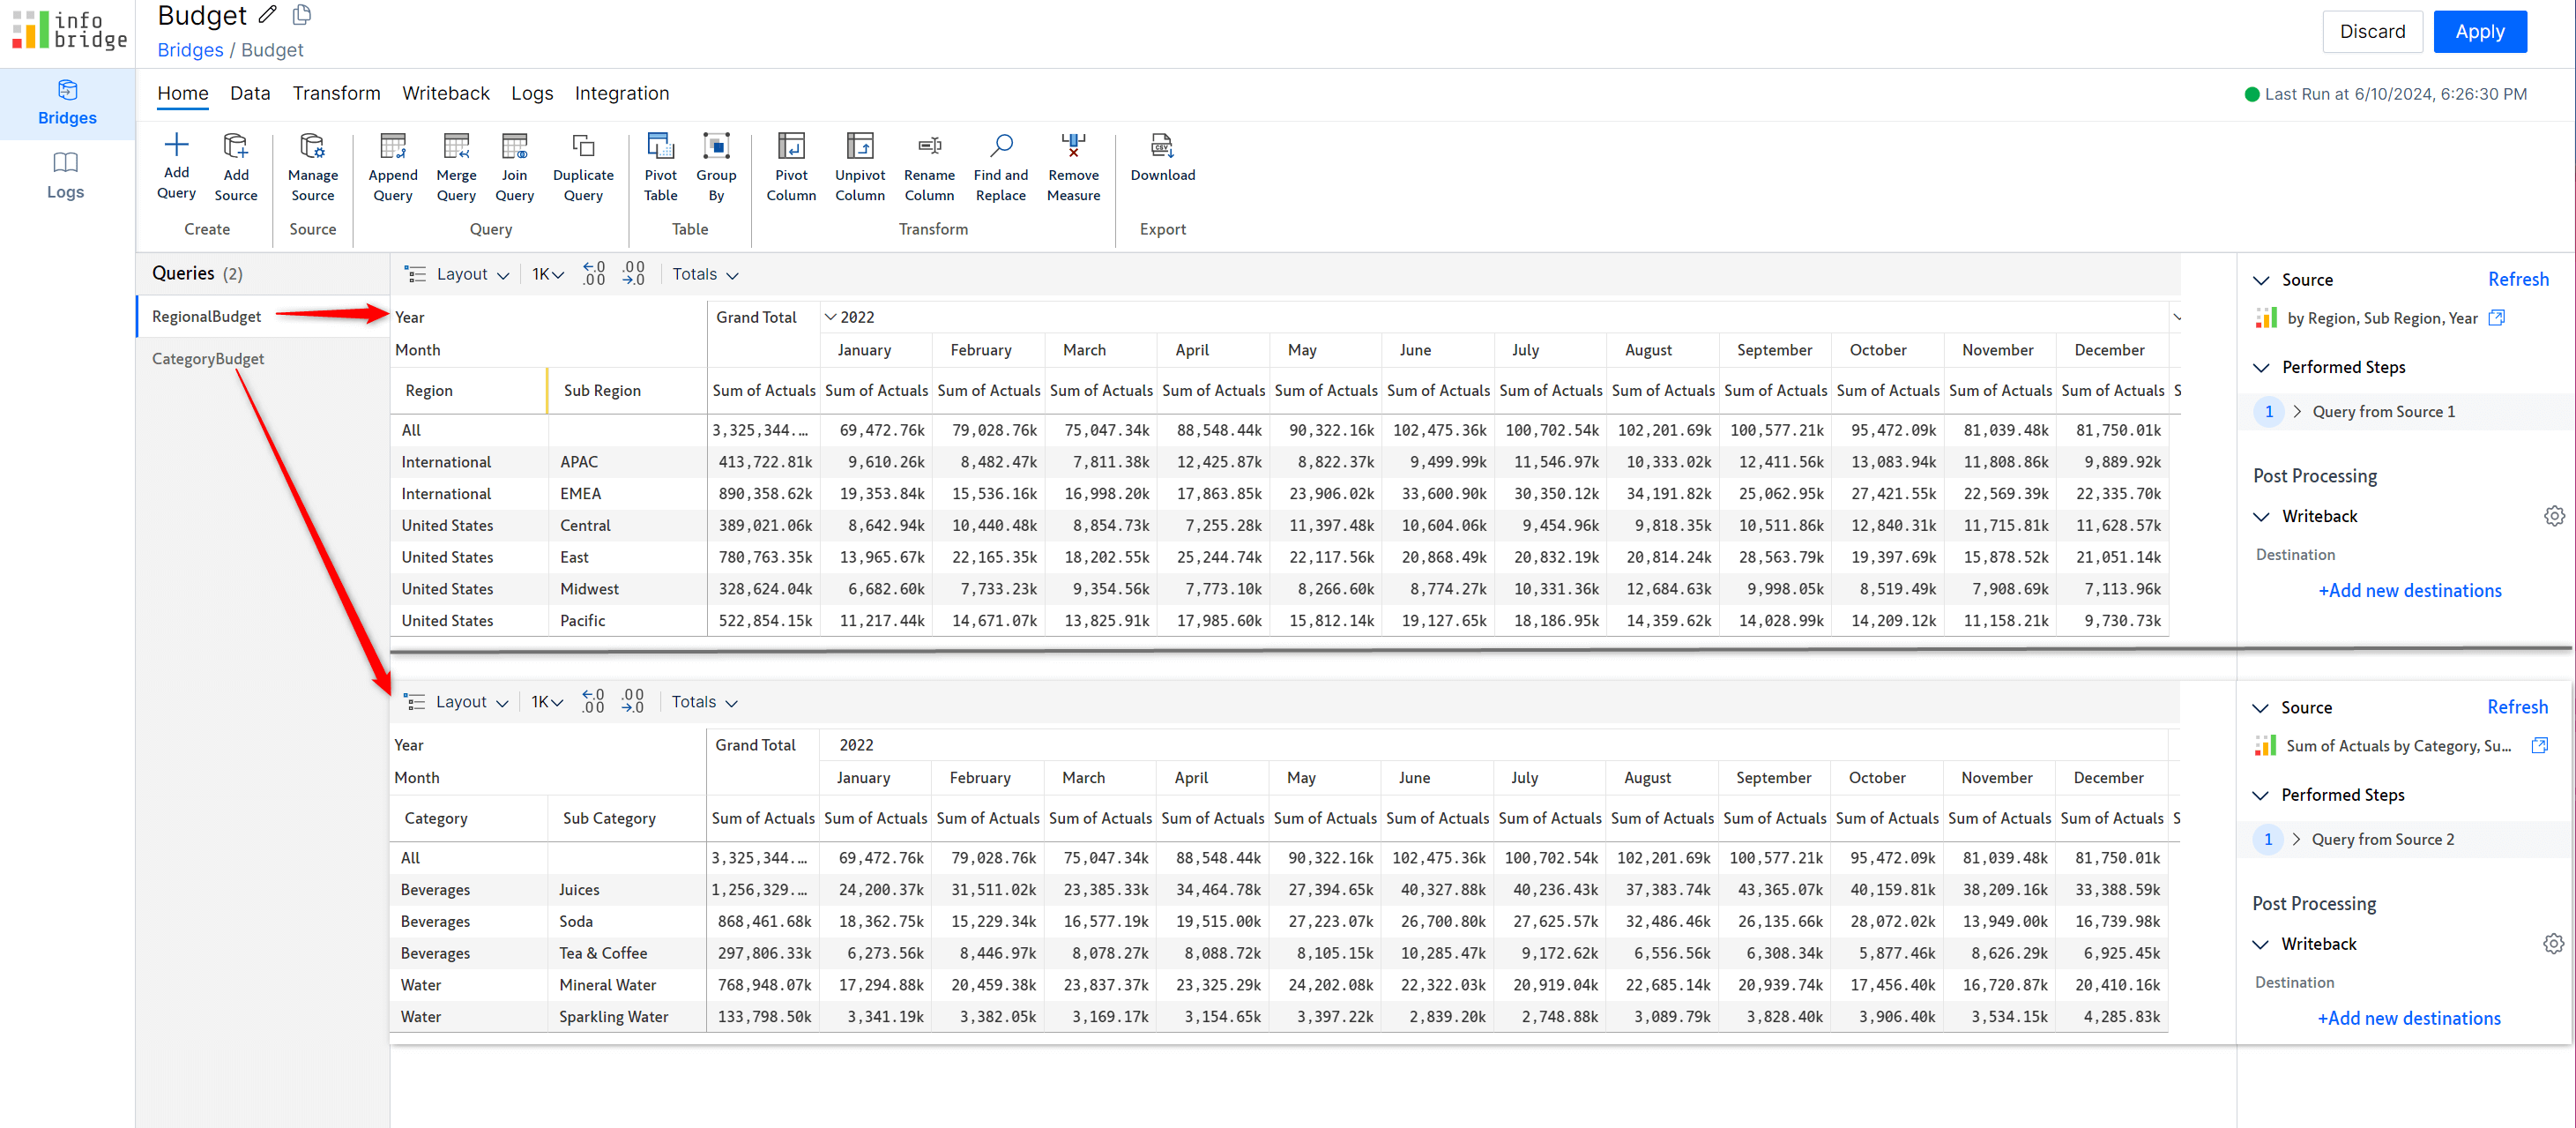
The Budget bridge is created with the visual data from the regional and category budget visuals. Within InfoBridge, you can pivot, merge, append, join, and transform your data. InfoBridge provides an all-encompassing range of data transformation and integration options.
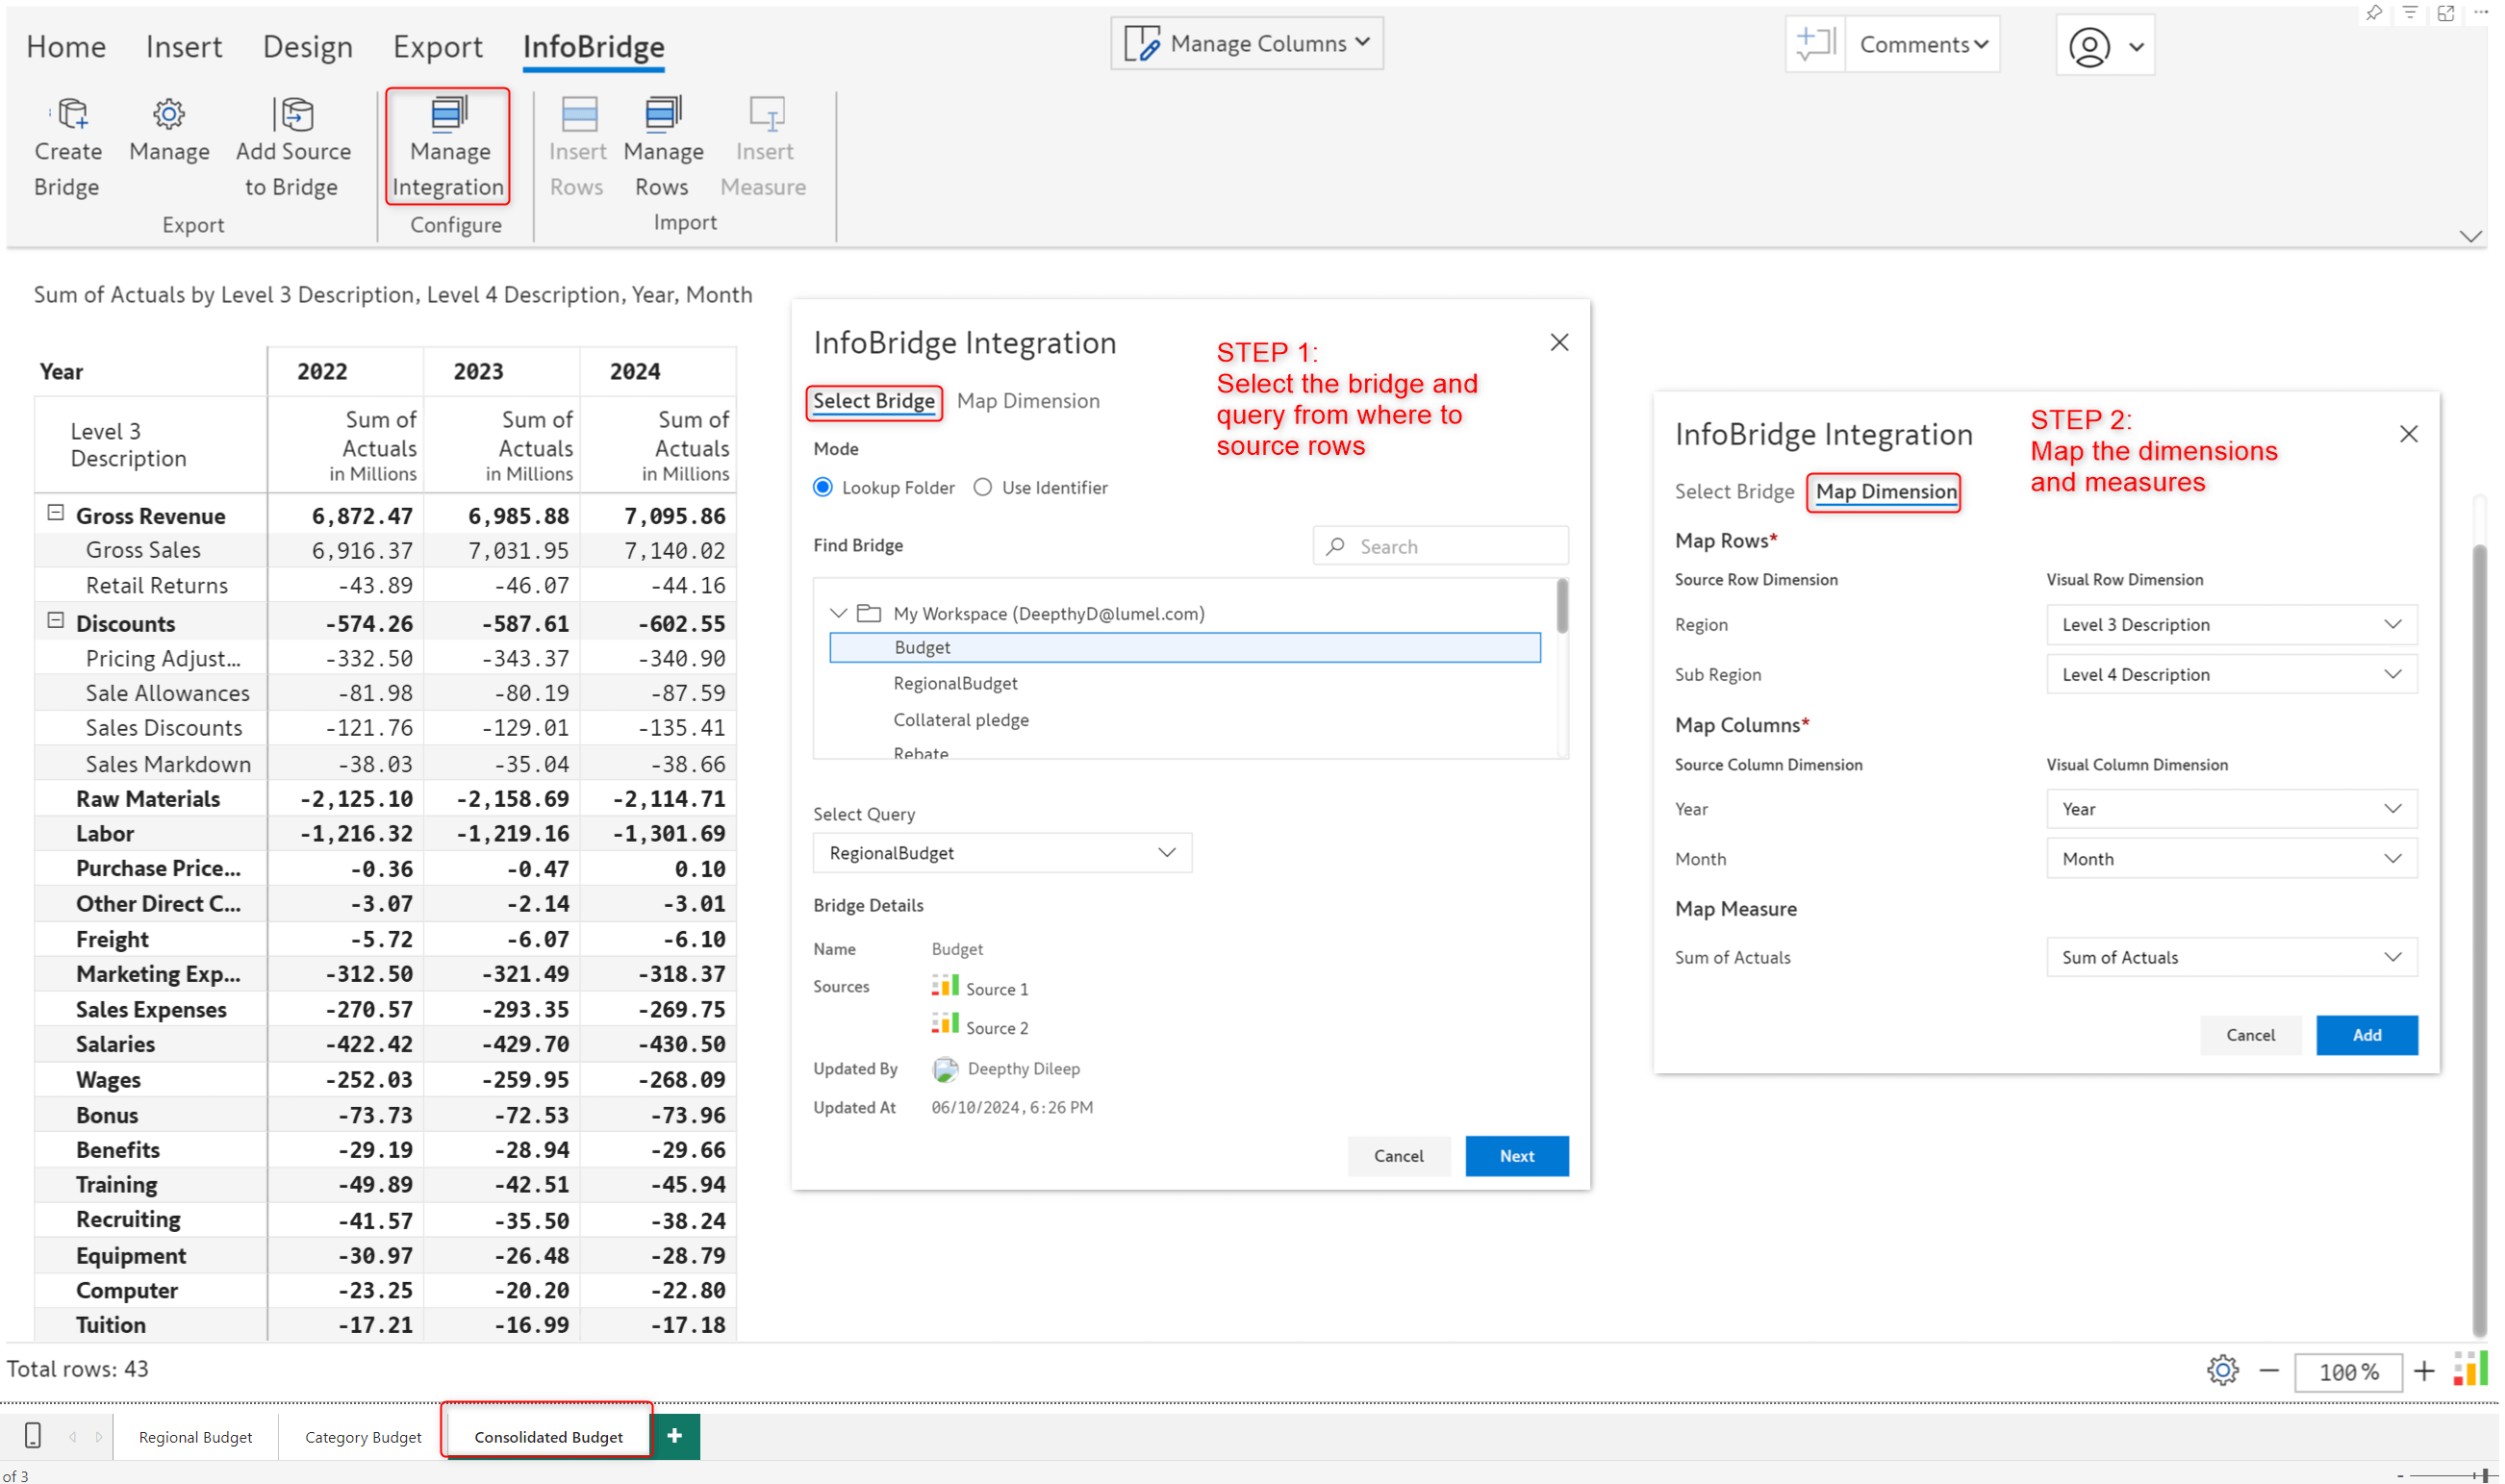
In the target visual (Consolidated Budget), we need to configure an integration to pull data from the bridge. We also need to map the dimensions and measures from the bridge to the data in the target visual. Please remember that you must configure integrations separately for every InfoBridge query. In this case, we’ll need to configure 2 integrations to pull data from the Region and Category budgets.
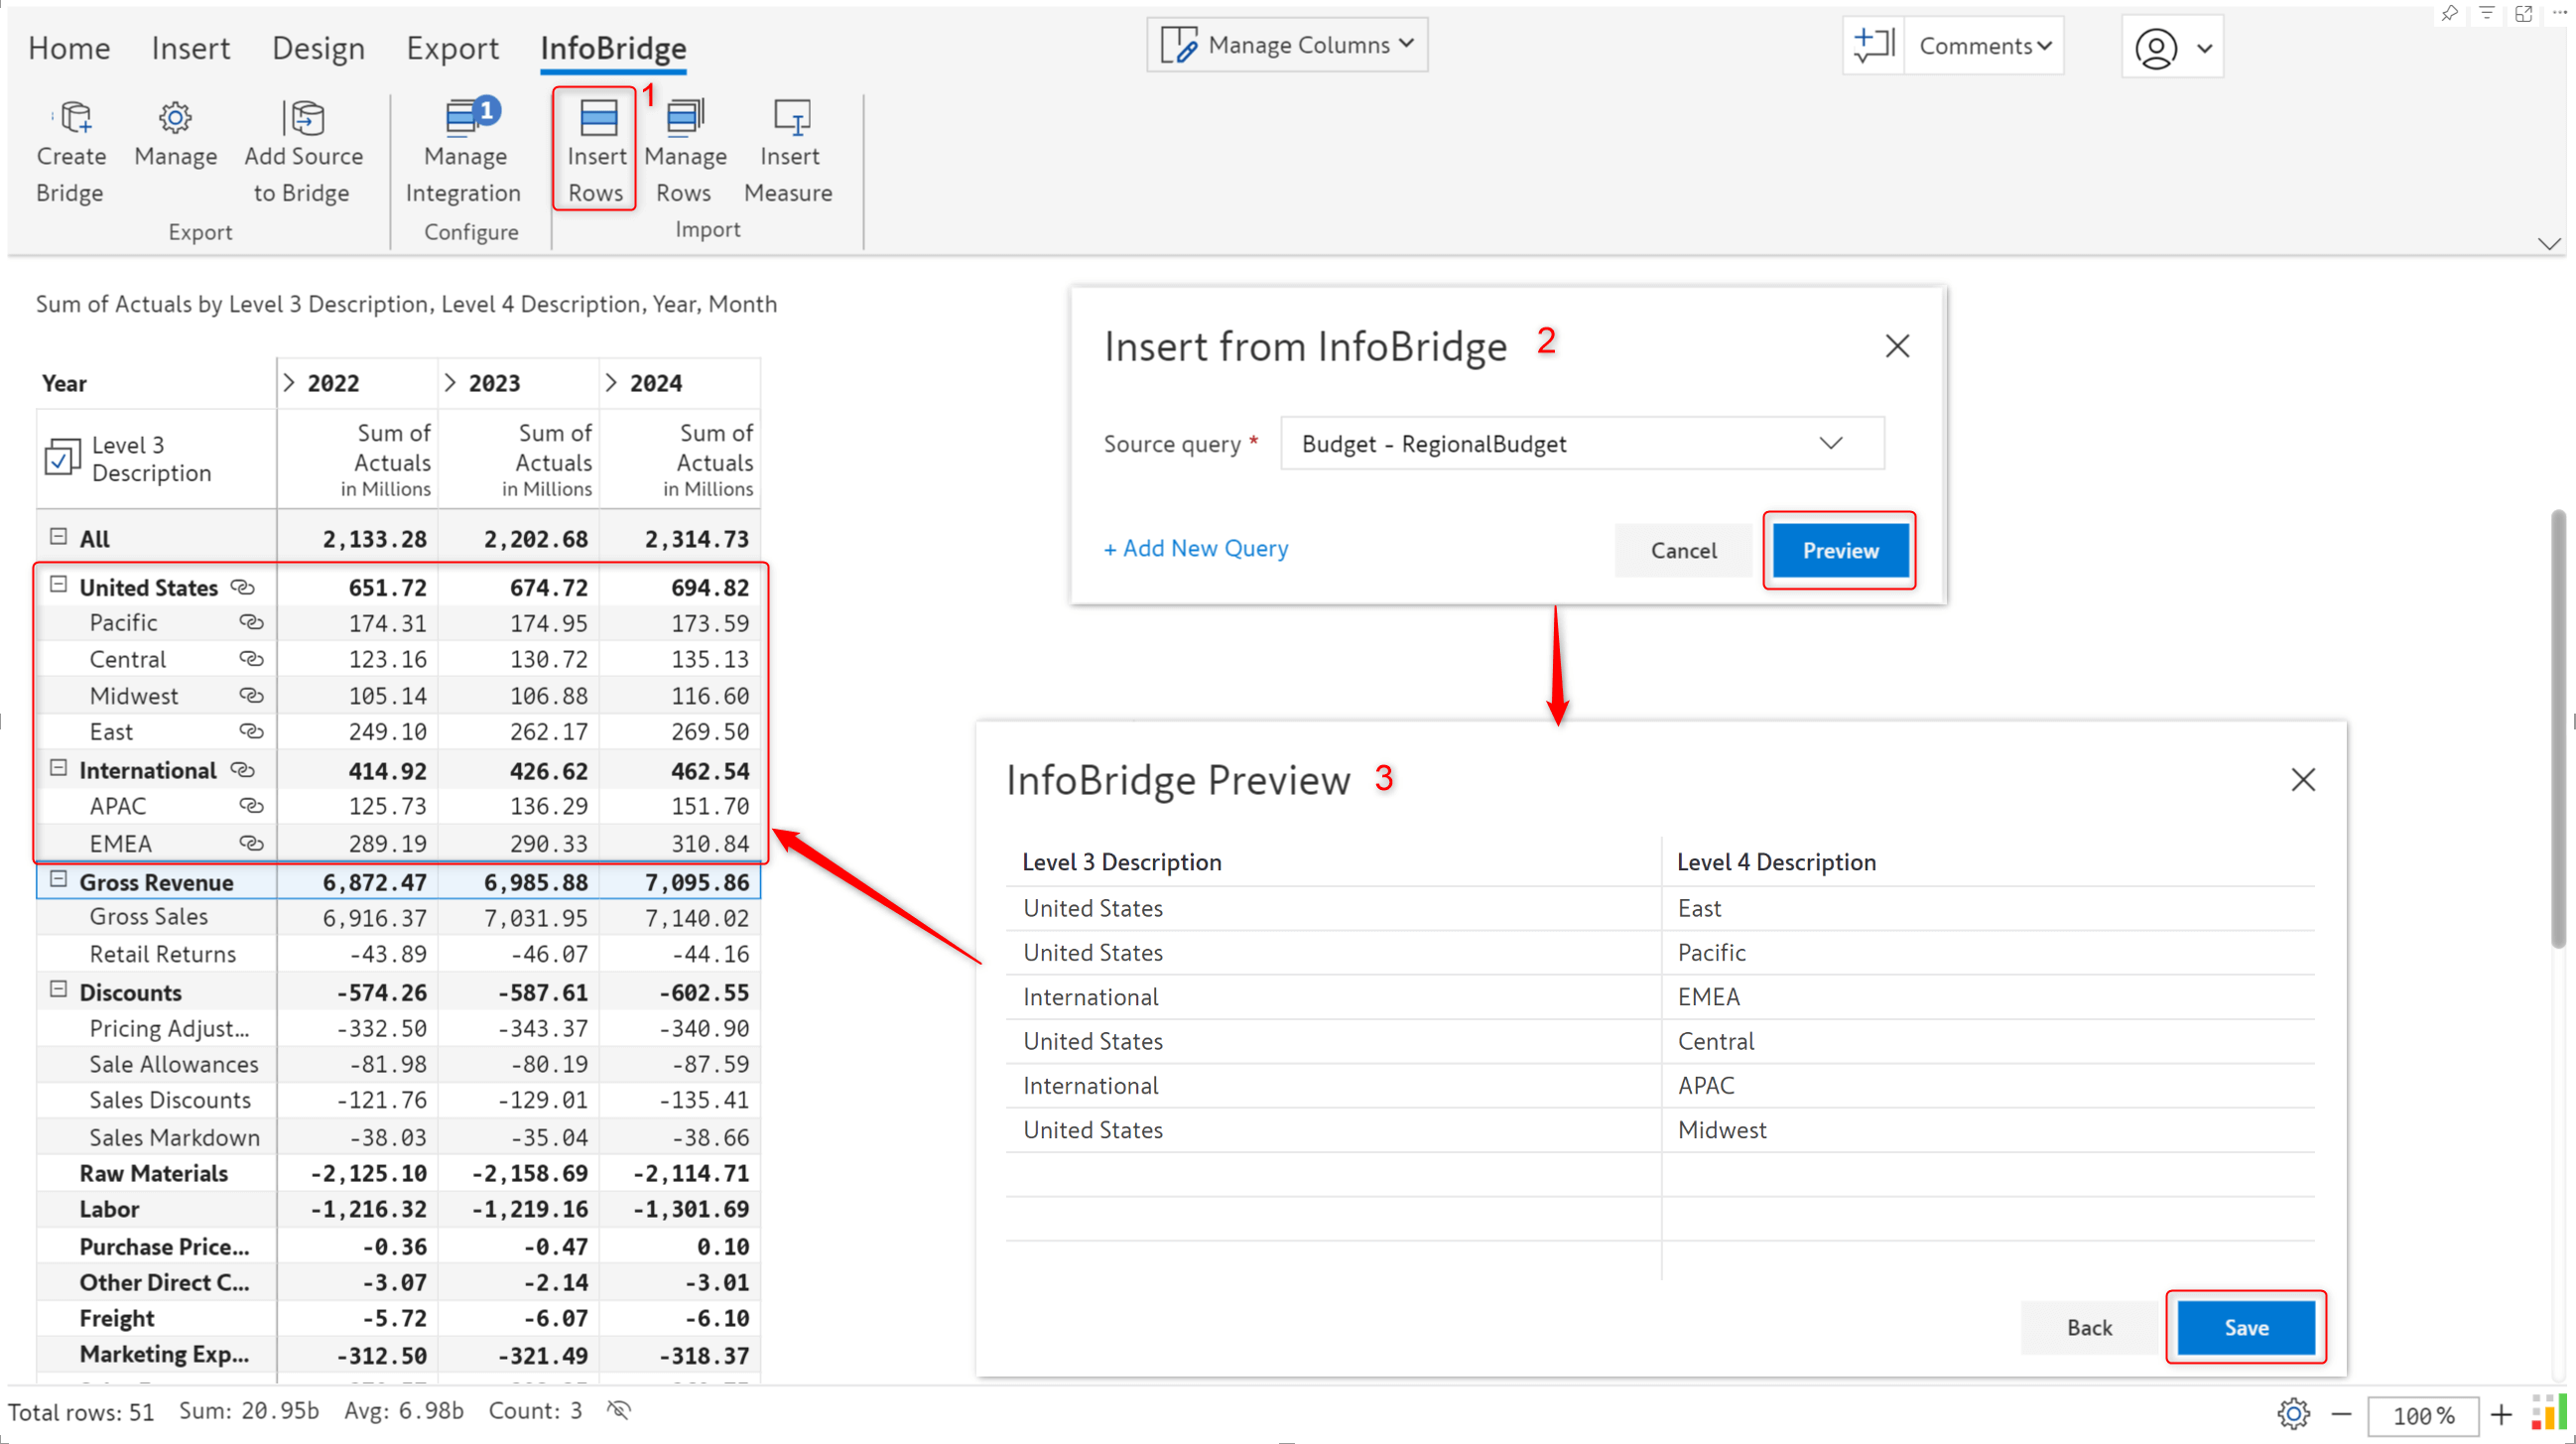
Once configured, use the Insert Rows button; you will have the data from the region and category budgets. Rows inserted from bridges can be identified by the “link” icon.
Once you create a bridge from the source visual and pull the data into the target visual, any updates made to data input fields in the source will automatically reflect in the target.
In the target visual (Consolidated Budget Enhc) report, the Discount data input field from the source visual (Regional Budget) has a value of 1.12m, as highlighted.
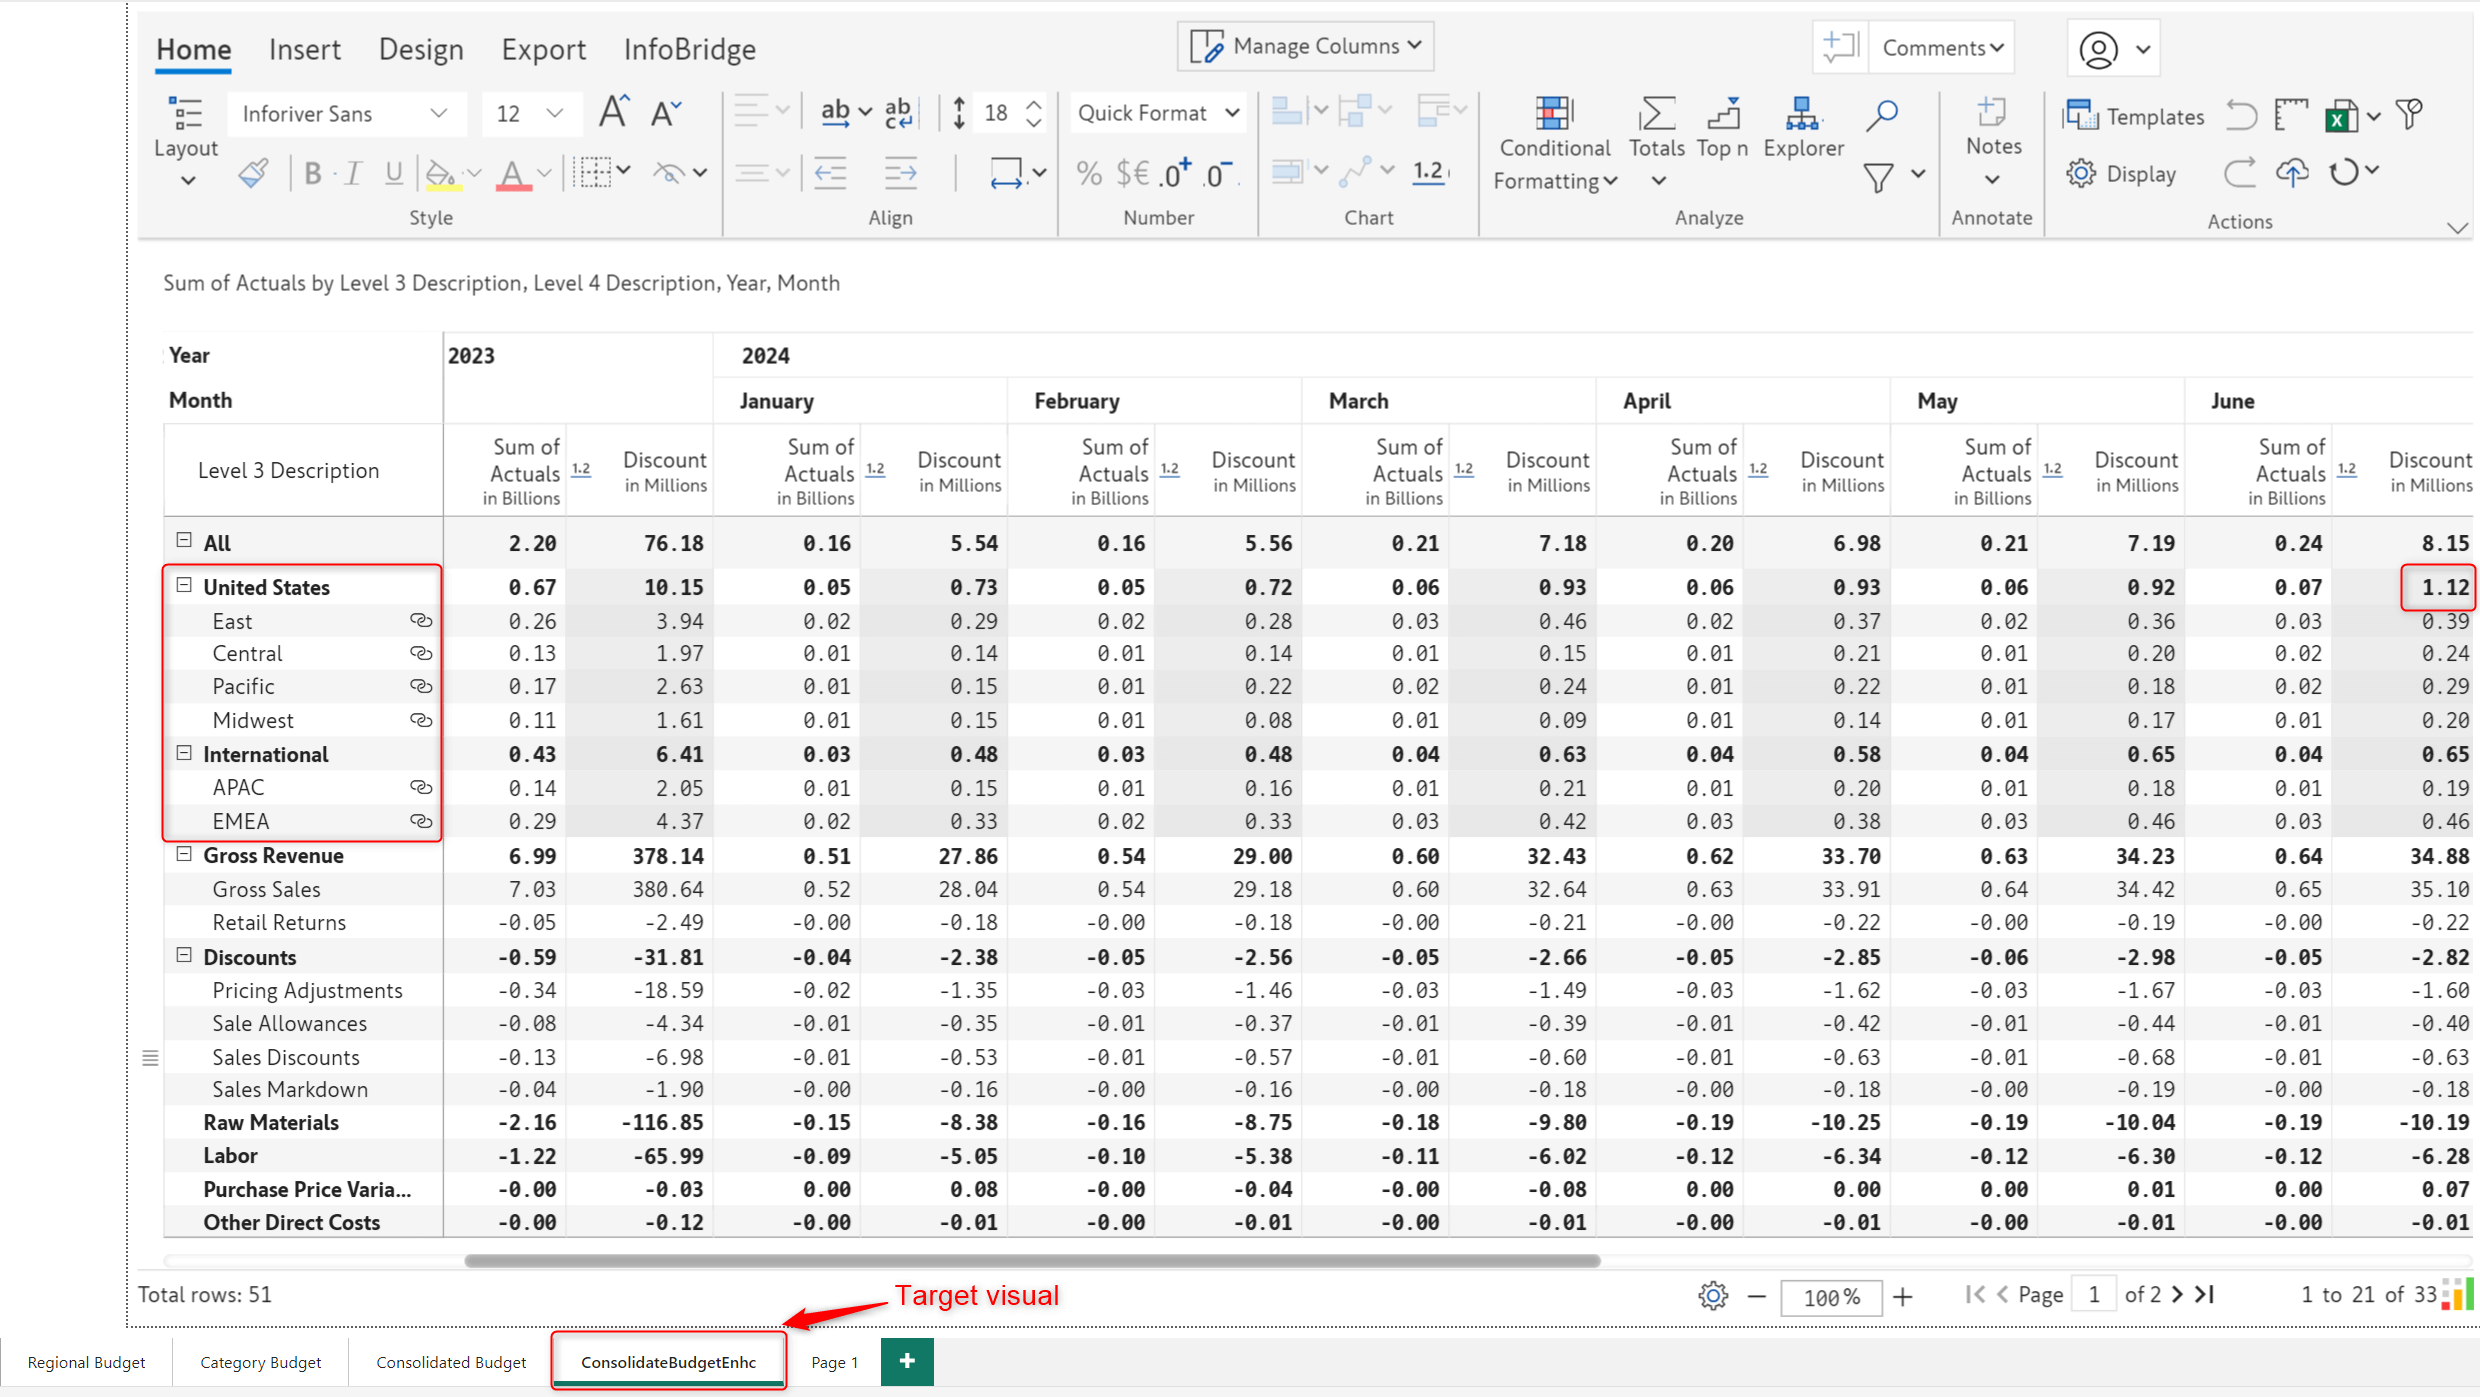
When you update data input values in the source visual, the bridge created for that visual is automatically refreshed with the latest values. For example, the June discount is updated from 1.12m to 2.24m in the source visual, which is reflected in real time in the target visual.
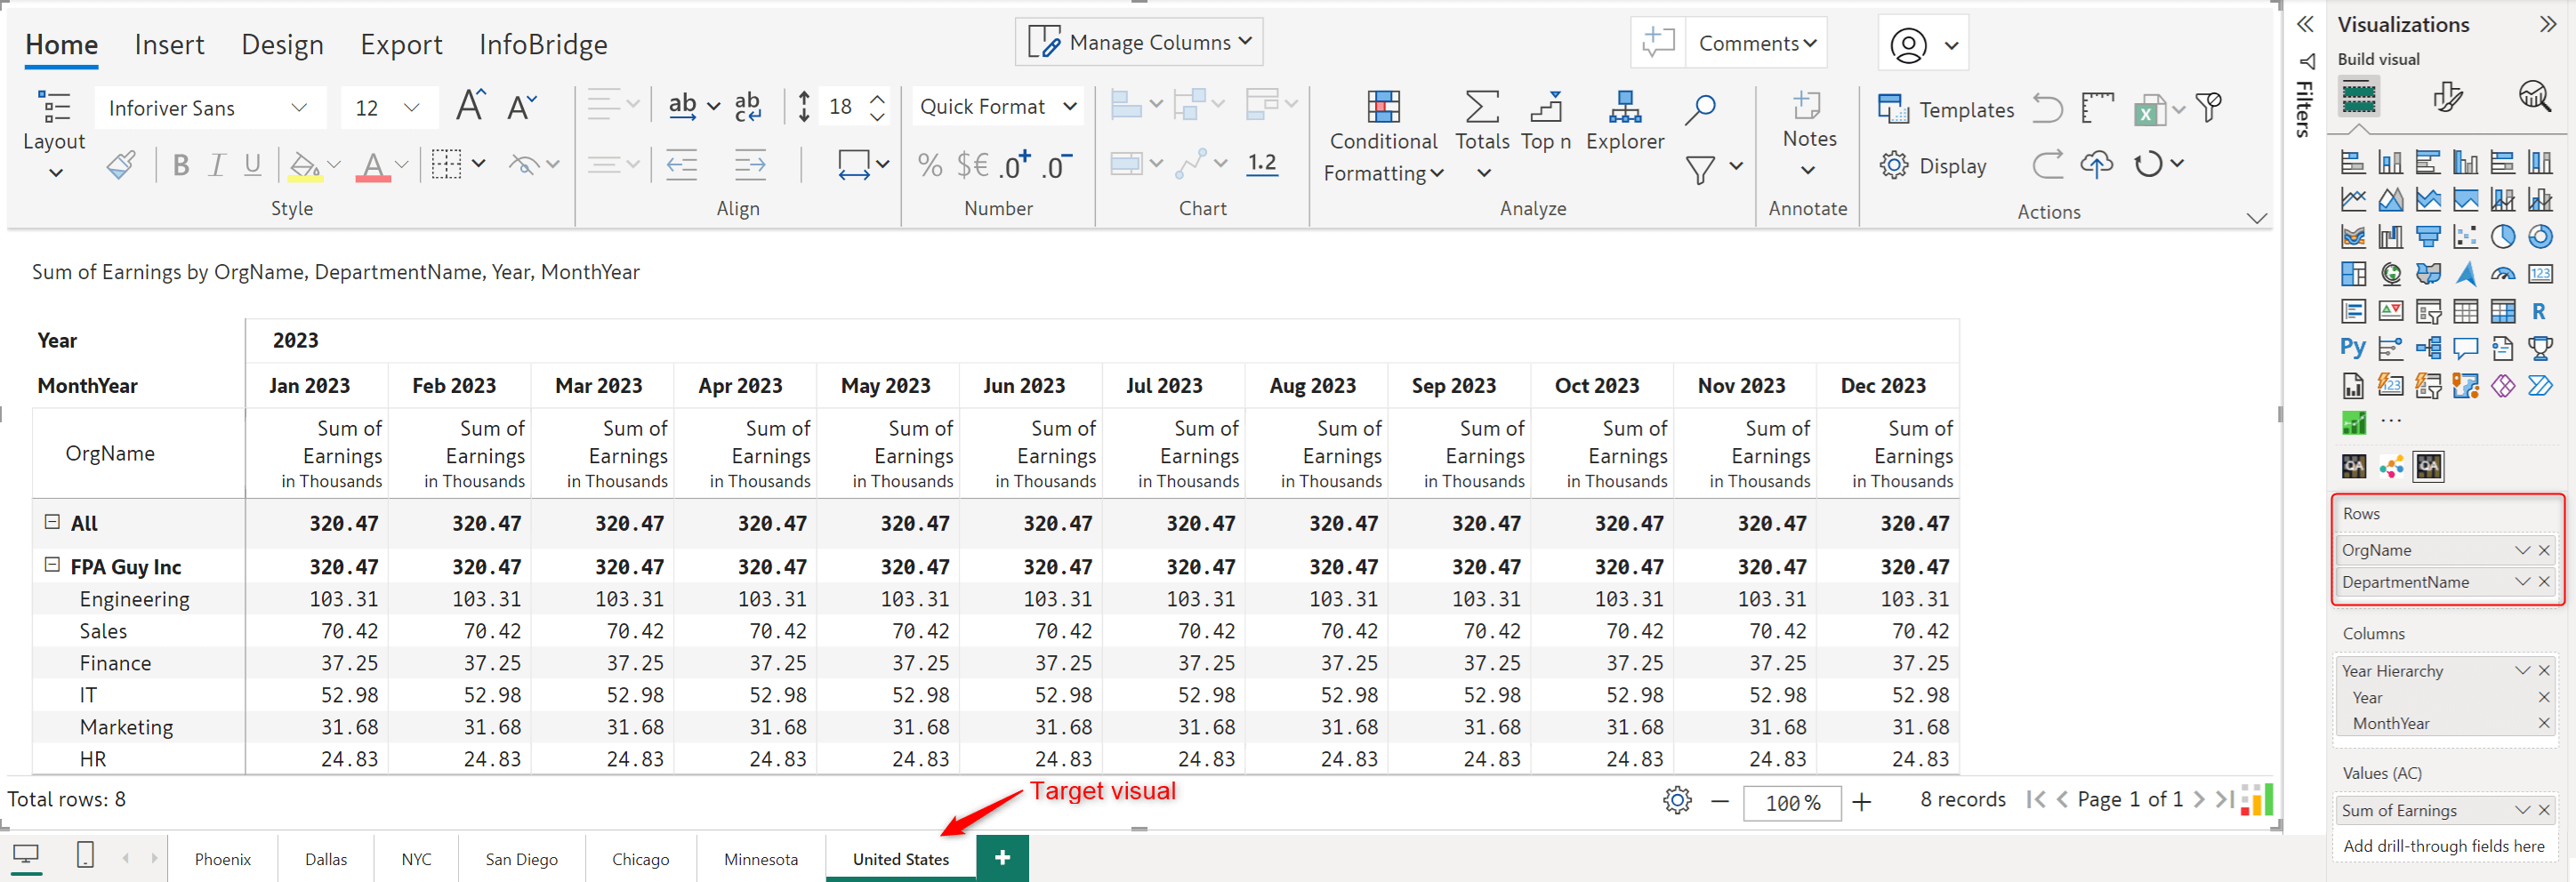
With InfoBridge, you can source data input measures from a visual—even when the row granularity in the source and target visuals is different.
The source visual rows are at the Salary category level.
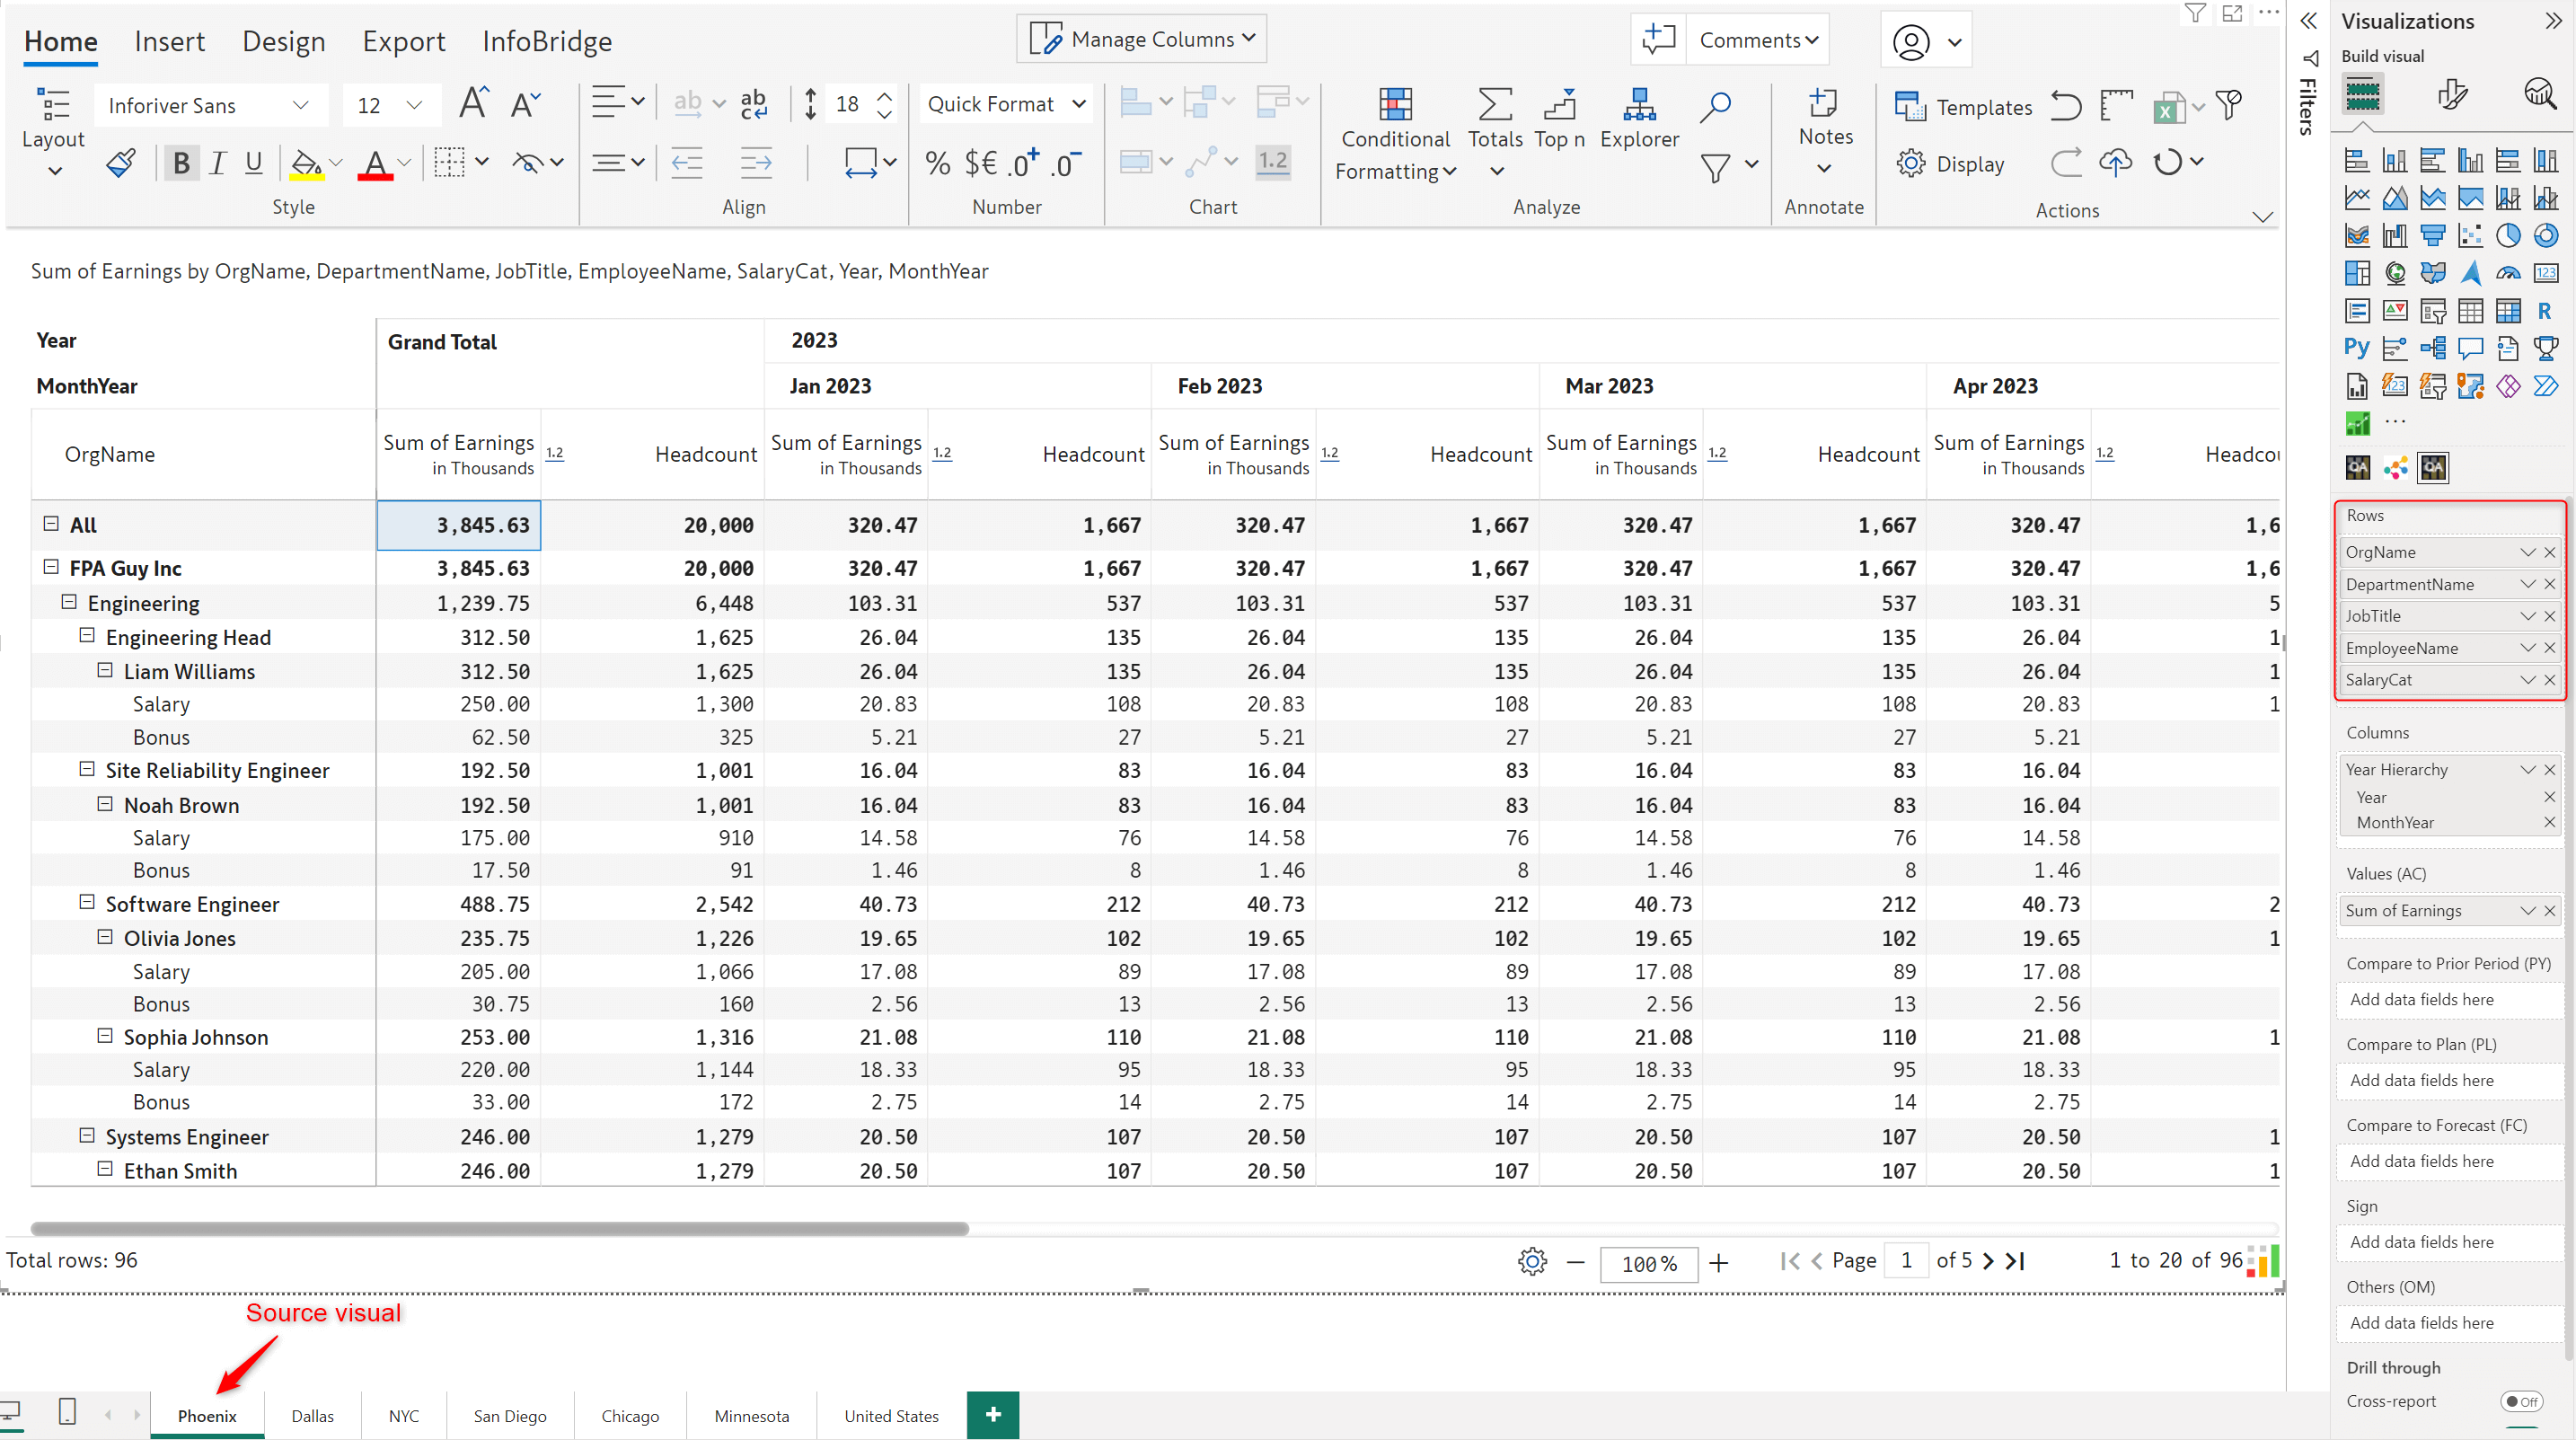
The target visual has data rolled up to the Department level.
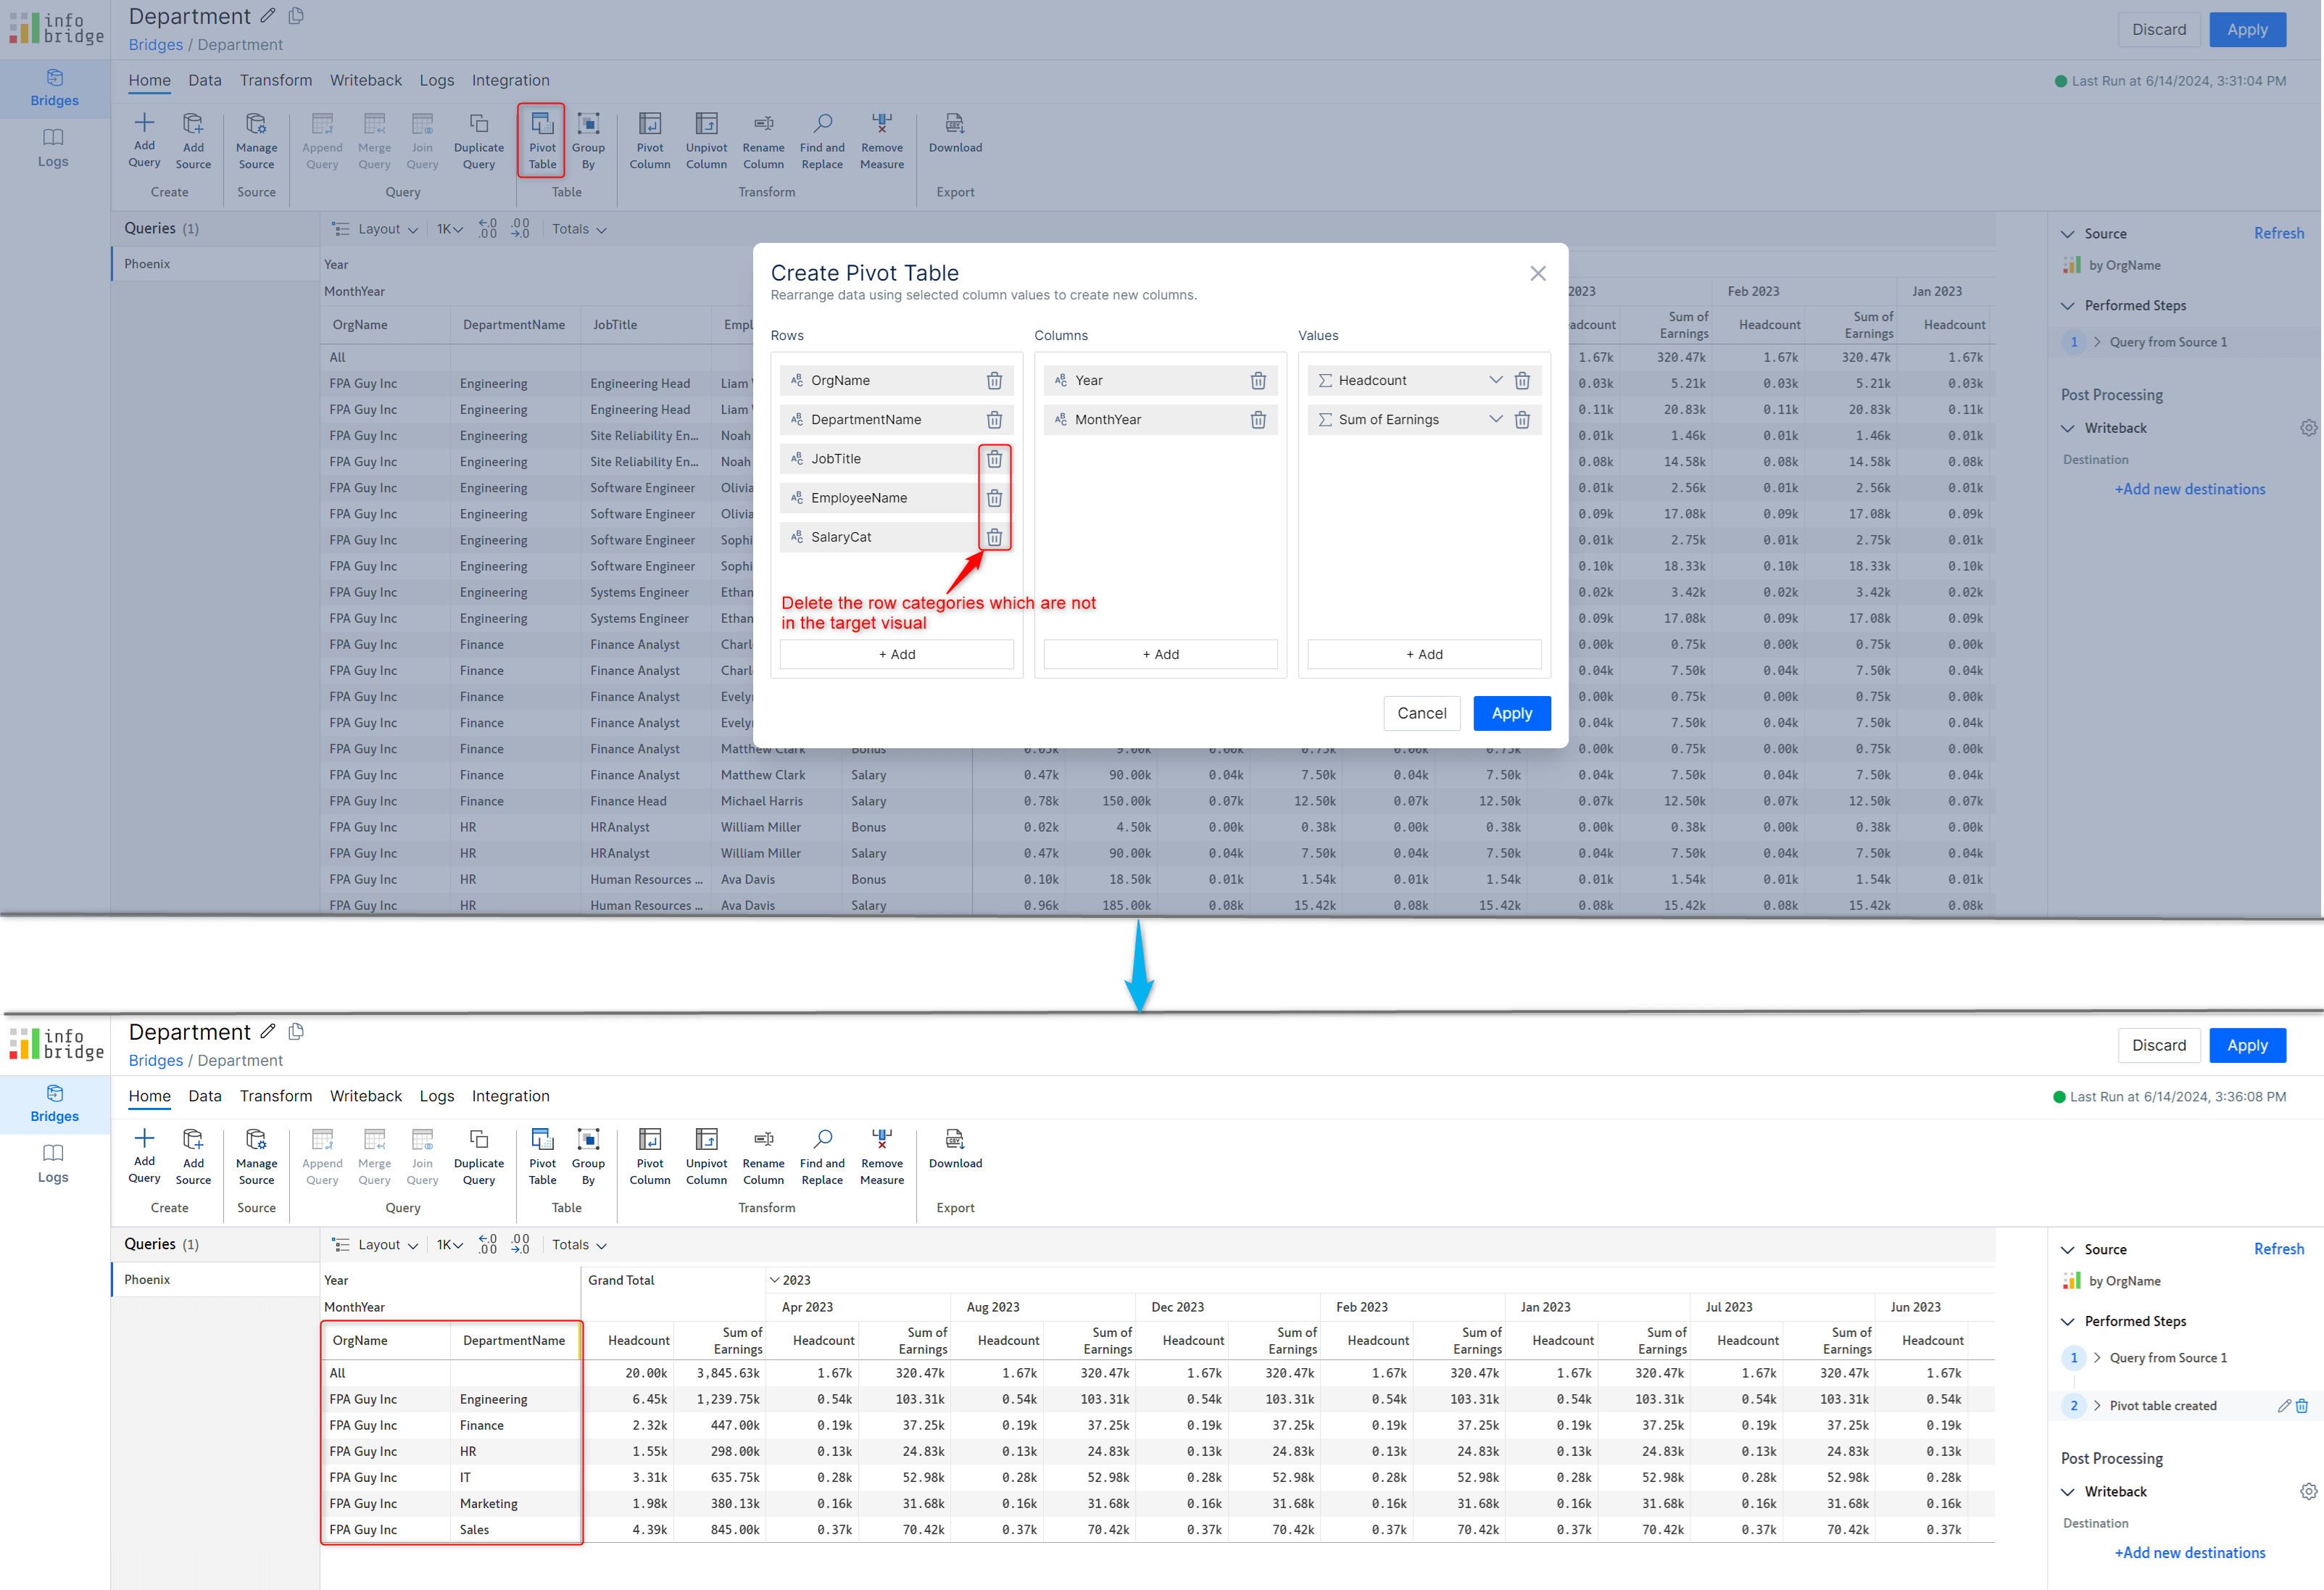
Once you create a bridge for the source visual, you can use the pivot table feature to transform your rows, columns, and measures.
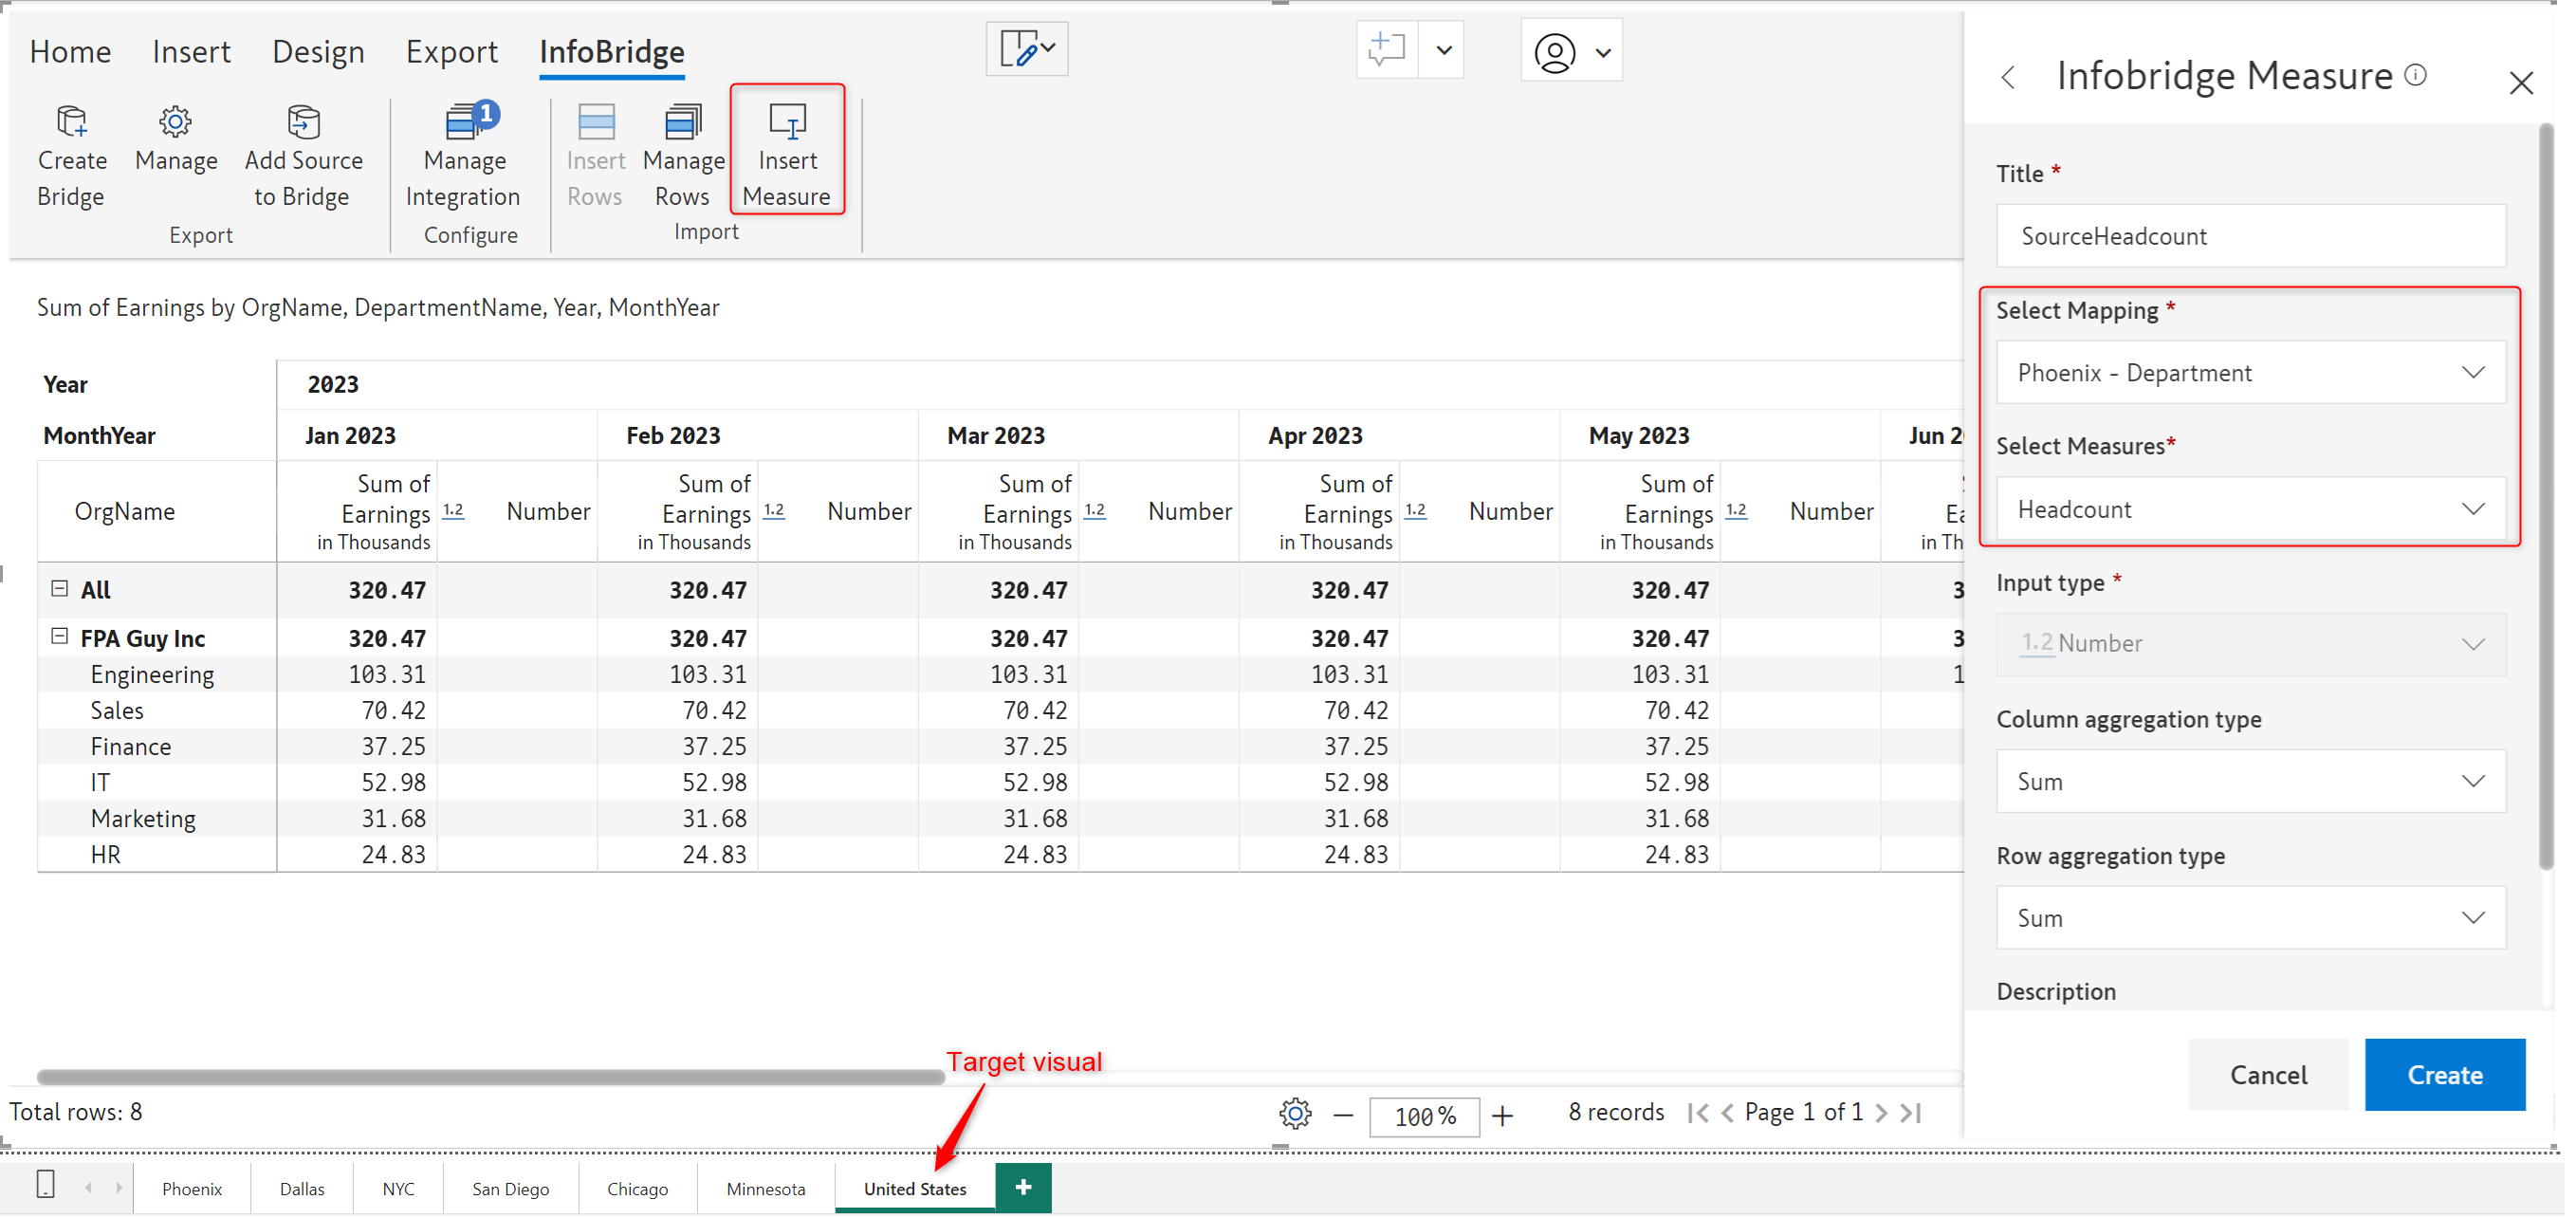
After creating an integration to the source visual bridge, you can insert any data input columns from the source visual to the target visual – in this case, the rolled-up Headcount from the Phoenix visual into the United States visual.
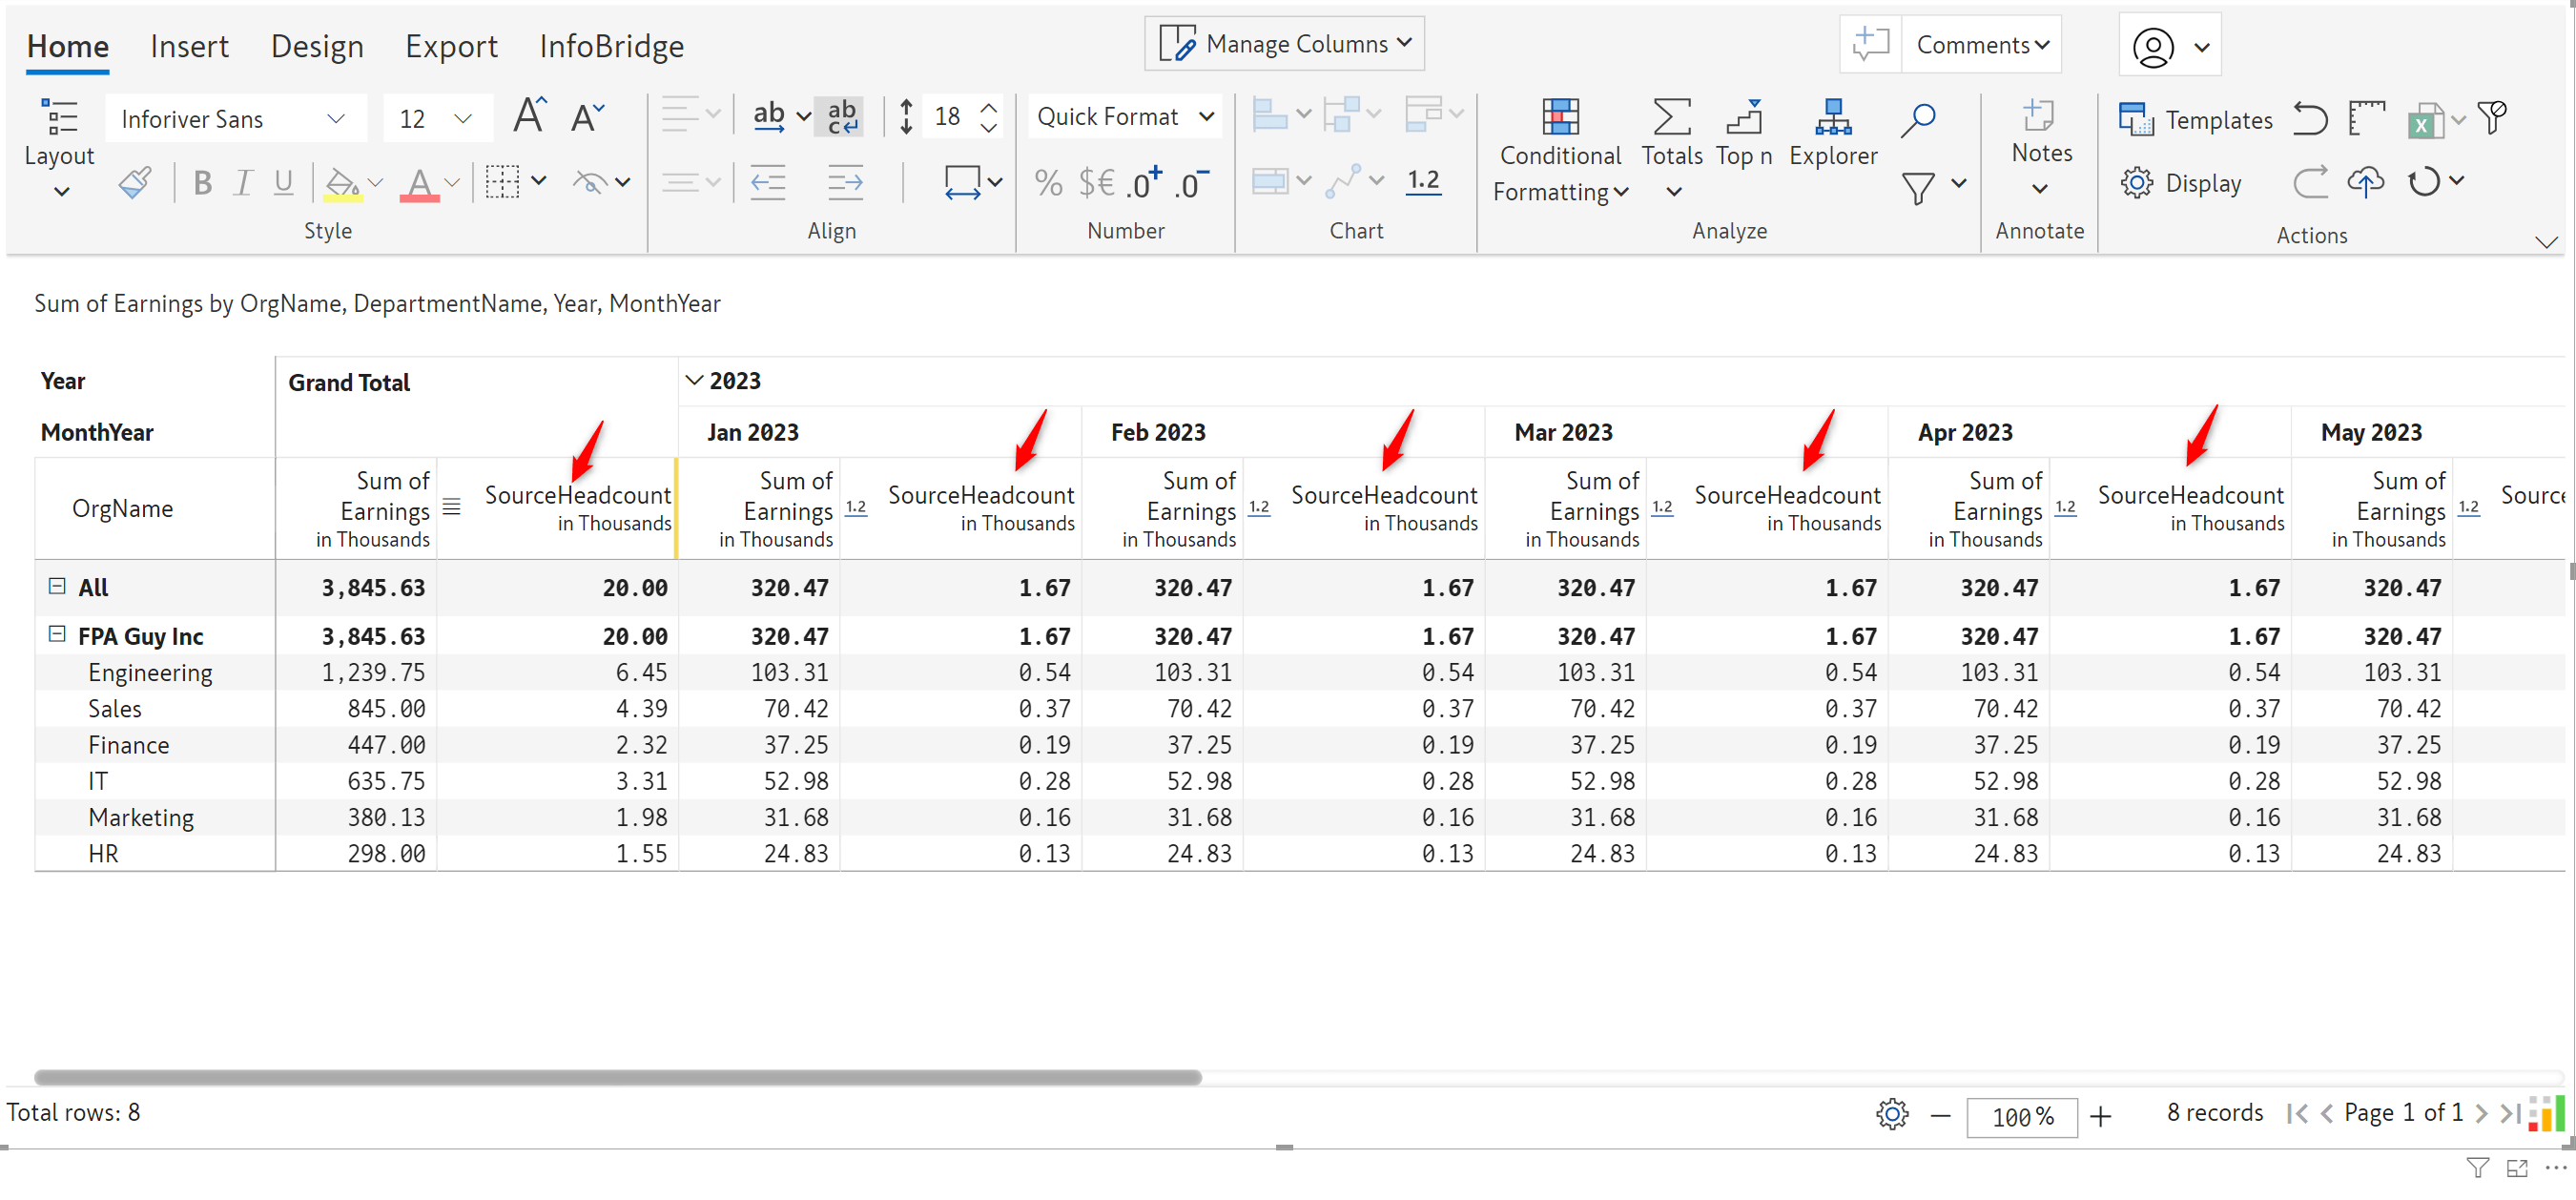
The headcount is rolled up and inserted into the target visual as a read-only measure. Any changes need to be done from the source visual only, ensuring a unidirectional data flow.
InfoBridge provides powerful data integration. It allows you to consolidate data from heterogeneous sources such as Inforiver, CSV, Excel, JSON, Sharepoint, etc.
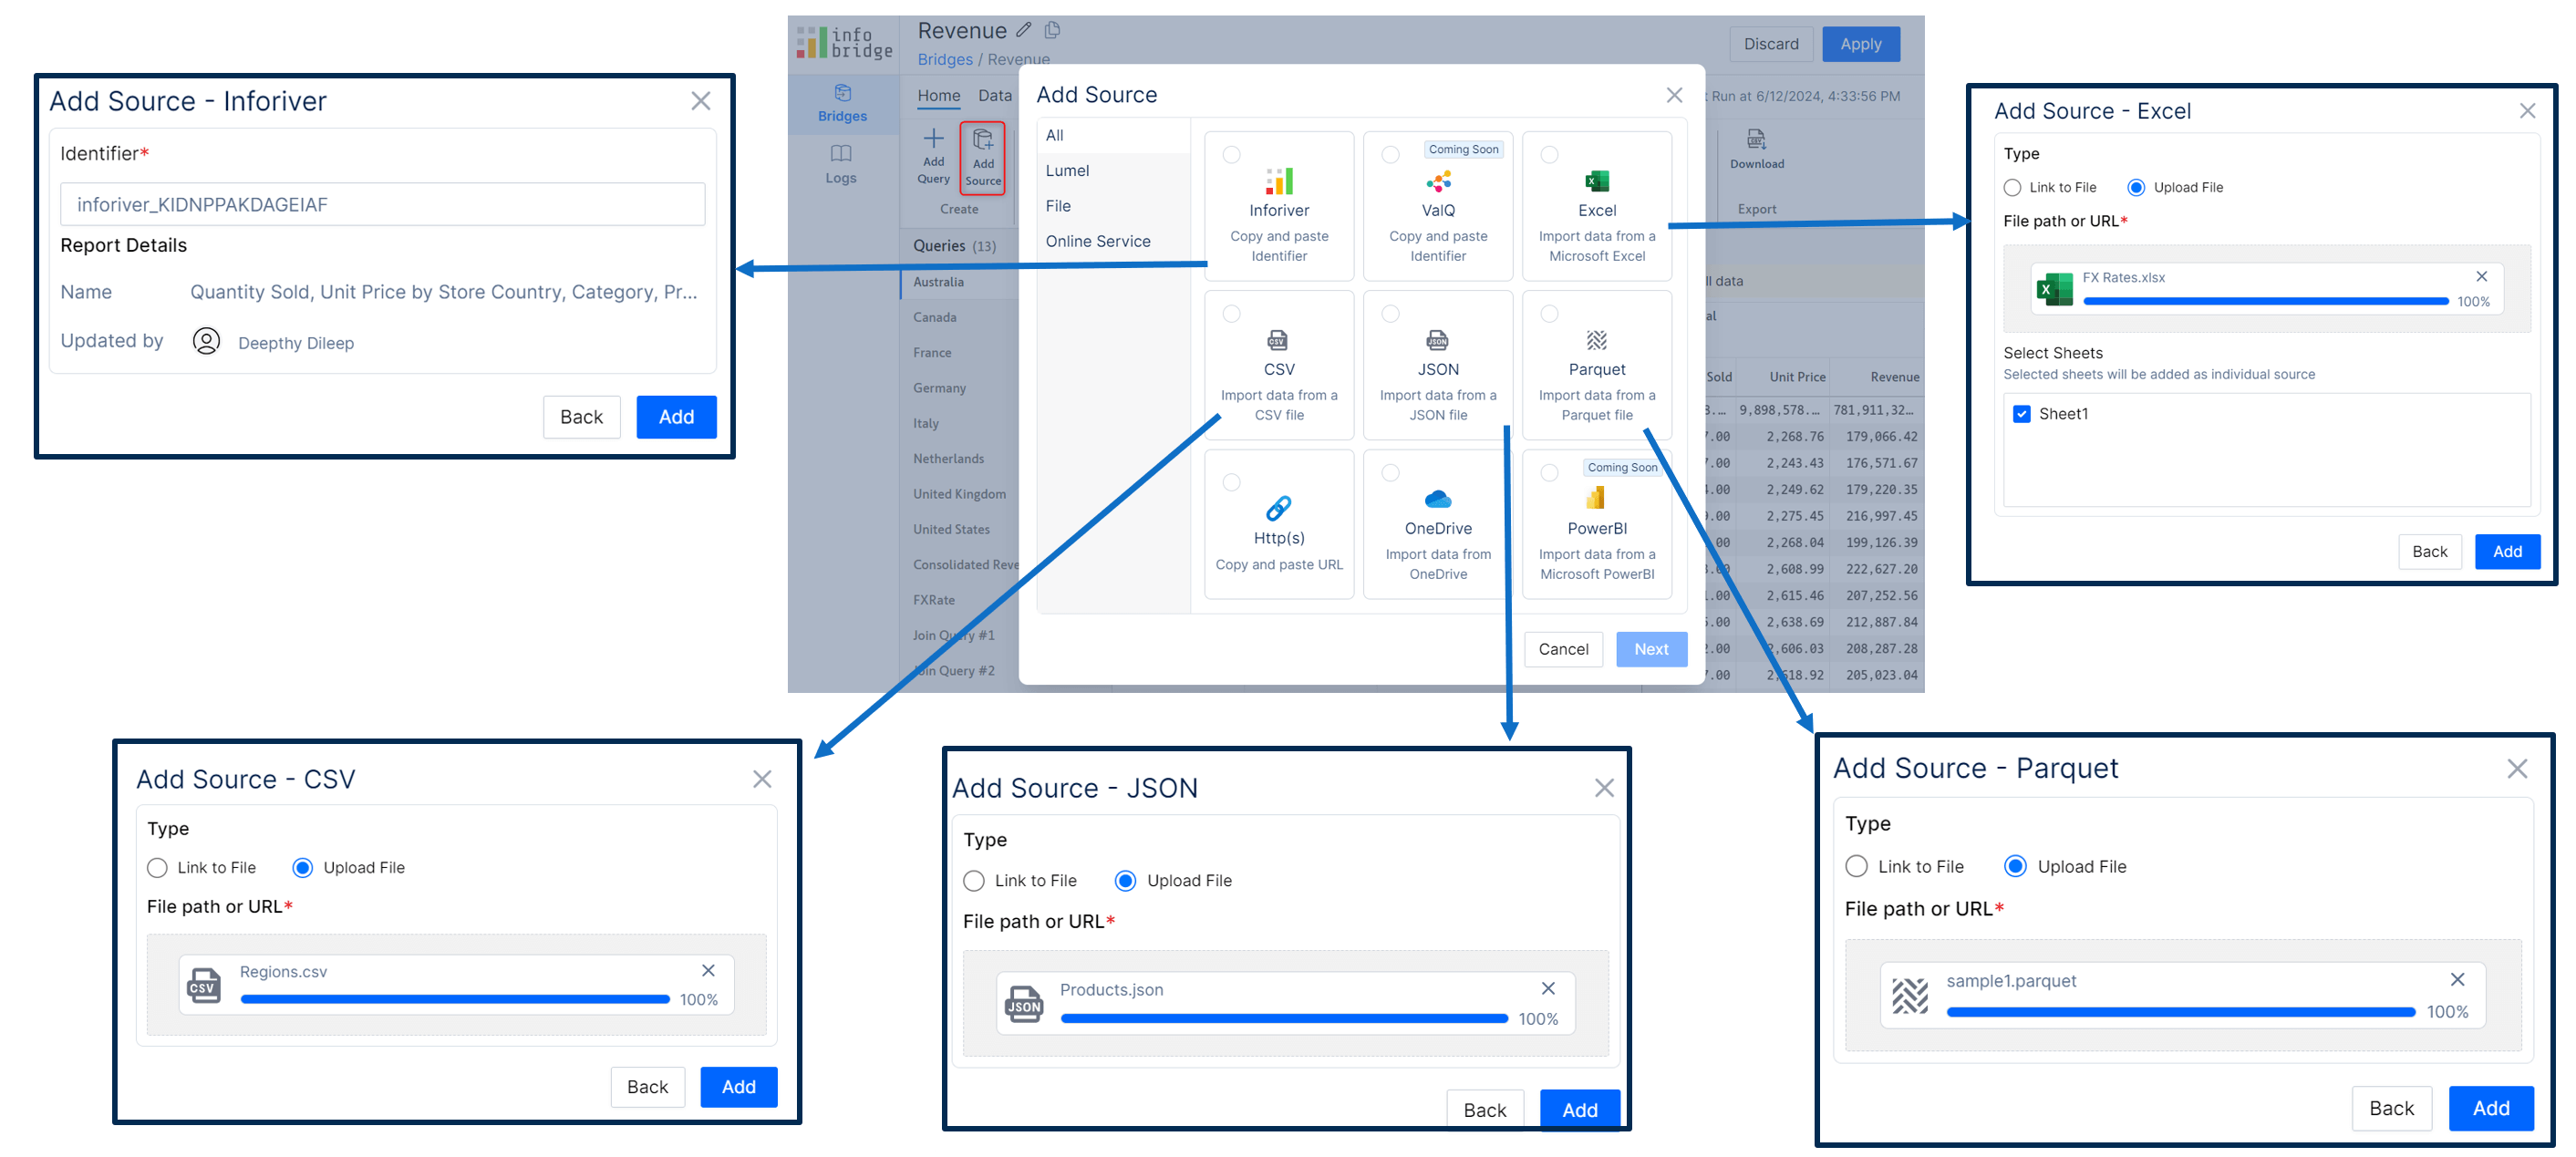
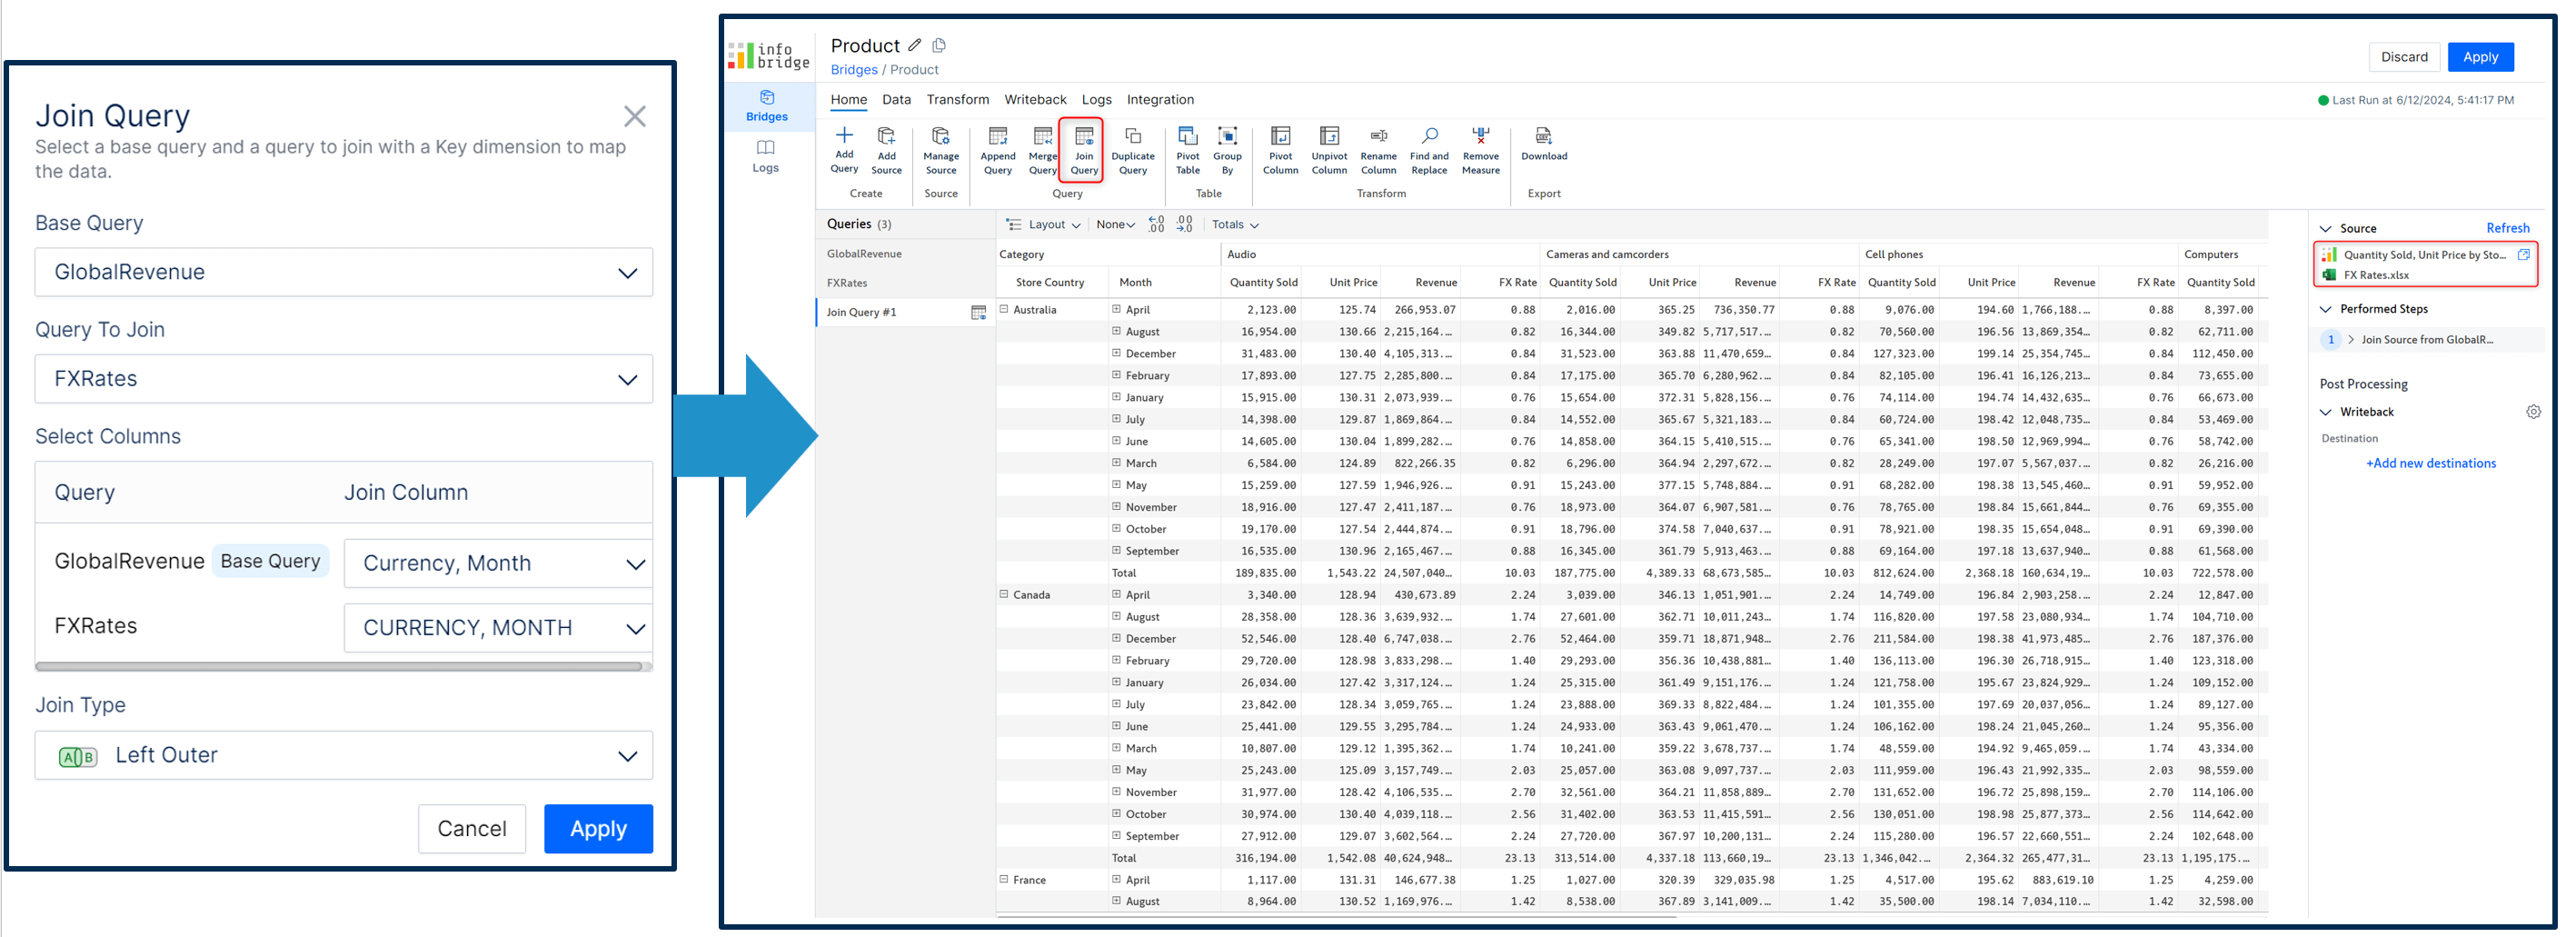
You can also join heterogeneous sources based on a common field. For instance, you can look up the FX Rate from the FX dimension based on the currency.
InfoBridge enables you to append and merge the data from different source systems.
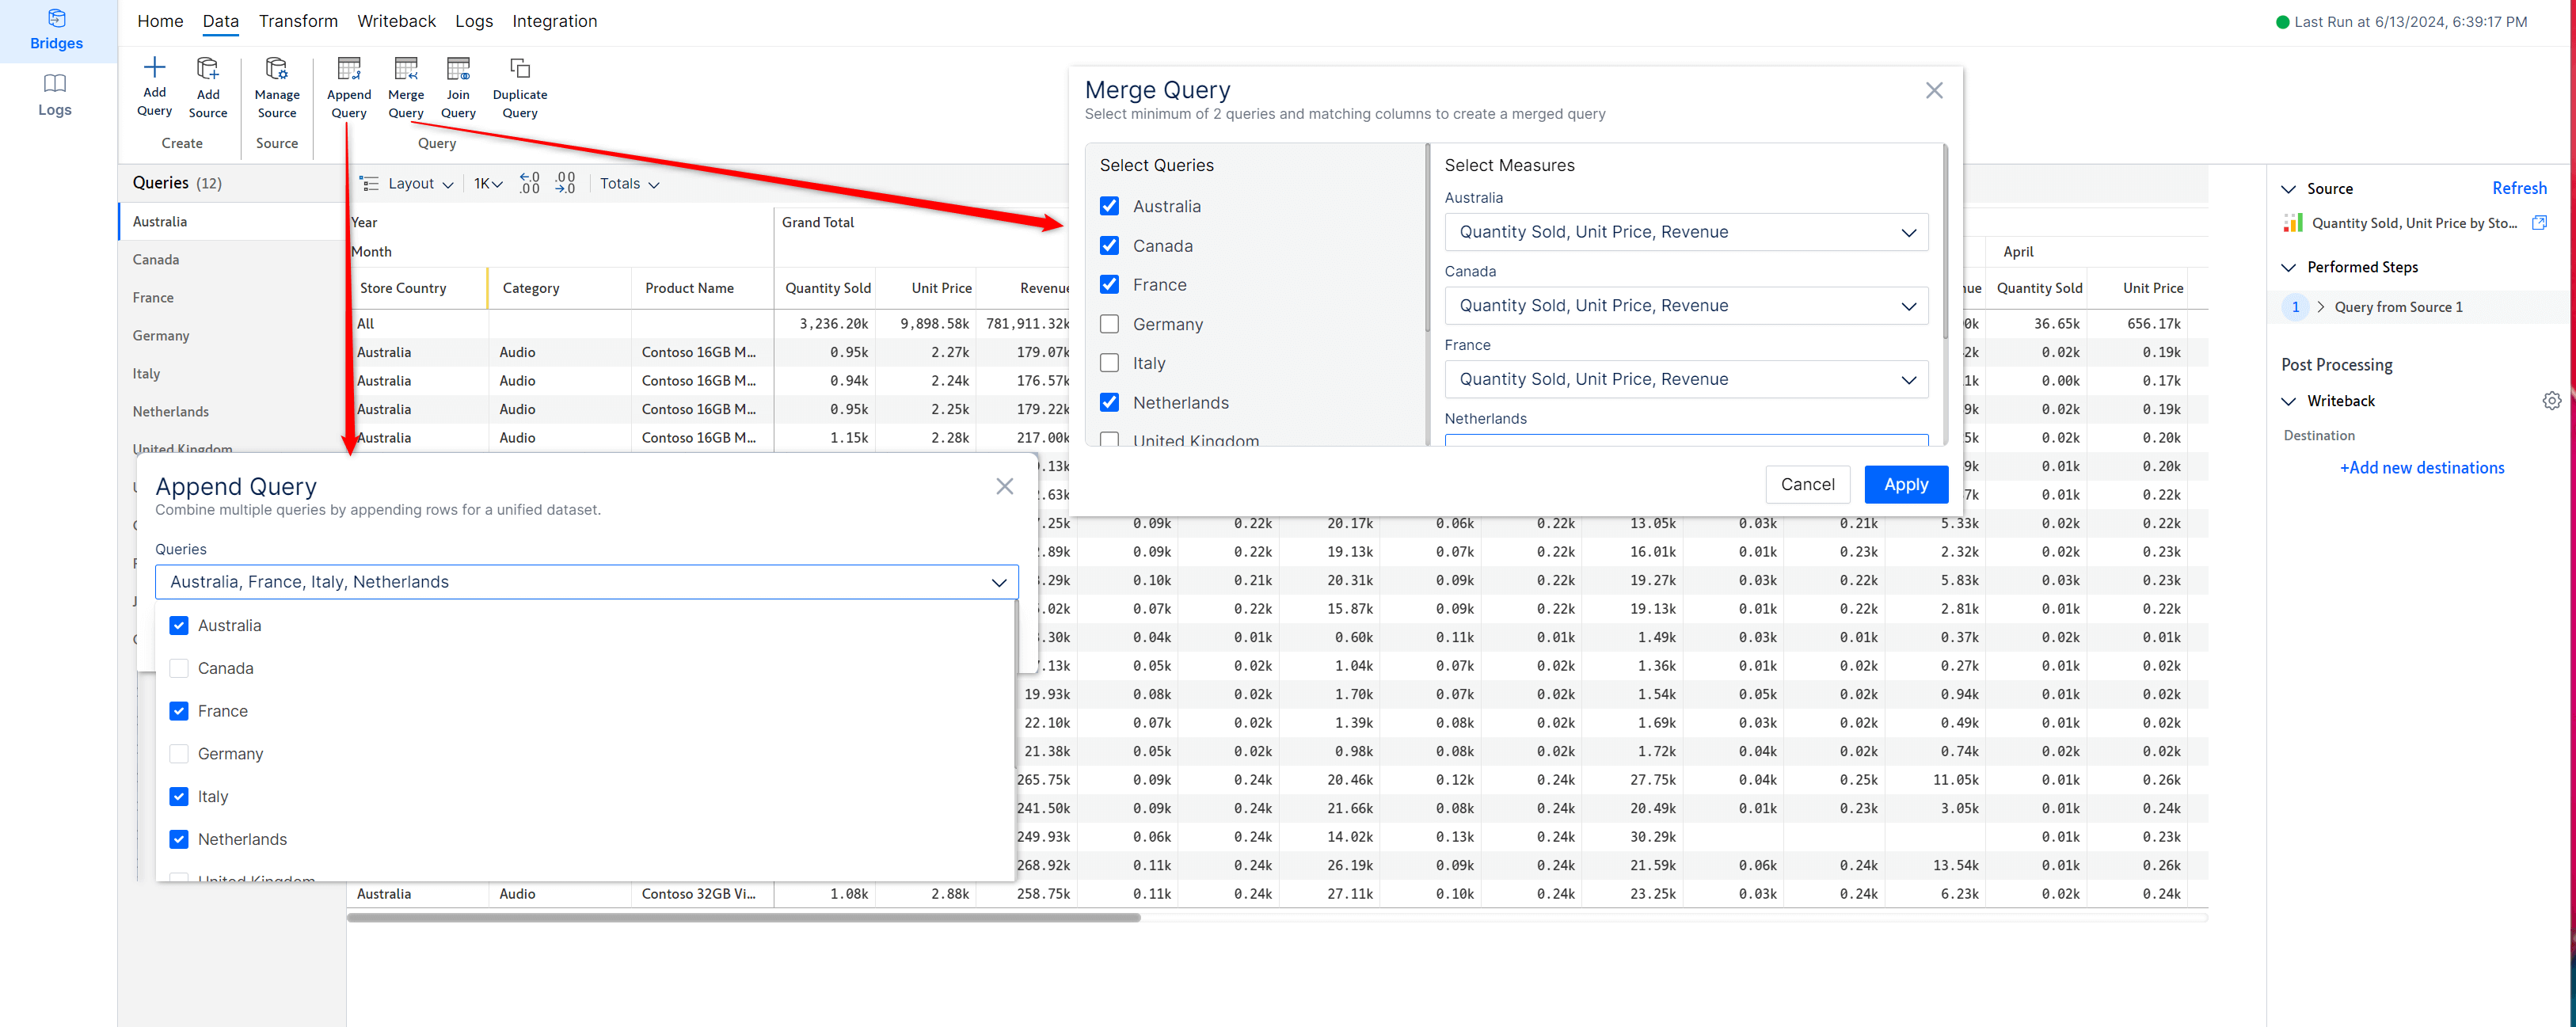
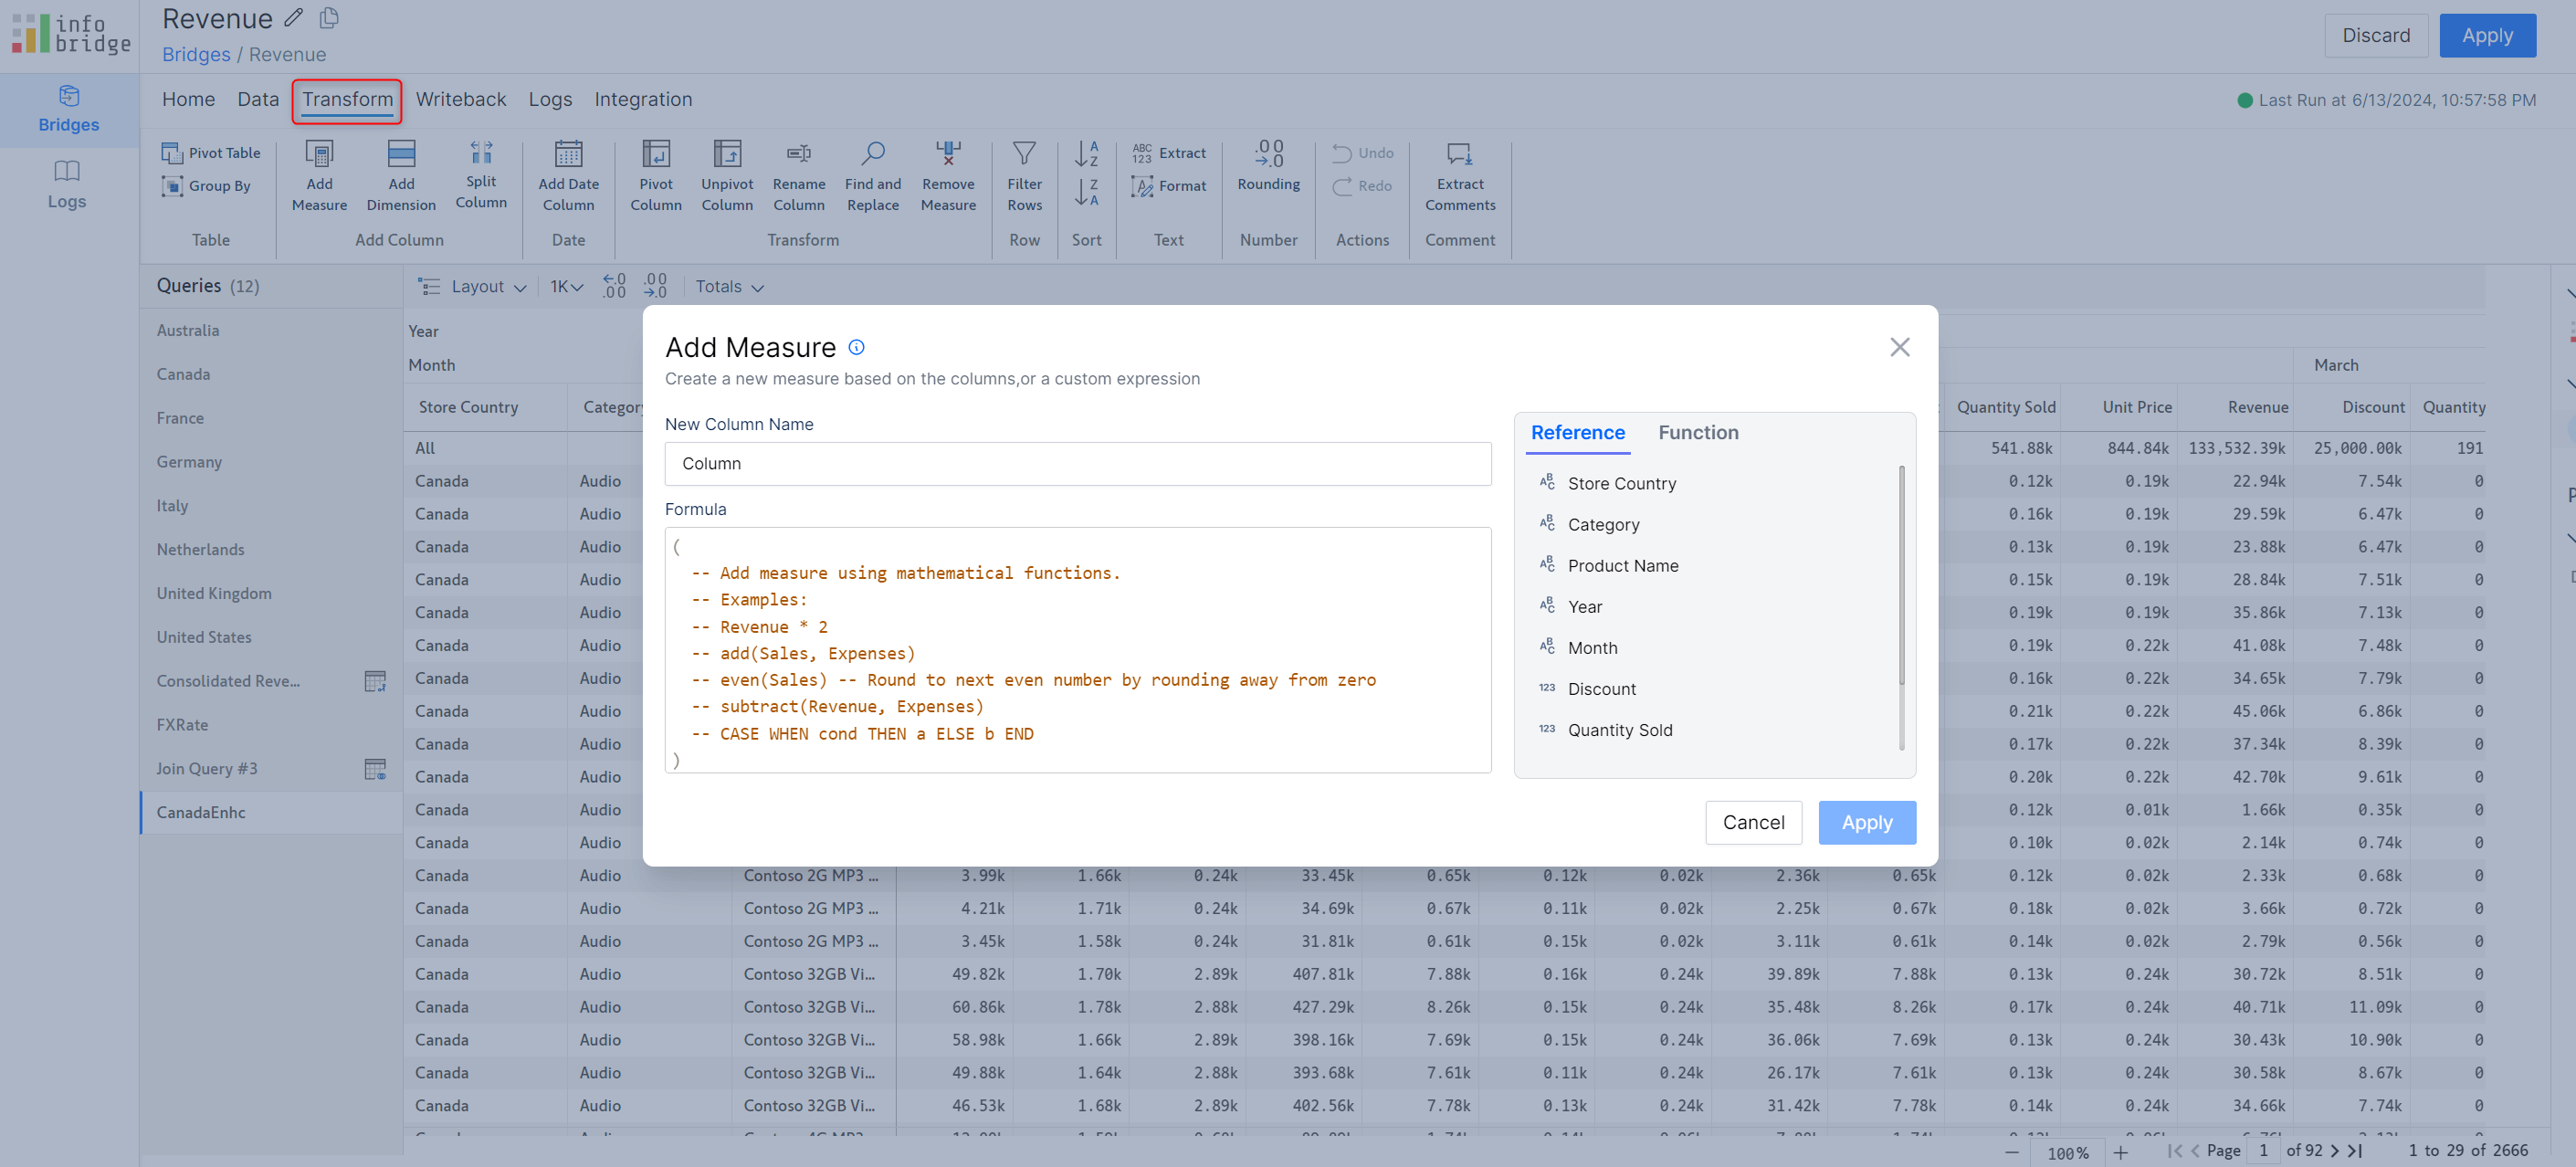
You will also find various column-level options such as adding dimensions and measures, pivot and unpivot, filtering, and rounding data.
Bringing you One Workspace – an integrated, inter-visual product suite for reporting, data management, visualization, and rapid planning.
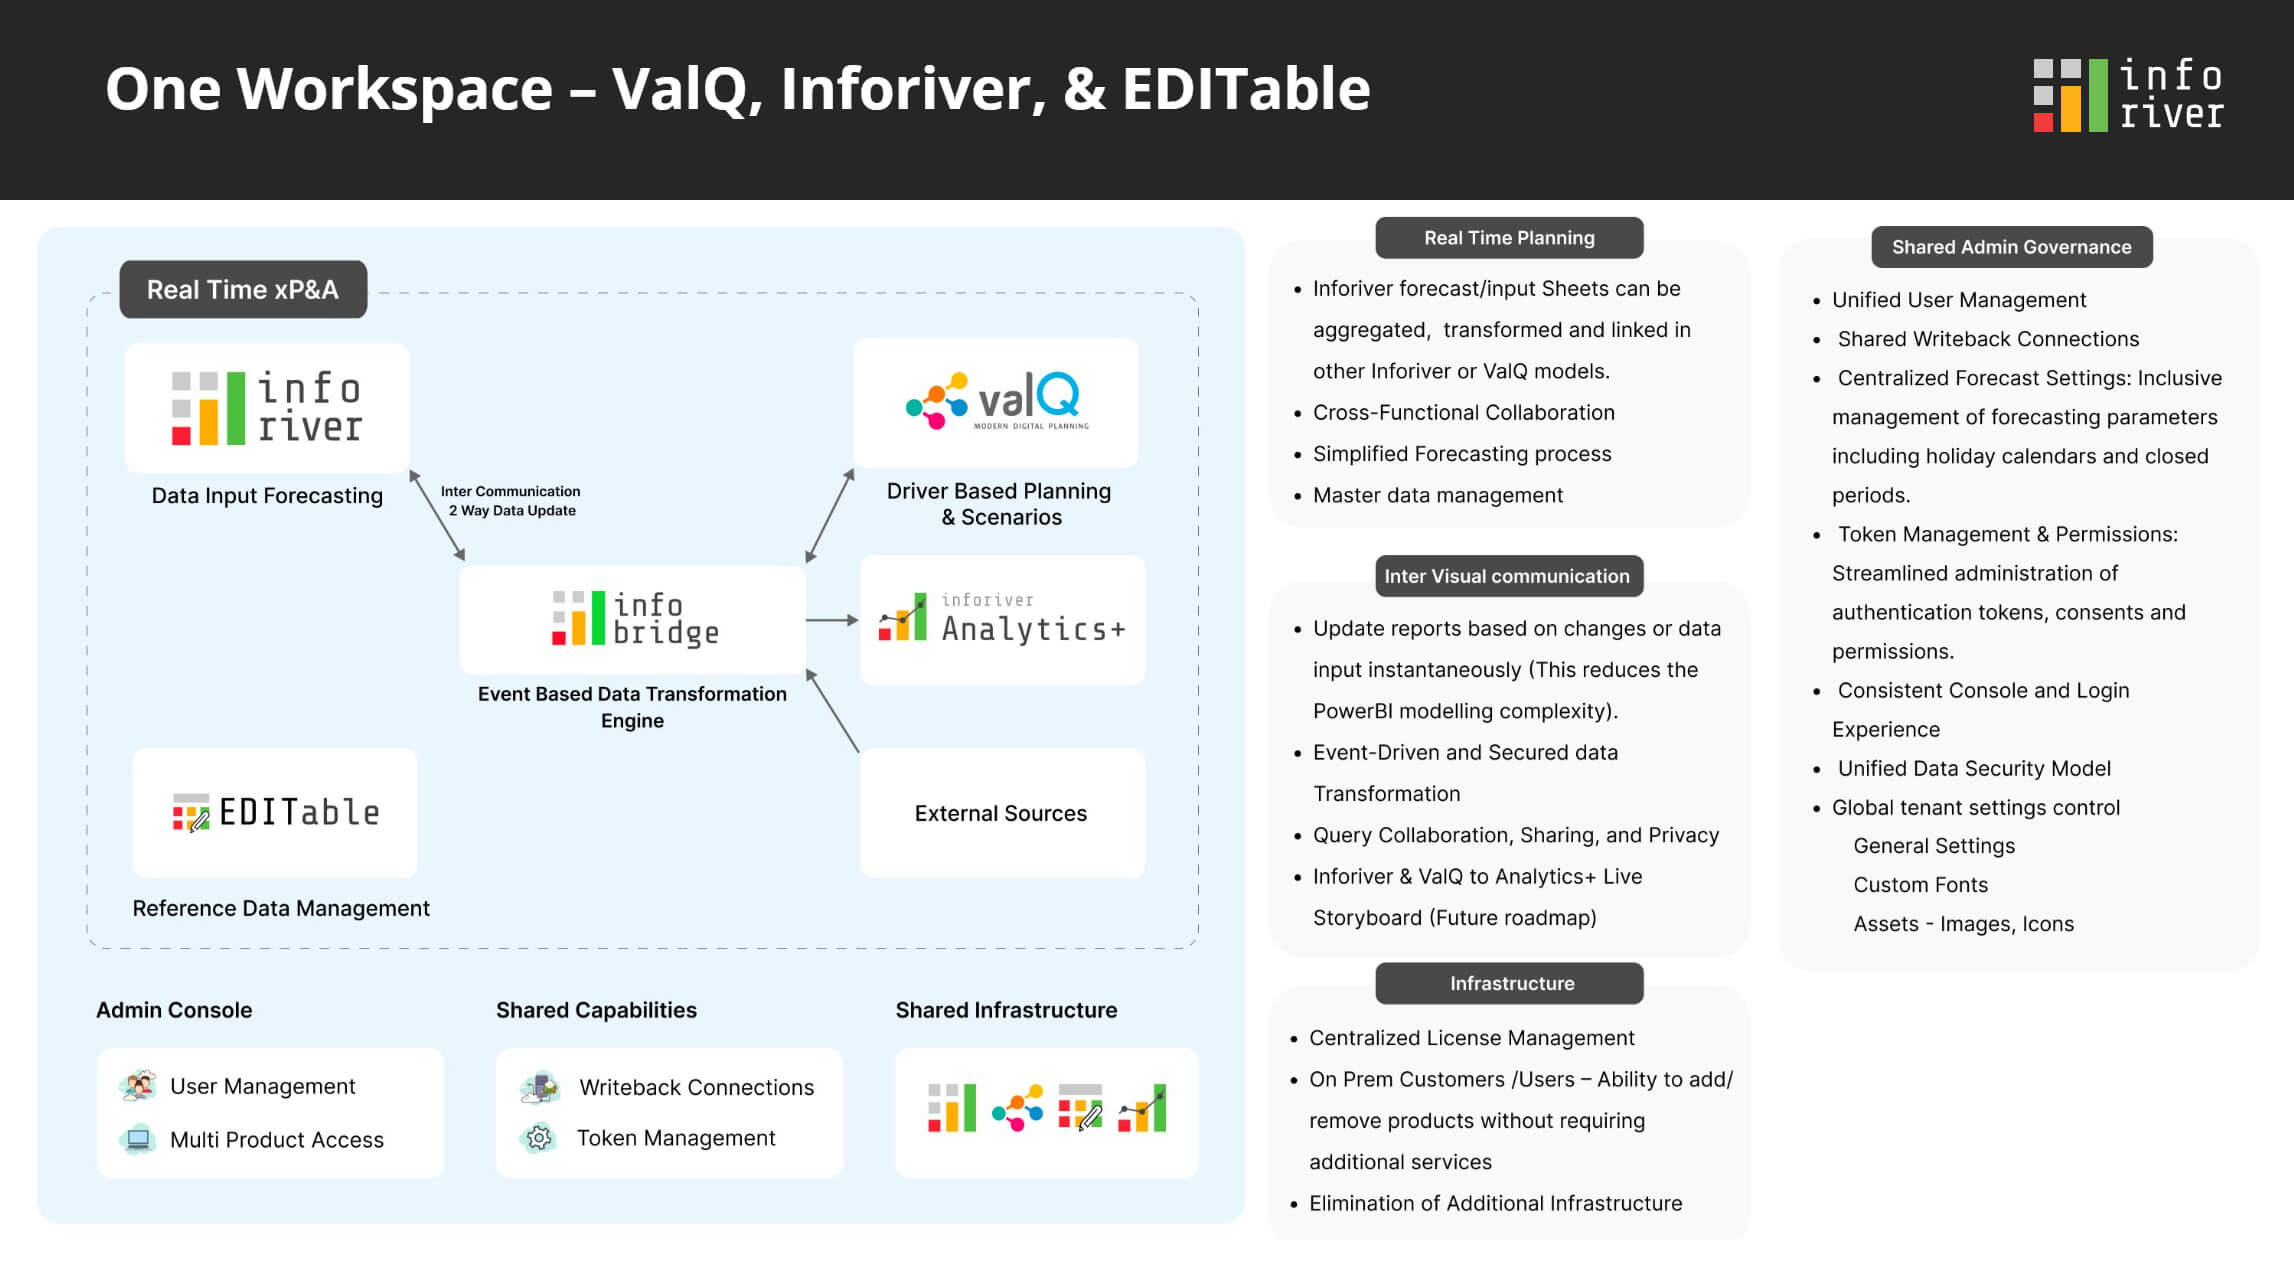
ValQ and EDITable will also be integrated into subsequent versions.
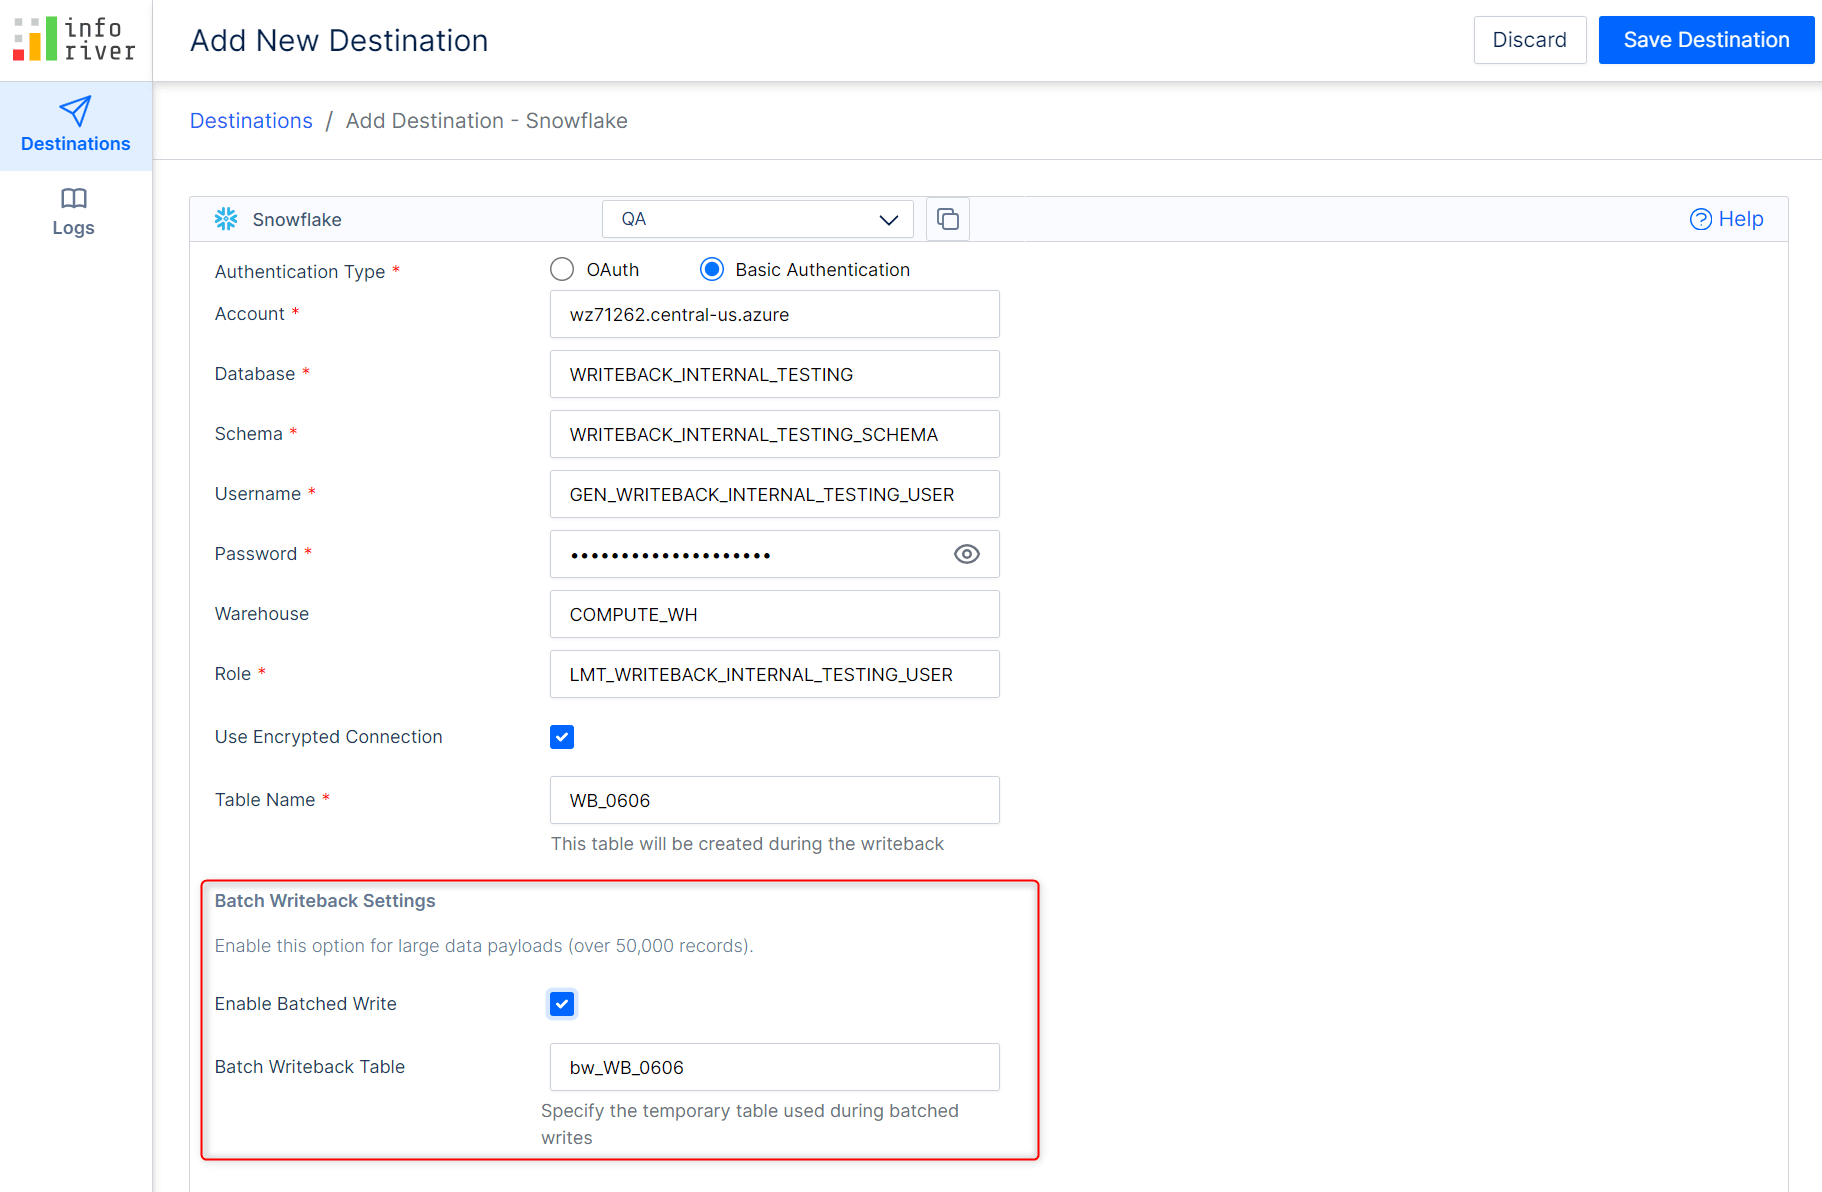
If your writeback payload exceeds 50k records, Inforiver splits it into multiple chunks and writes them back batch-by-batch. When you add a destination, you can specify whether you will use a temporary table to hold the batched data.
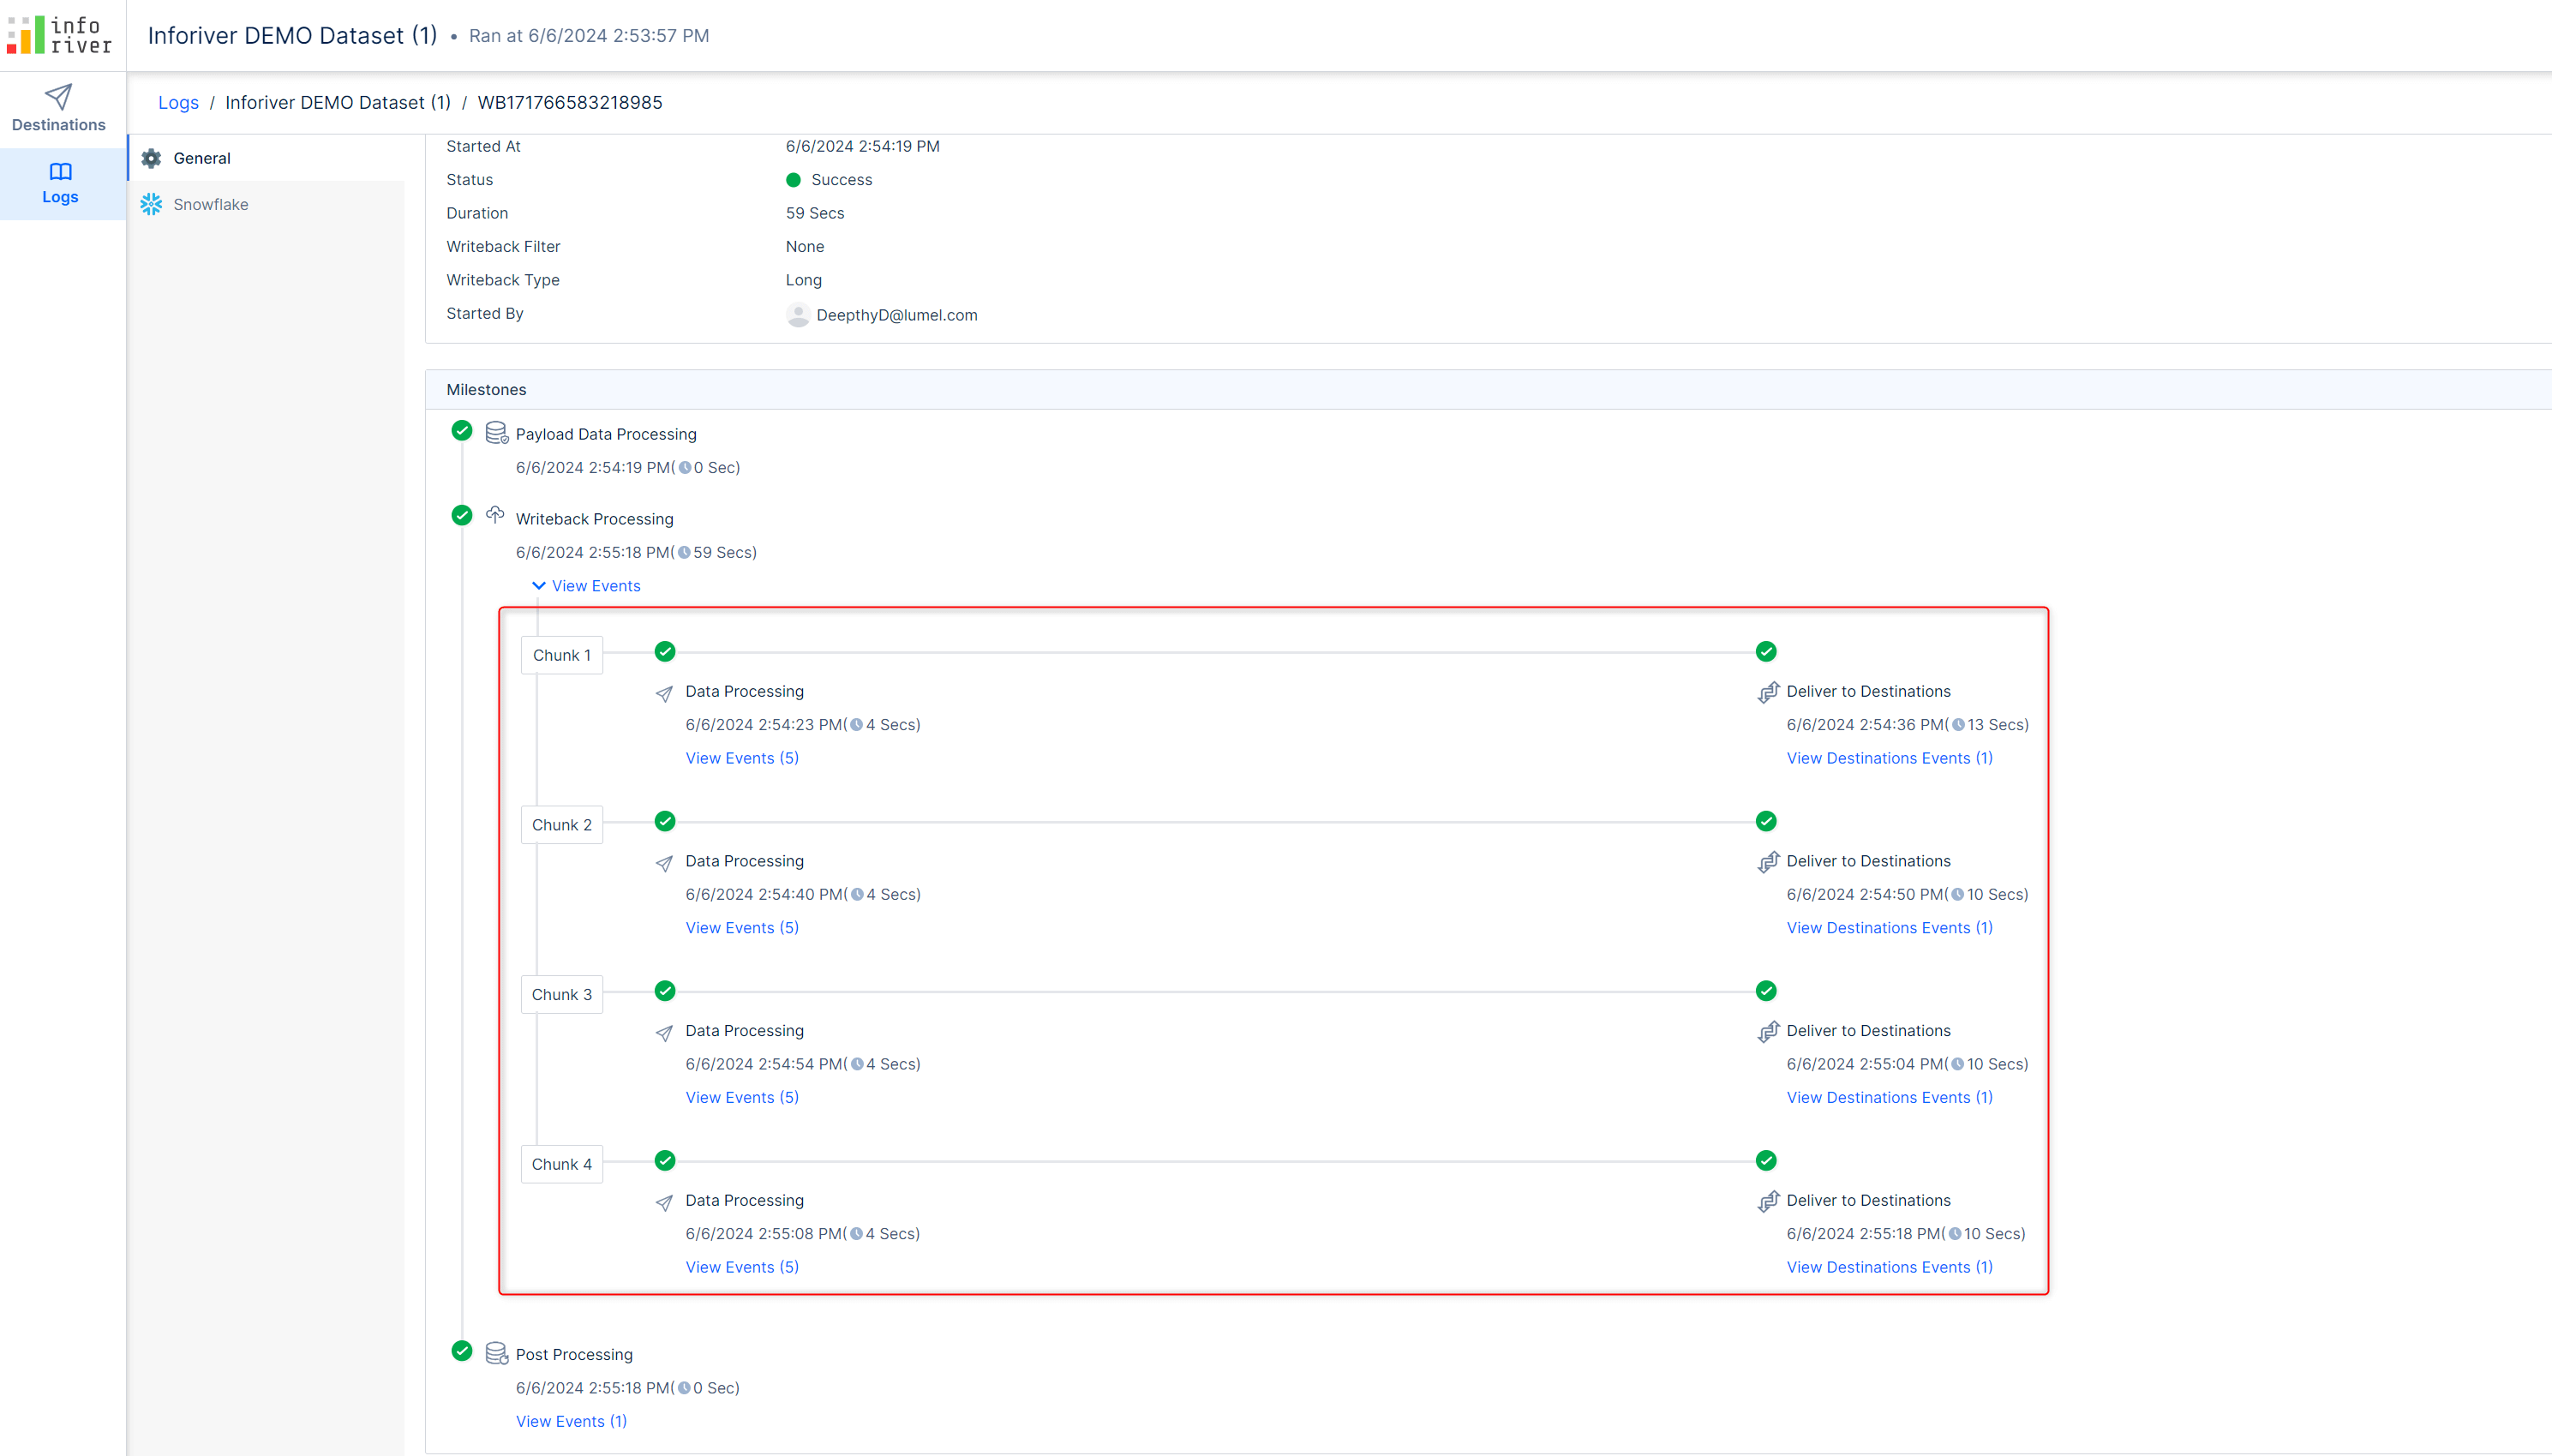
Additionally, the writeback log will capture how the payload has been split into multiple chunks and processed in parallel to boost performance.
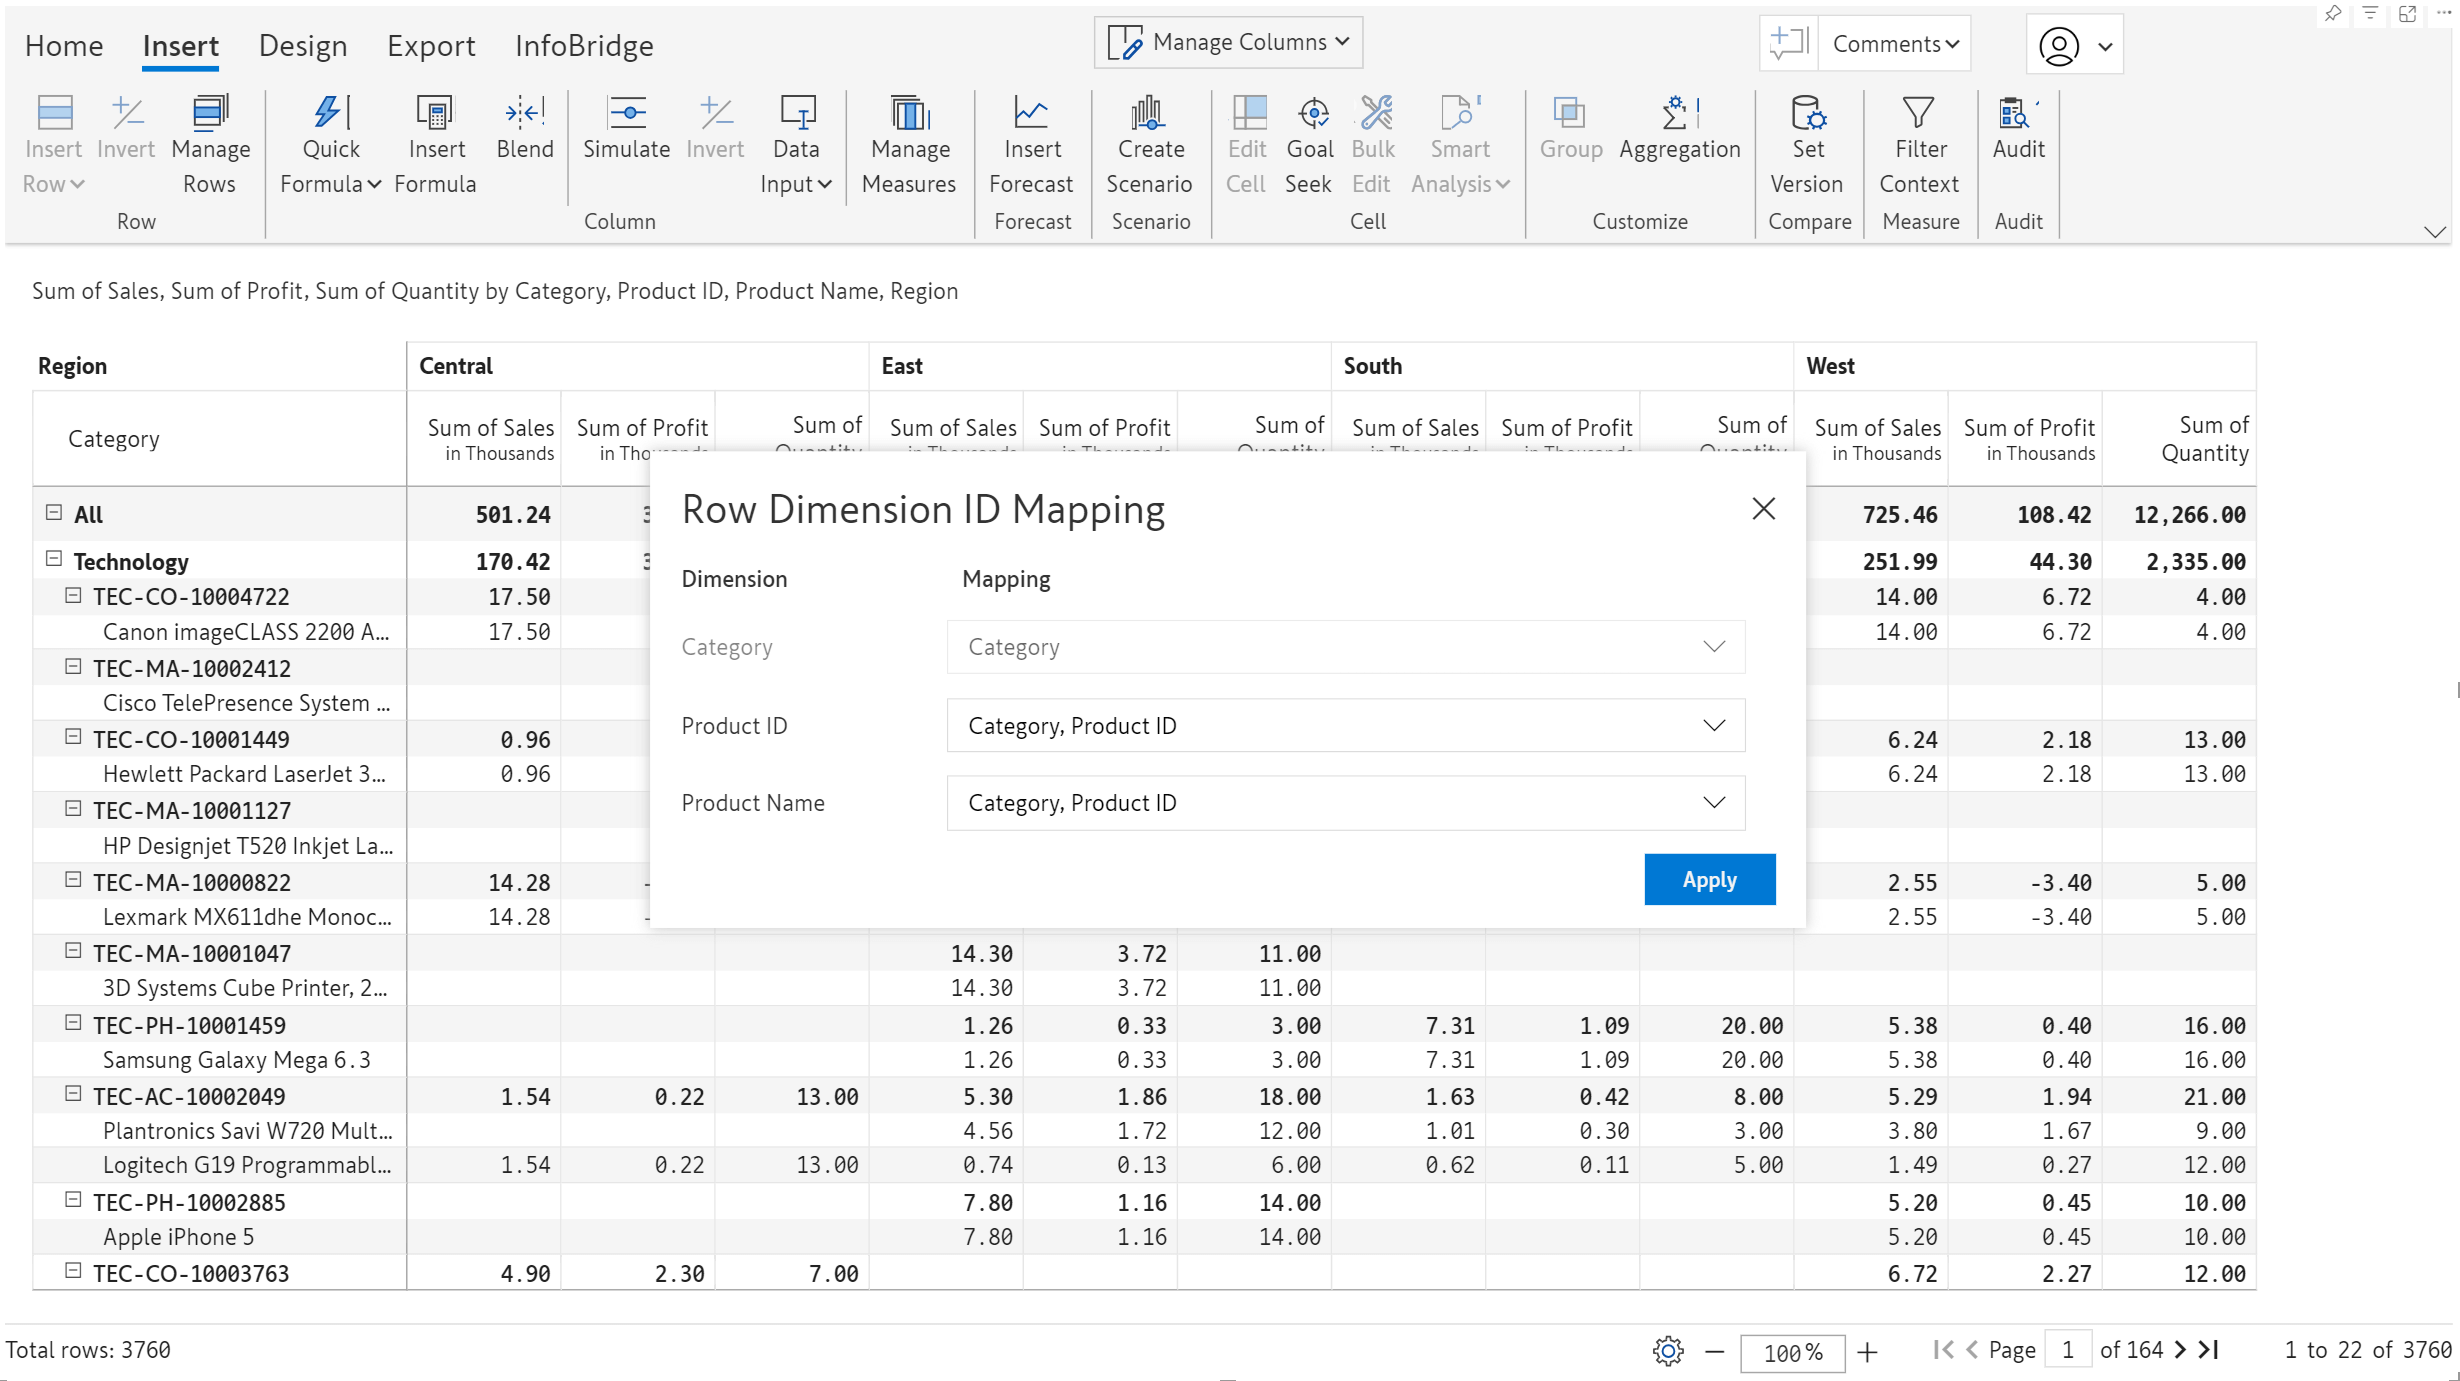
In the April release, we introduced the Row Dimension ID Mapping, which enables you to choose the dimensions to uniquely identify a row. For instance, you can identify a product using the product ID instead of the product name.
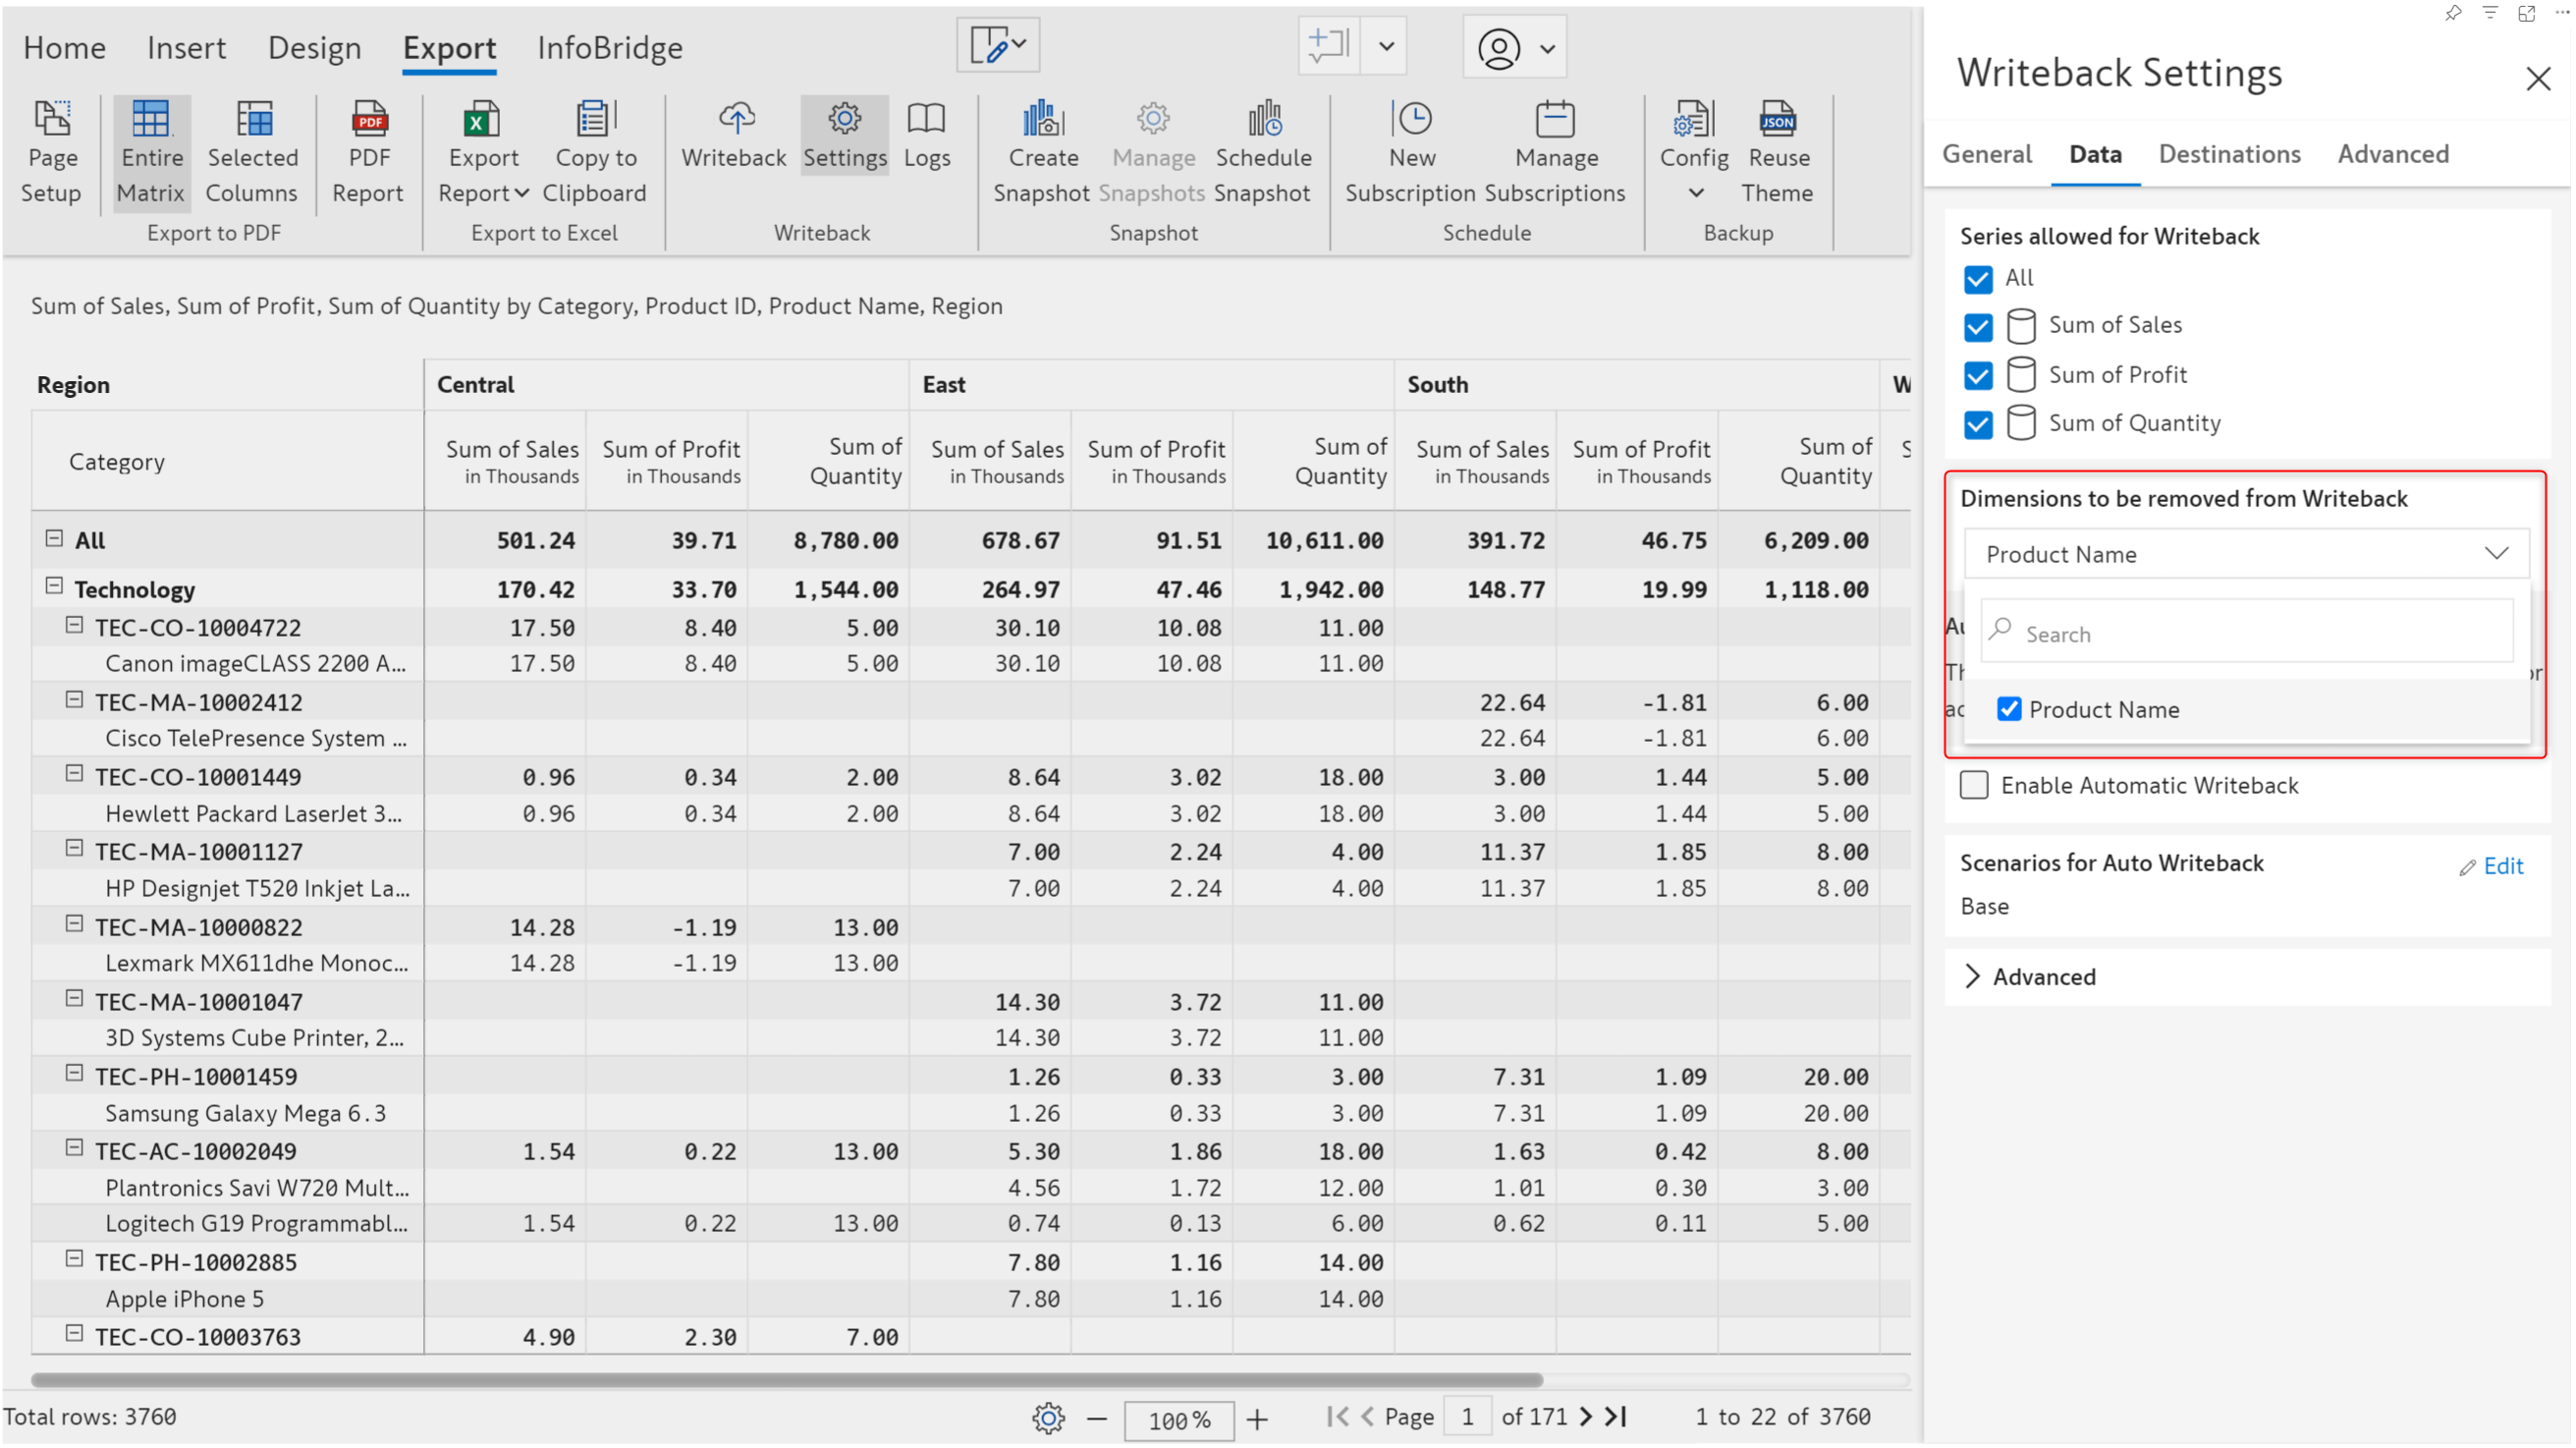
We’ve broadened the scope of row dimension mapping to include writeback. You can exclude a dimension from writeback, provided a valid Row dimension ID mapping has been set up. Since the Row Dimension ID Mapping is based on the Product ID, the Product Name is redundant and can be dropped from writeback.
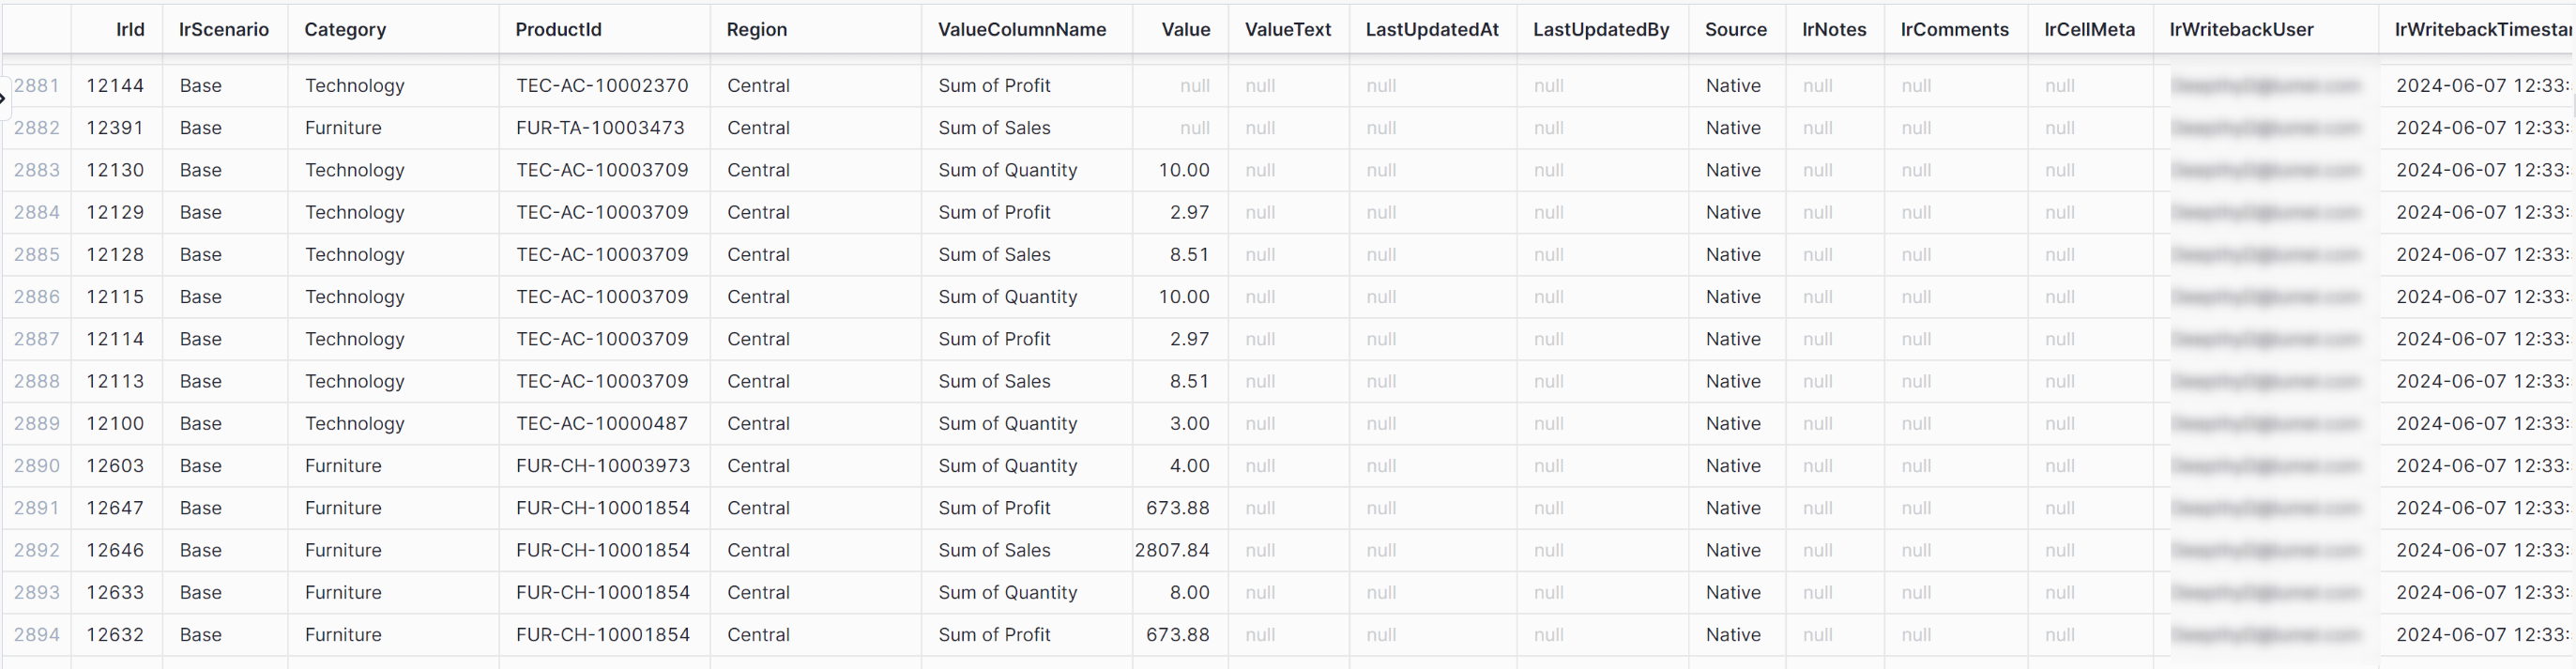
The product name field is not written back, as the product ID field can be used to distinctly locate a row.
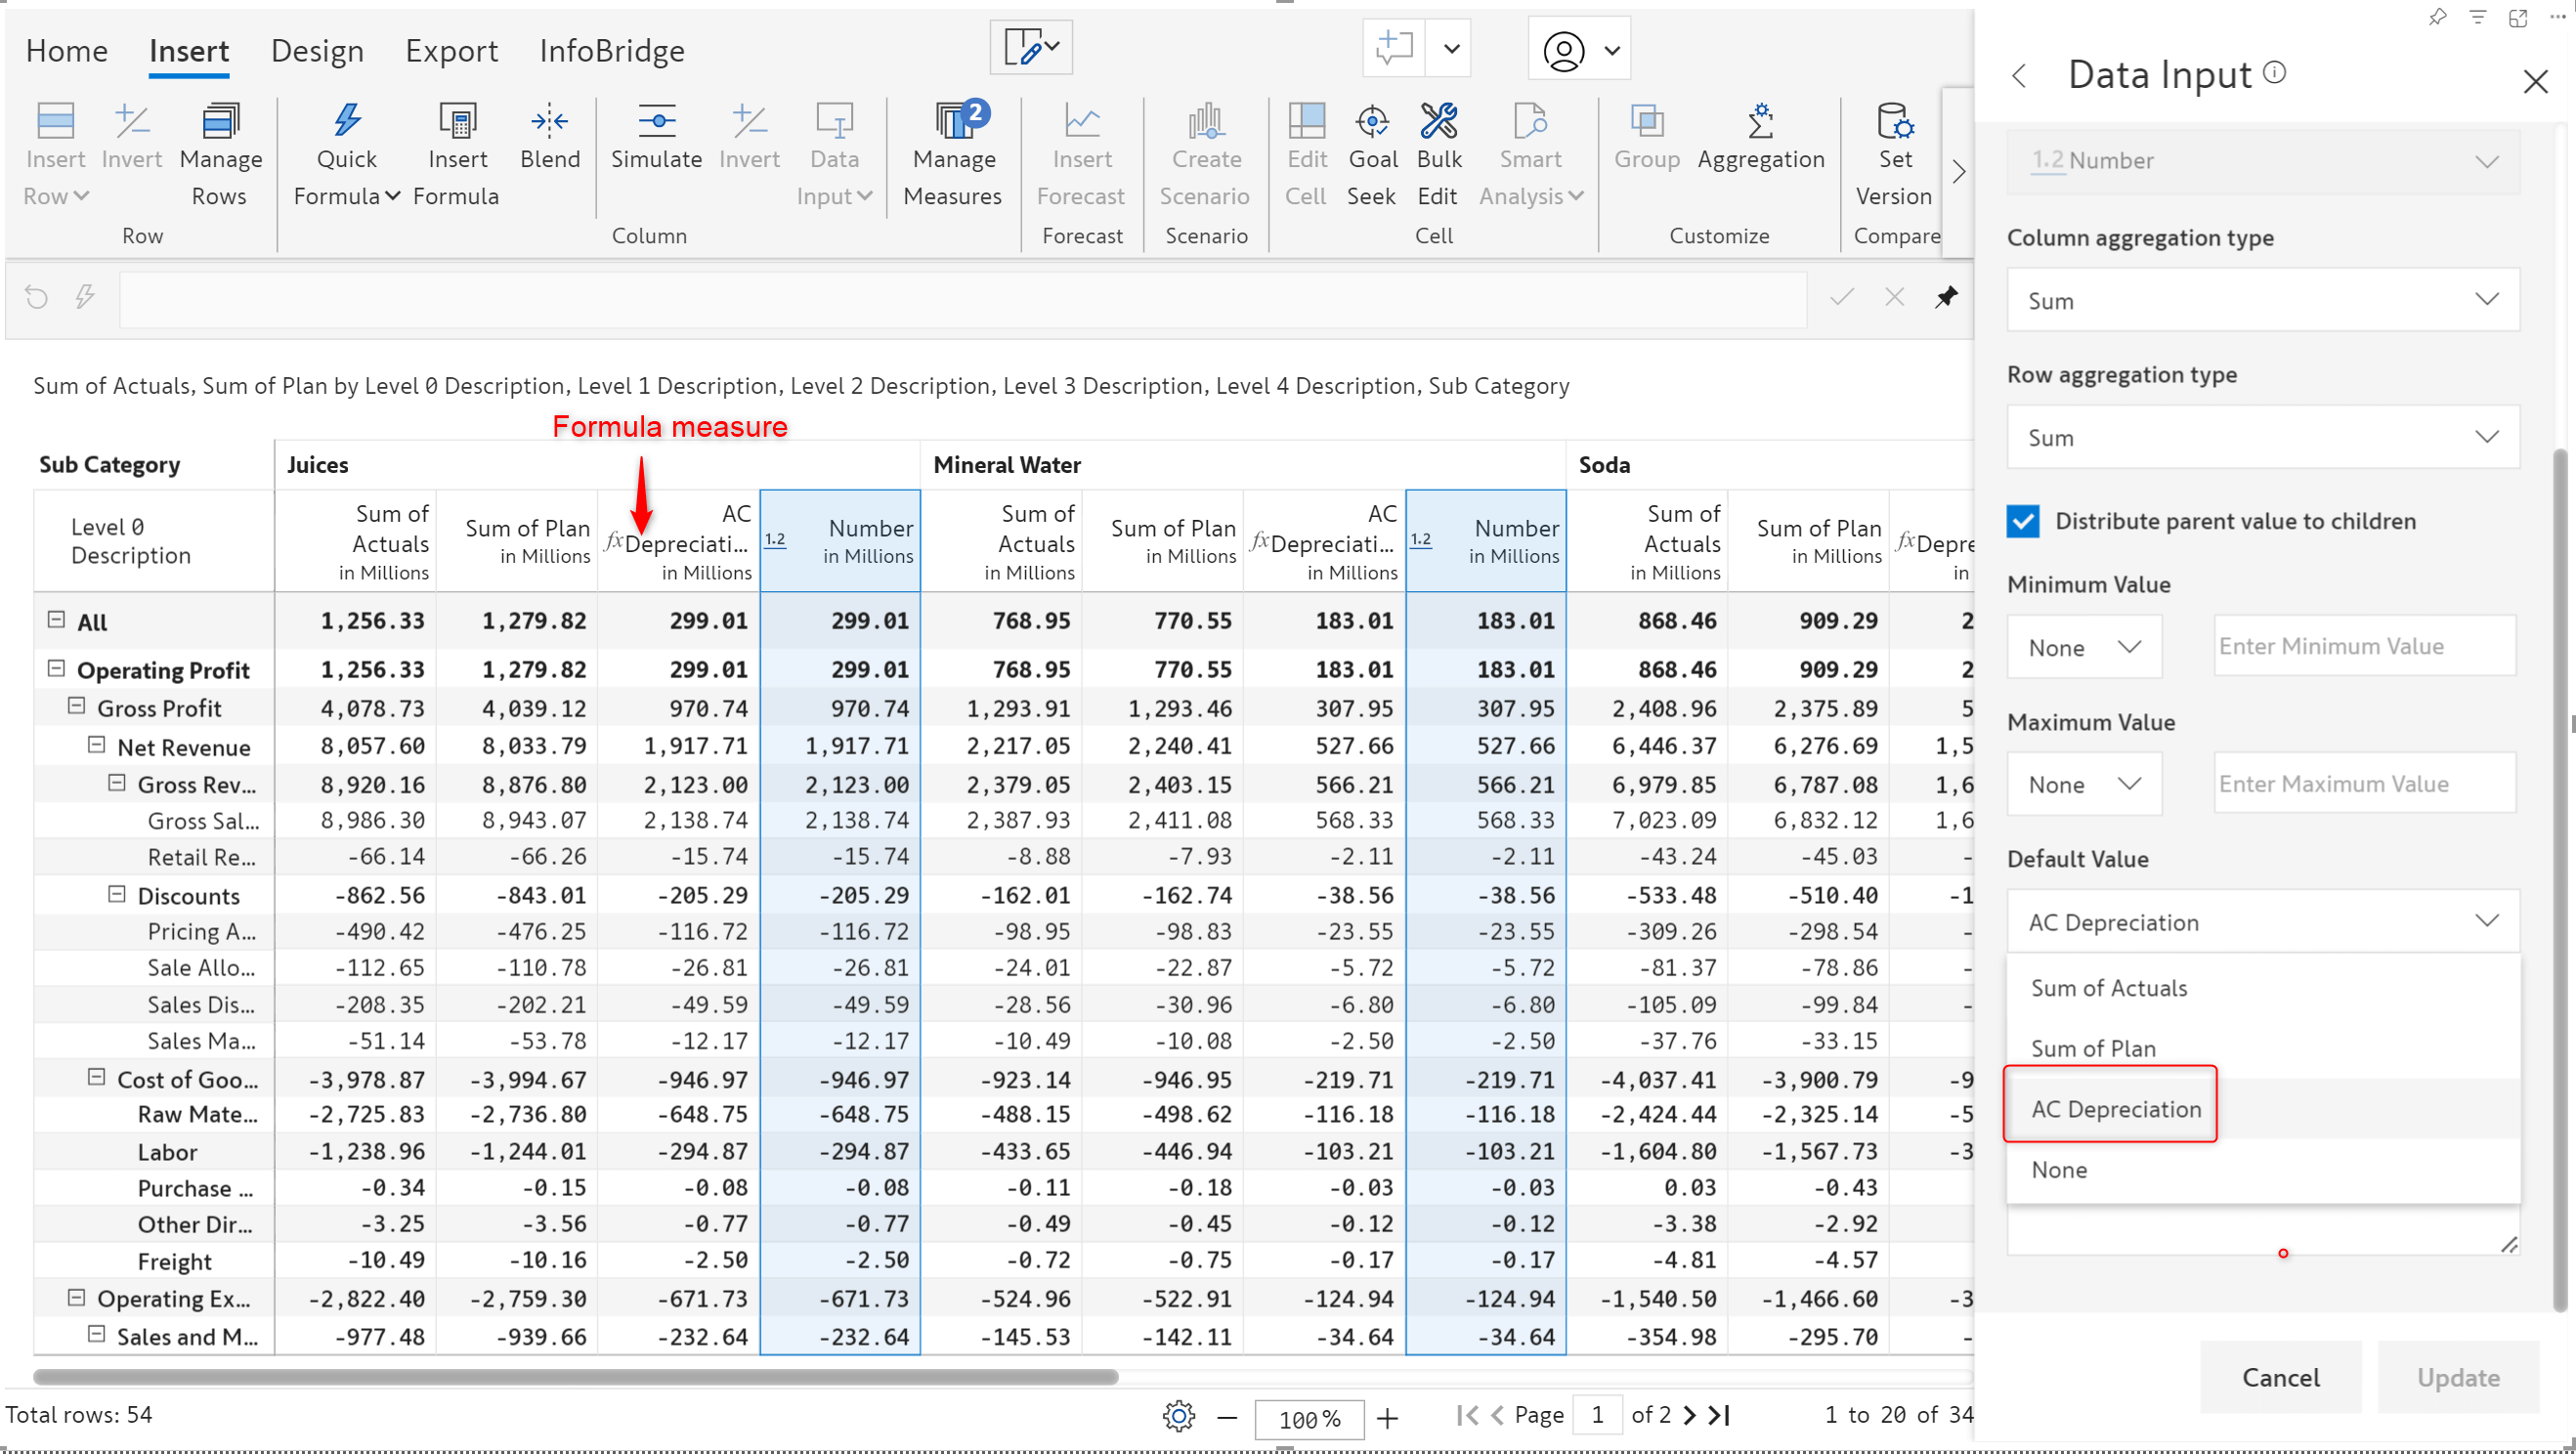
Don’t want blank values in data input measures? Inforiver provides a default value option - you can use the values from a native measure as default values for a data input field. With the 3.0. version, you can also use formula measures as default values for numeric data input fields.
We’ve used the AC Depreciation formula measure as the default value for the data input field.
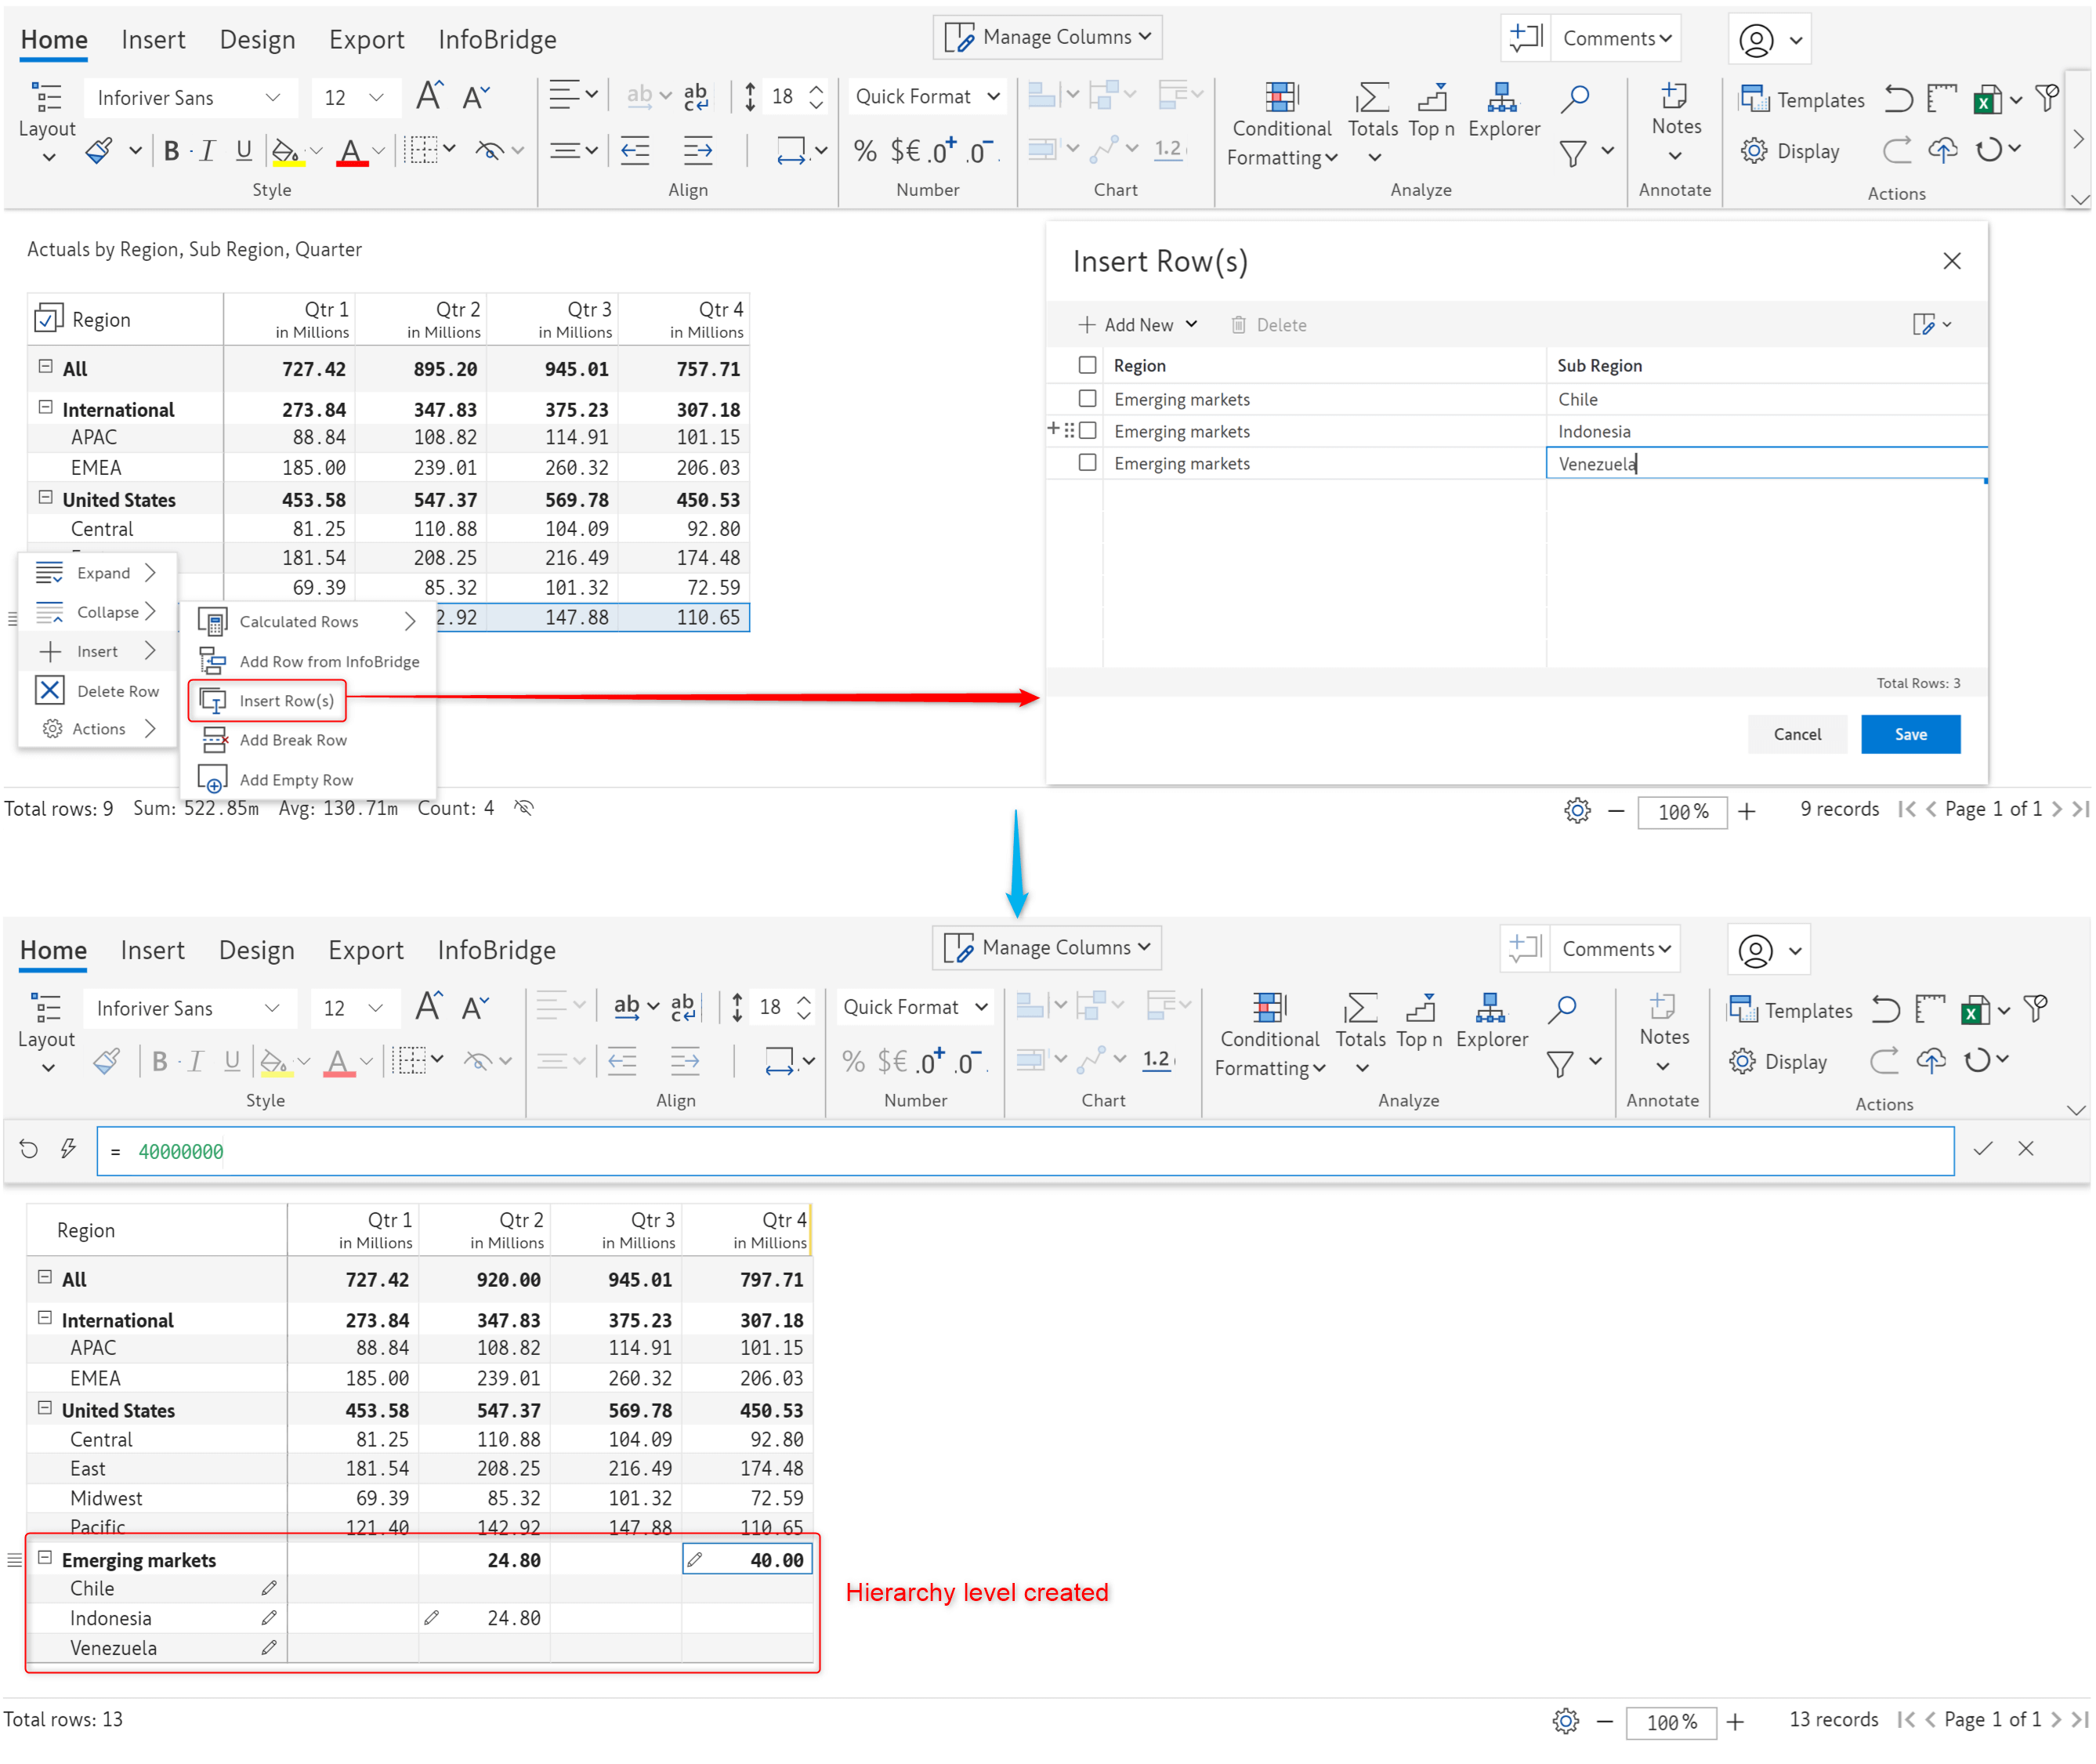
With Inforiver, you can easily create hierarchies at the visual level without updating the underlying dataset. For instance, if you have a new branch in the organizational hierarchy or a new section of products, you can create the hierarchy level within Inforiver and enter the data values. In the latest version, we’ve brought in a more advanced, straightforward, user-friendly interface to insert and manage hierarchies even from the reading view– The Insert Rows feature.
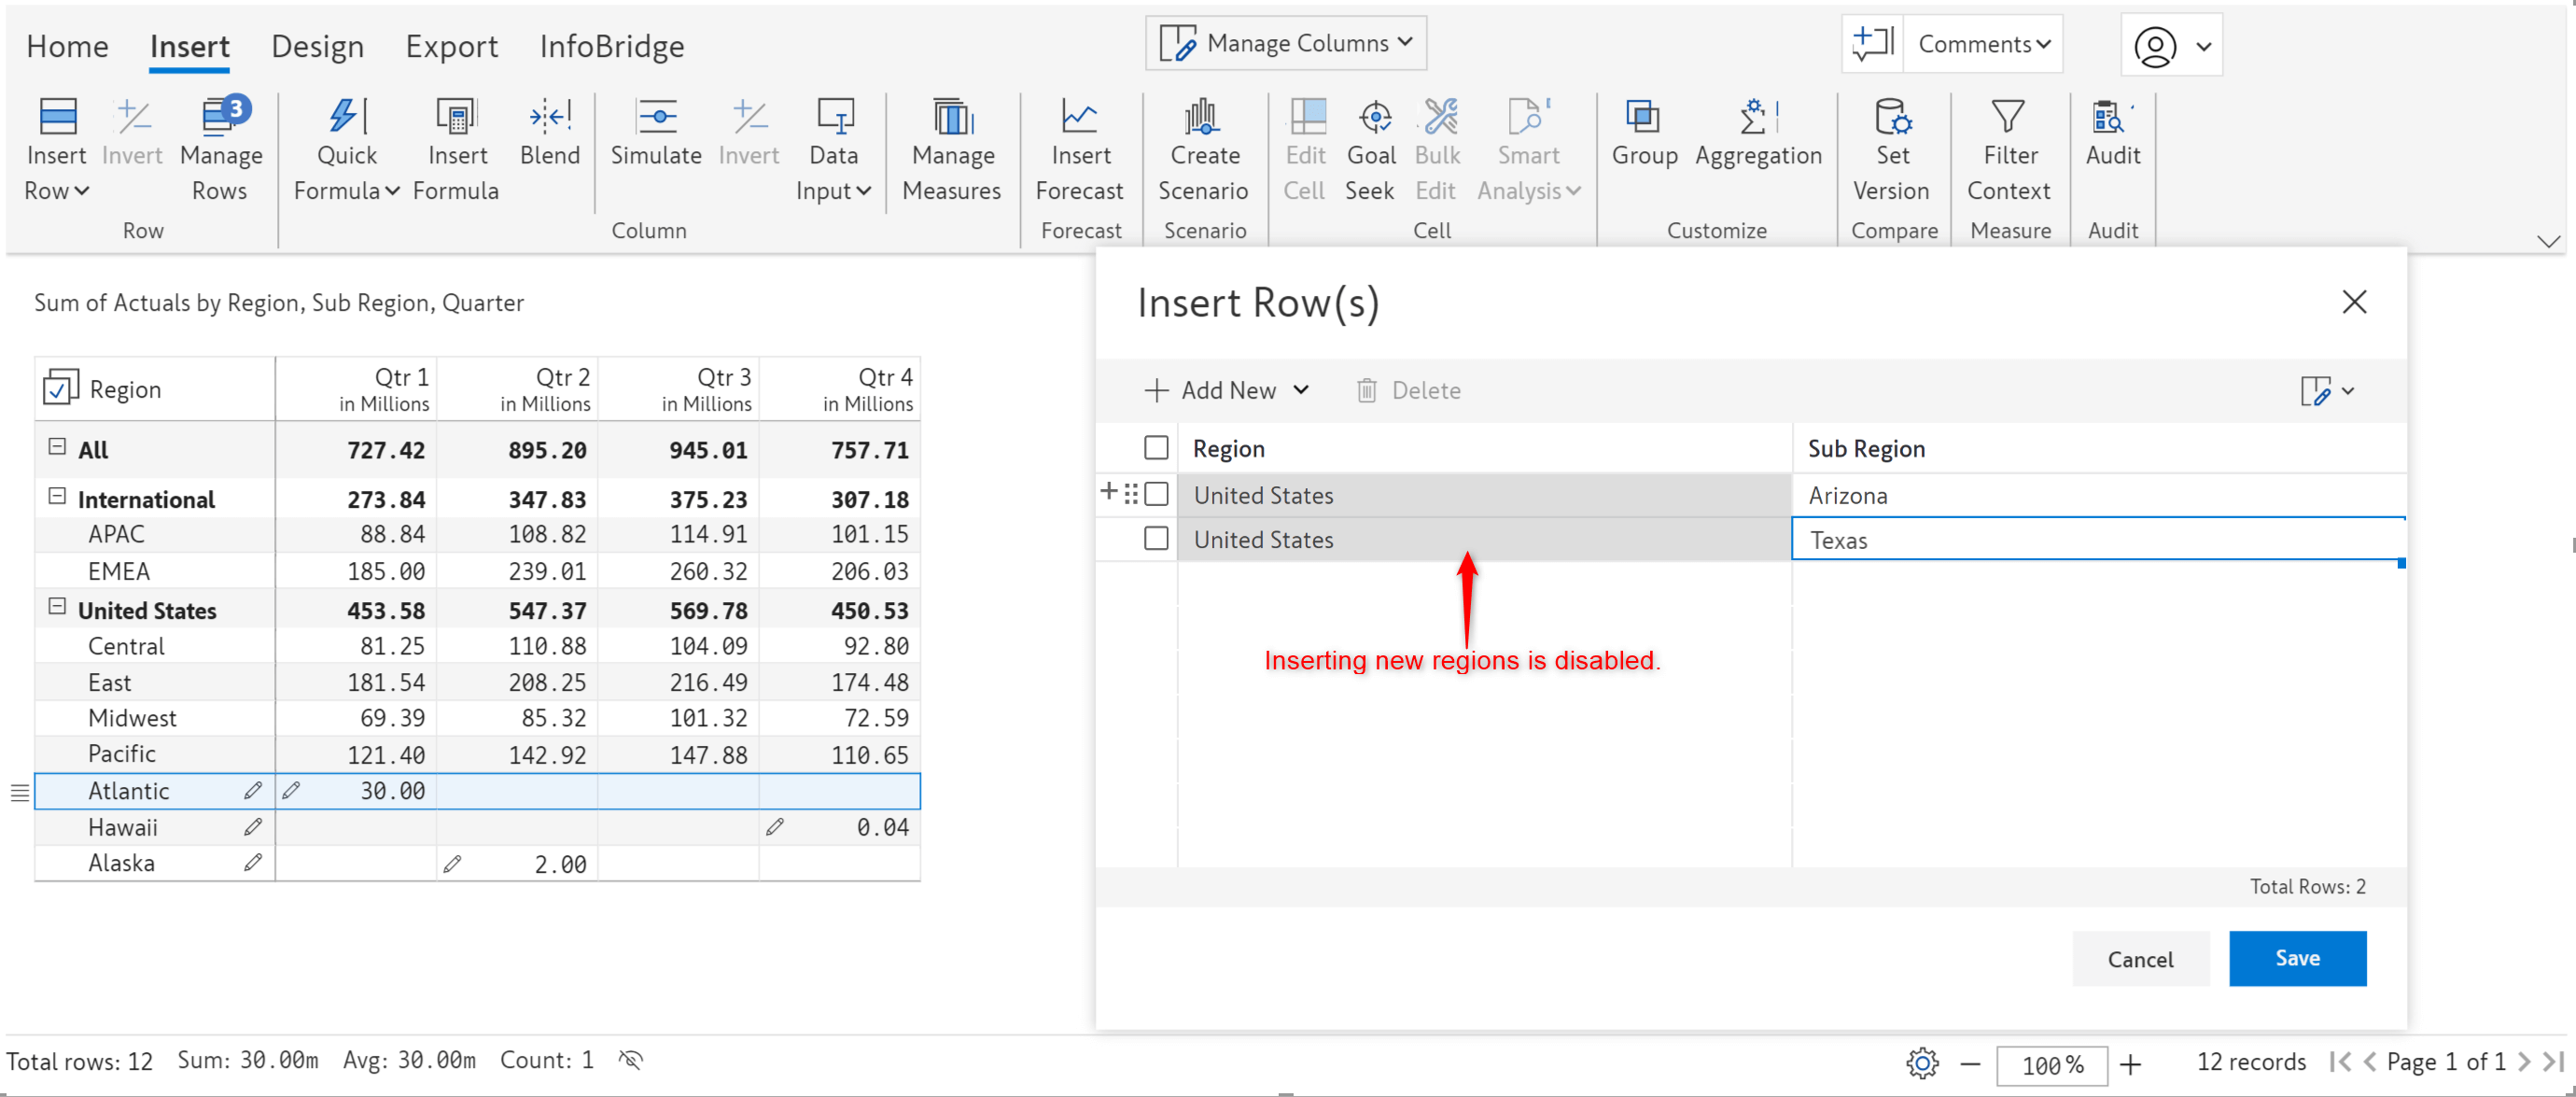
We’ve disabled the creation of new regions. However, new subregions can be inserted.
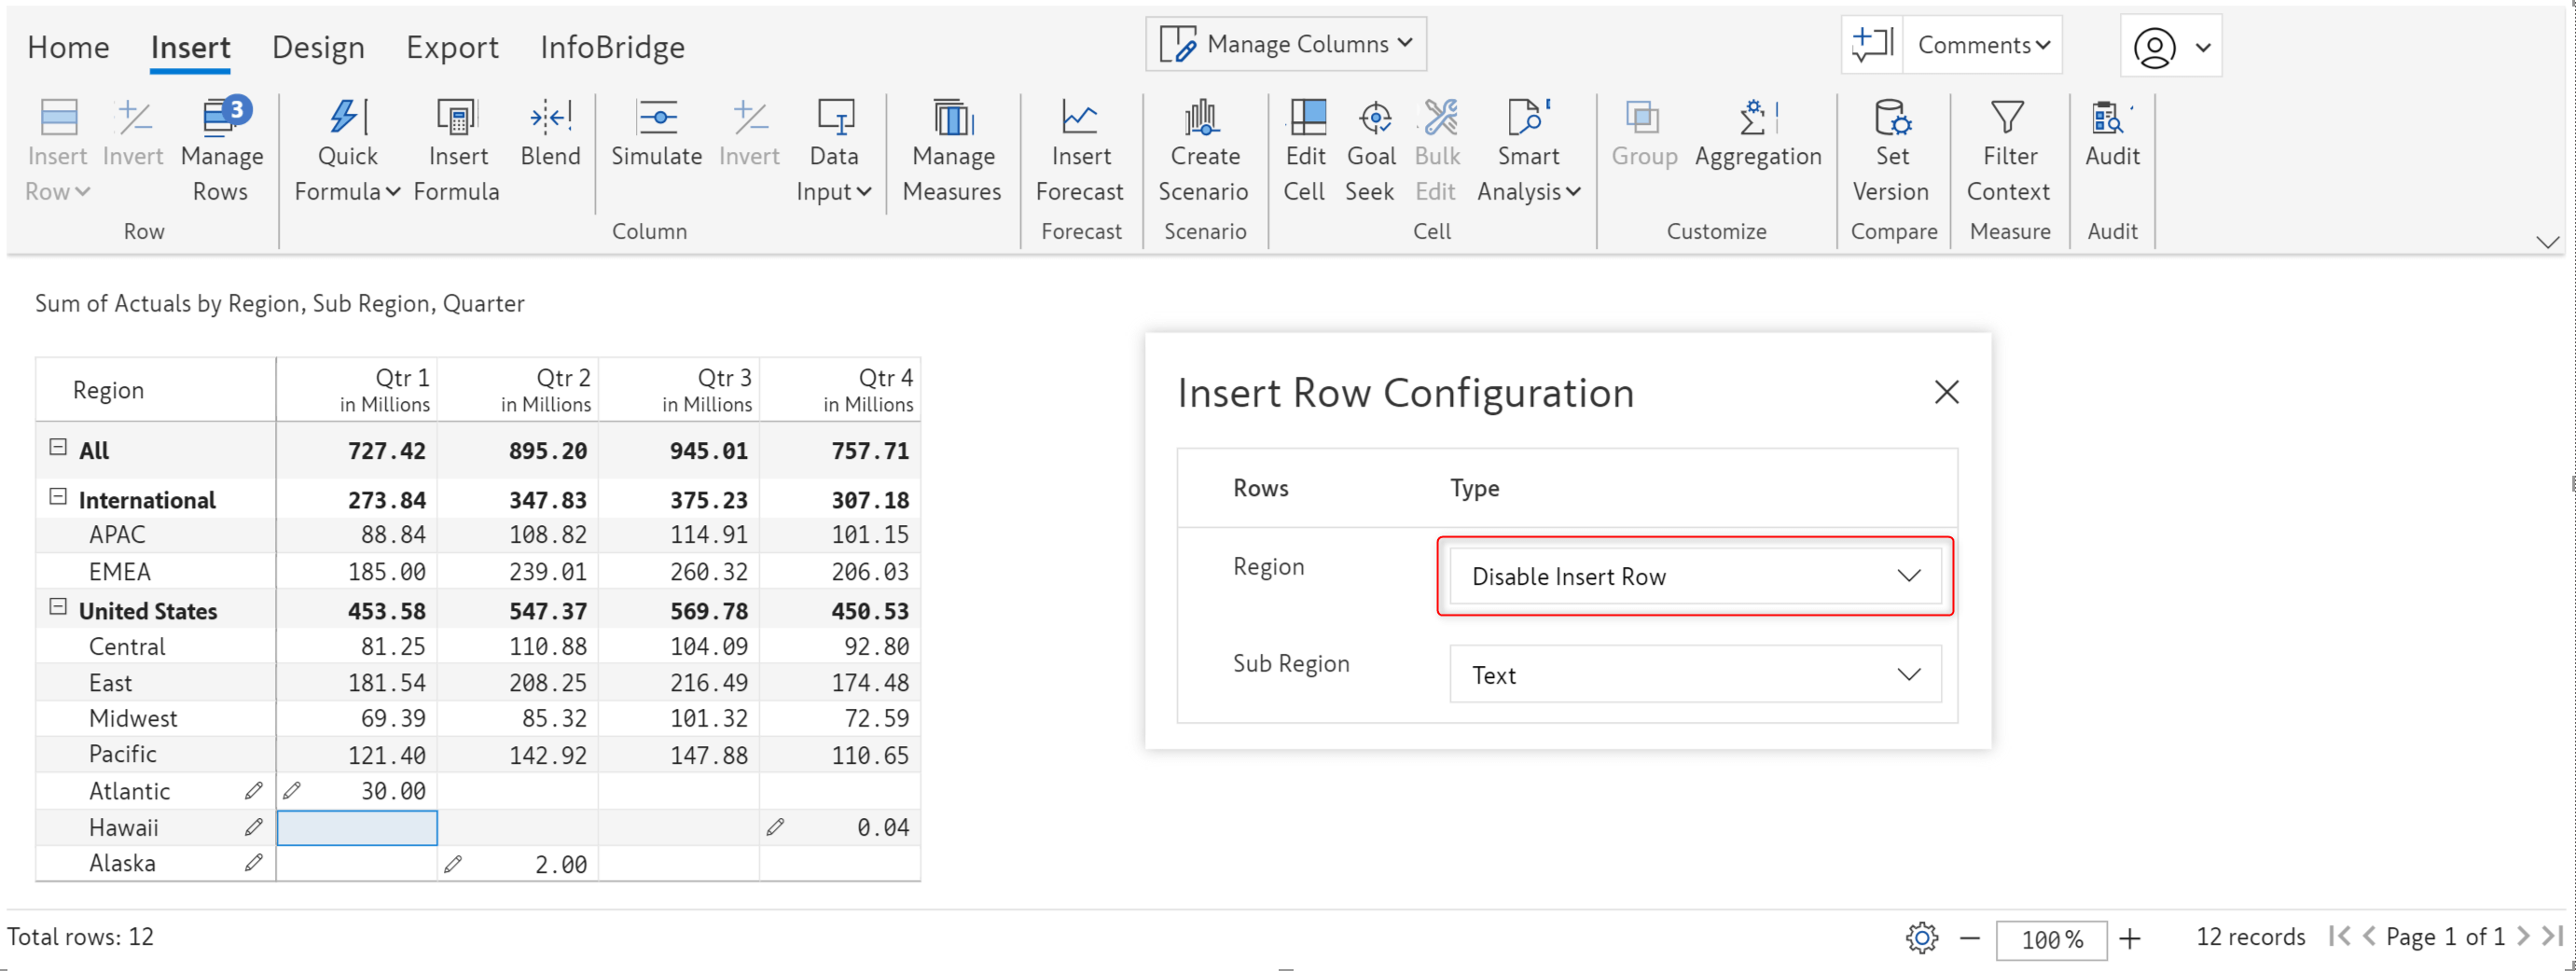
Notice how the Region textbox is disabled in the Insert rows window, but we are able to enter values in the SubRegion textbox.
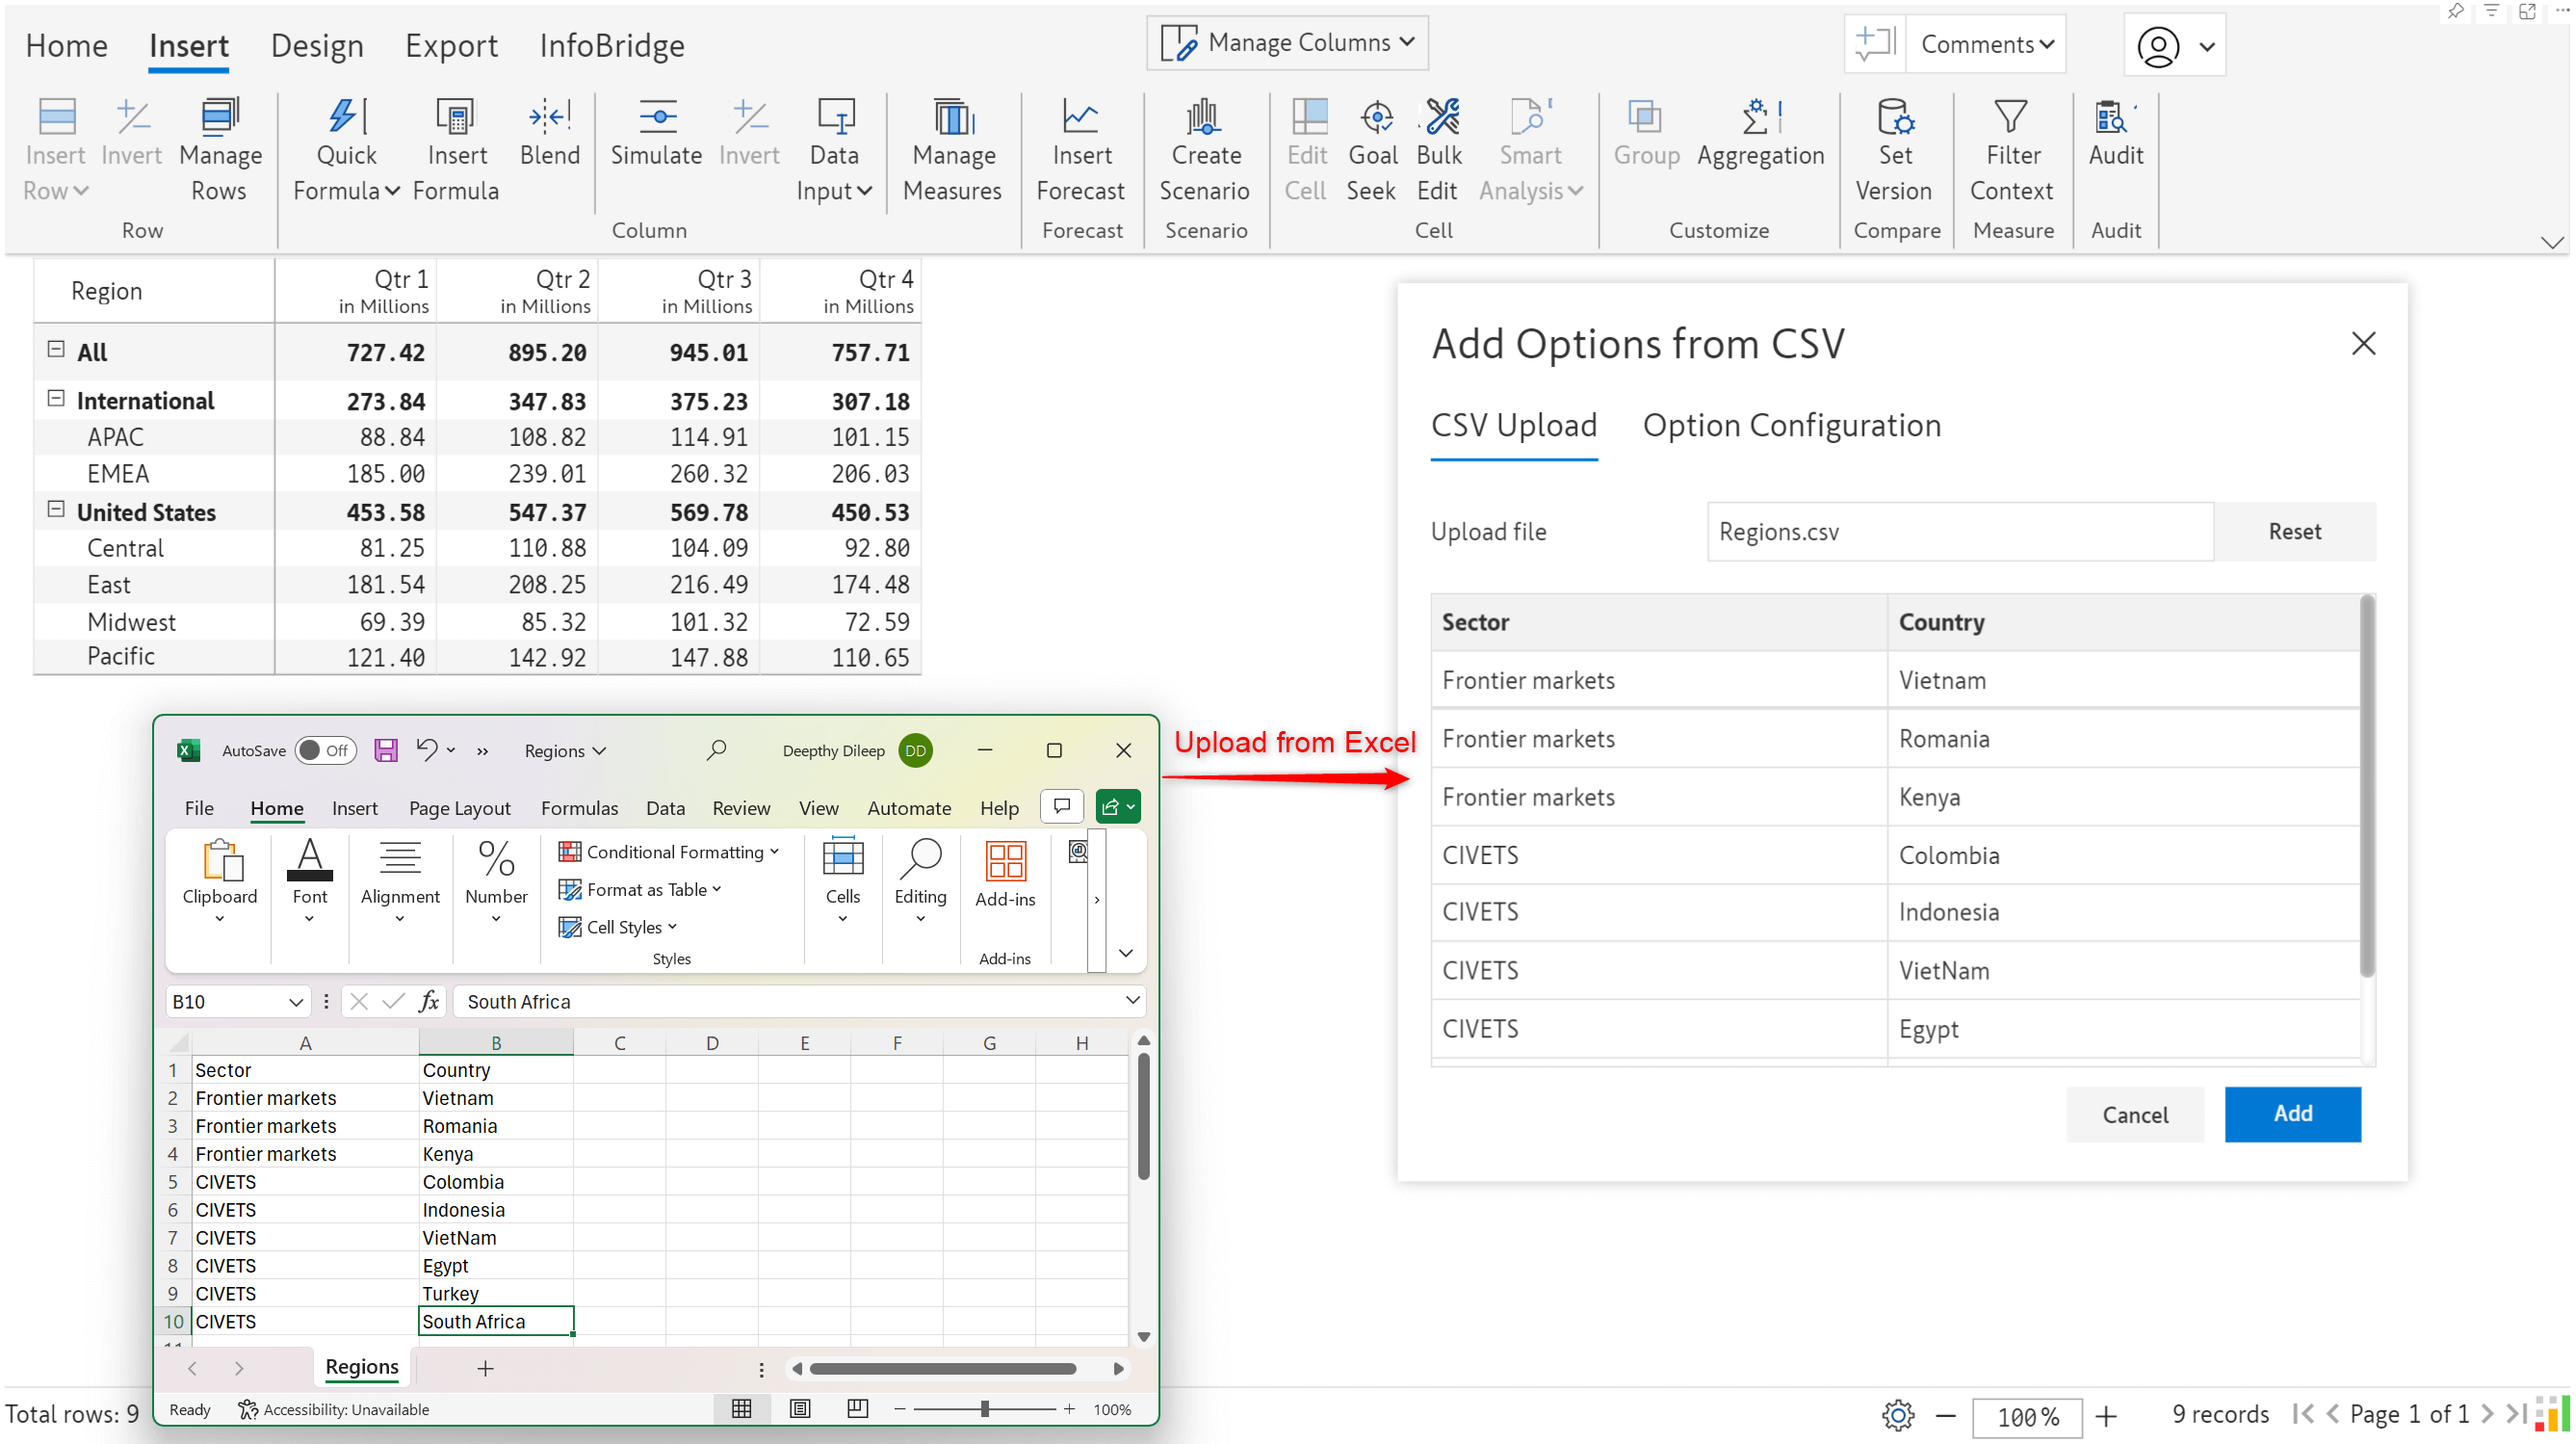
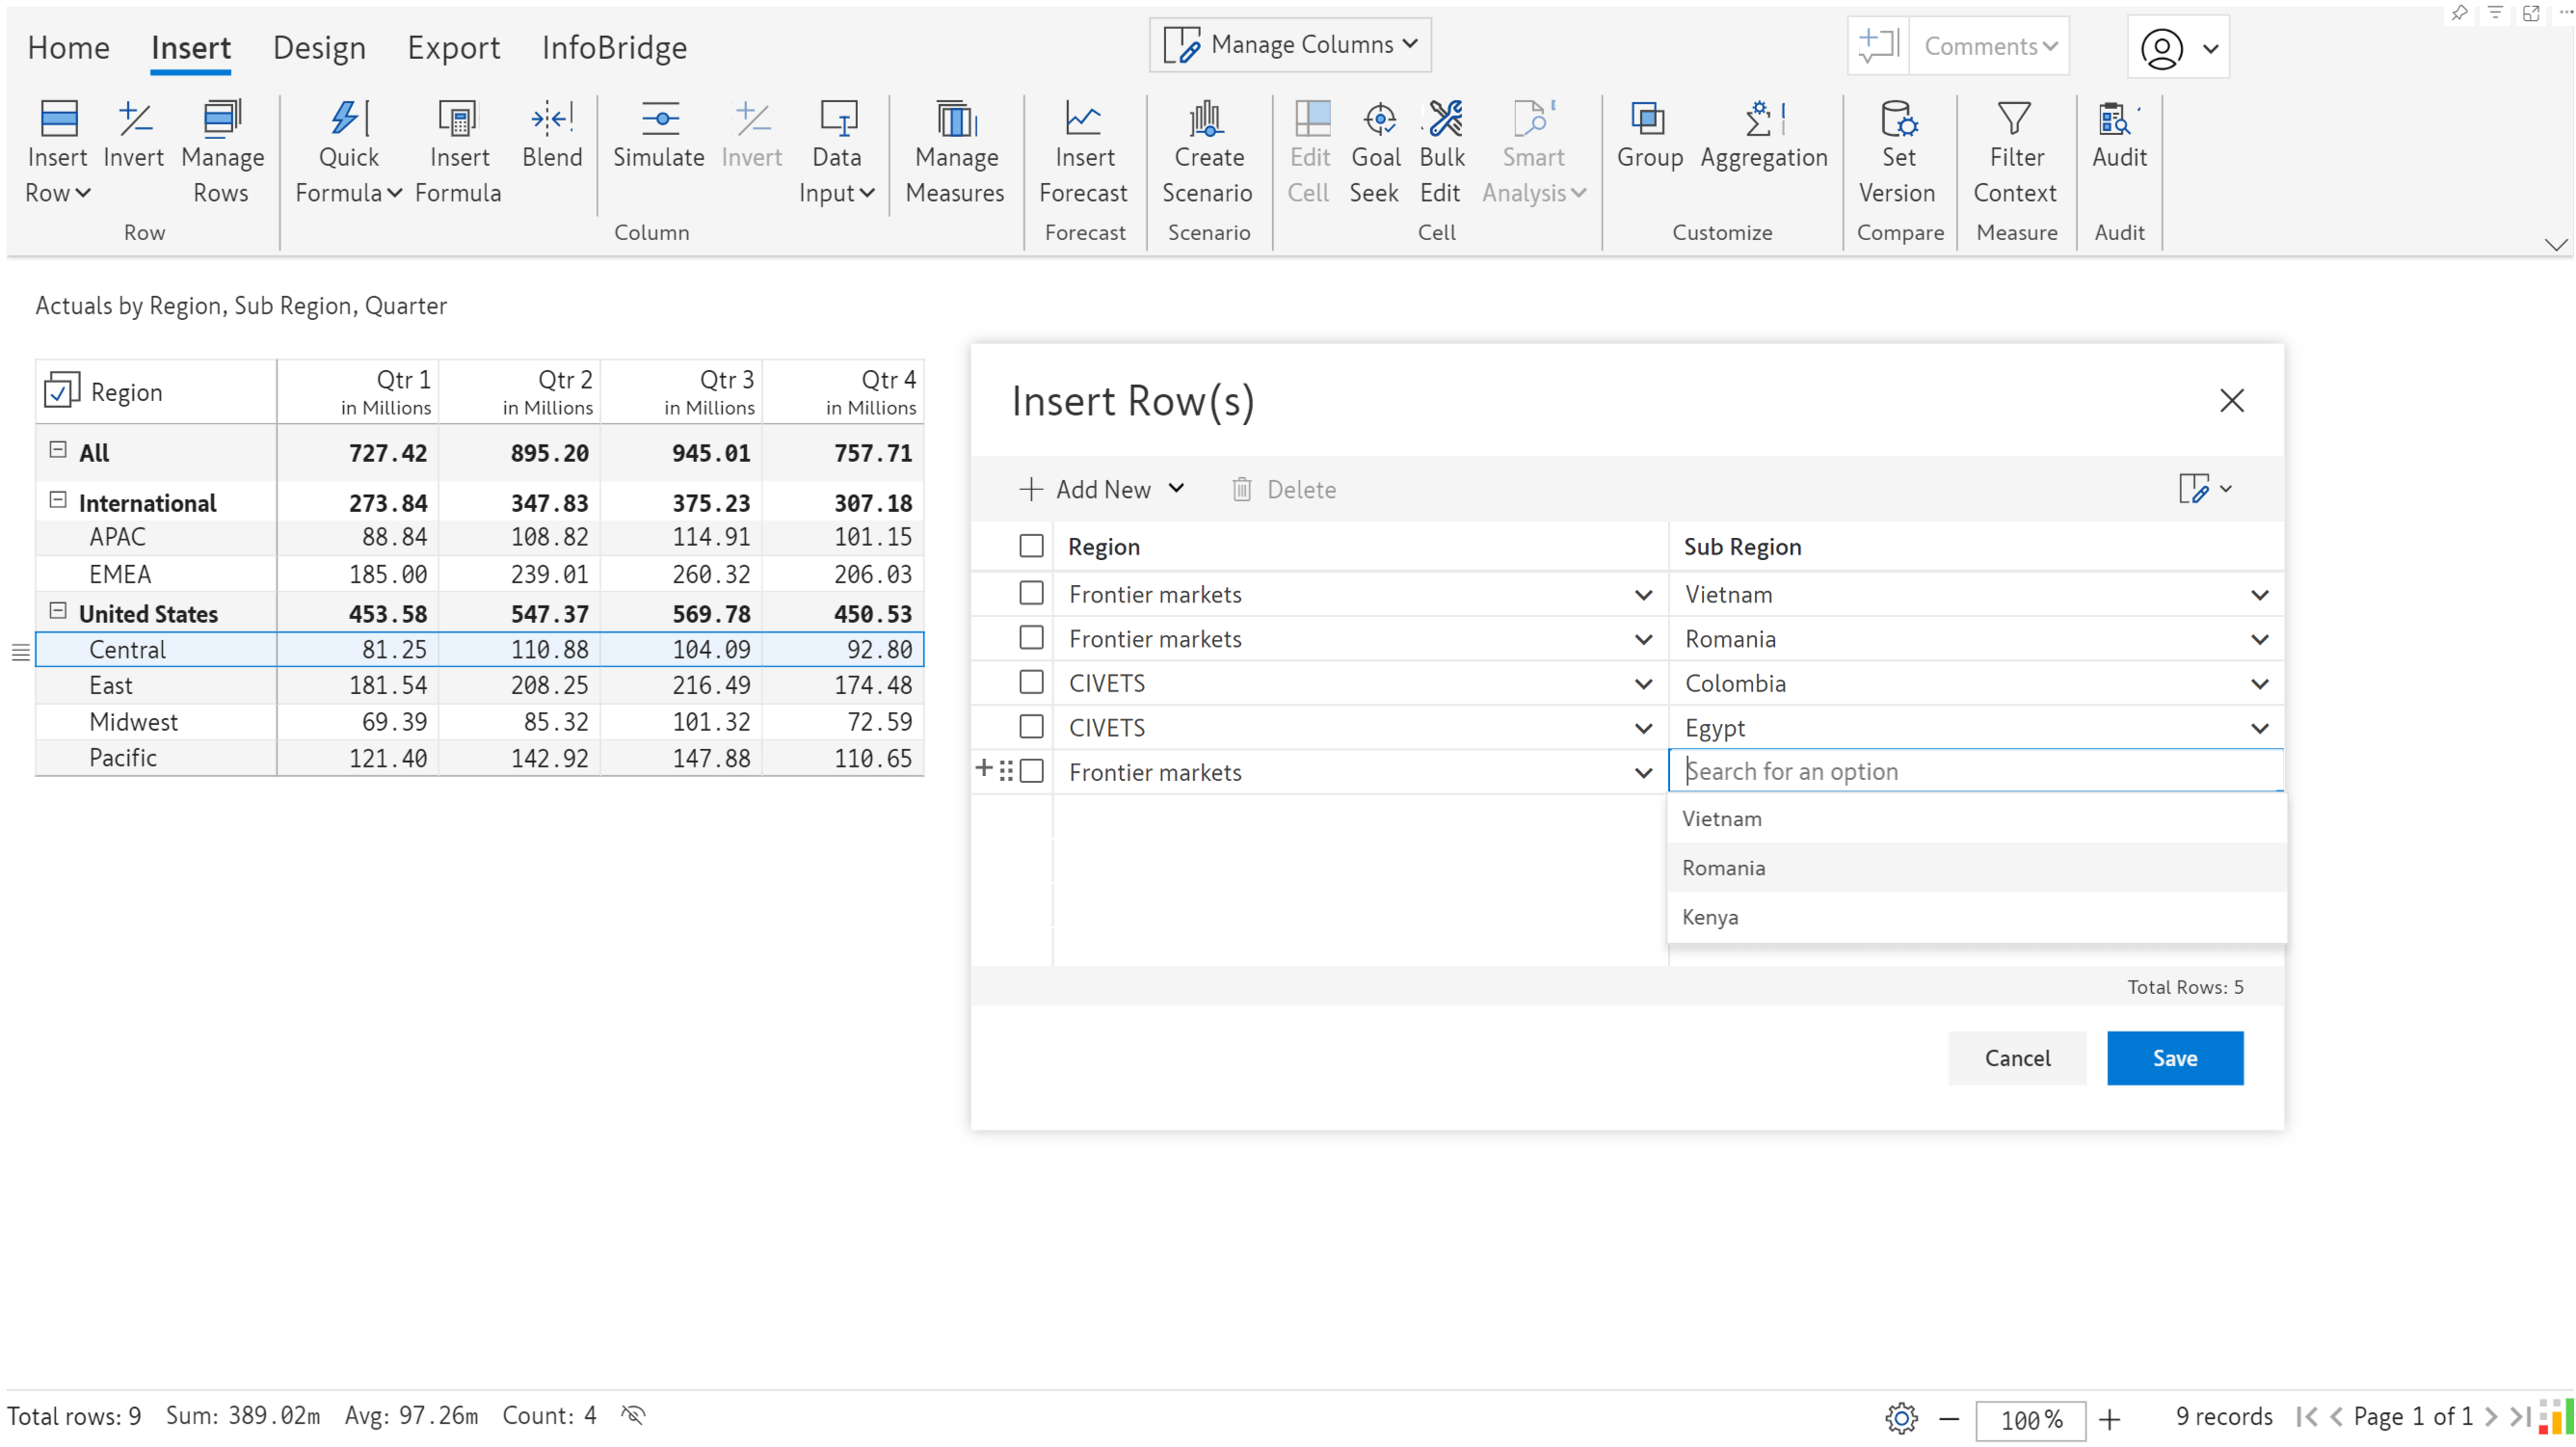
When you upload data from Excel, you need to explicitly map the field in Excel to the visual row dimension. You will also need to set up filters to map subcategories under the respective parent category. In this case, when you select Frontier markets as the Region, you will only want to see Vietnam, Romania, and Kenya in the Sub Region dropdown. Similarly, when you select CIVETS as the Region, you would only want to see Colombia, Indonesia, Vietnam, Egypt, etc, and none of the countries that fall under the Frontier markets sector.
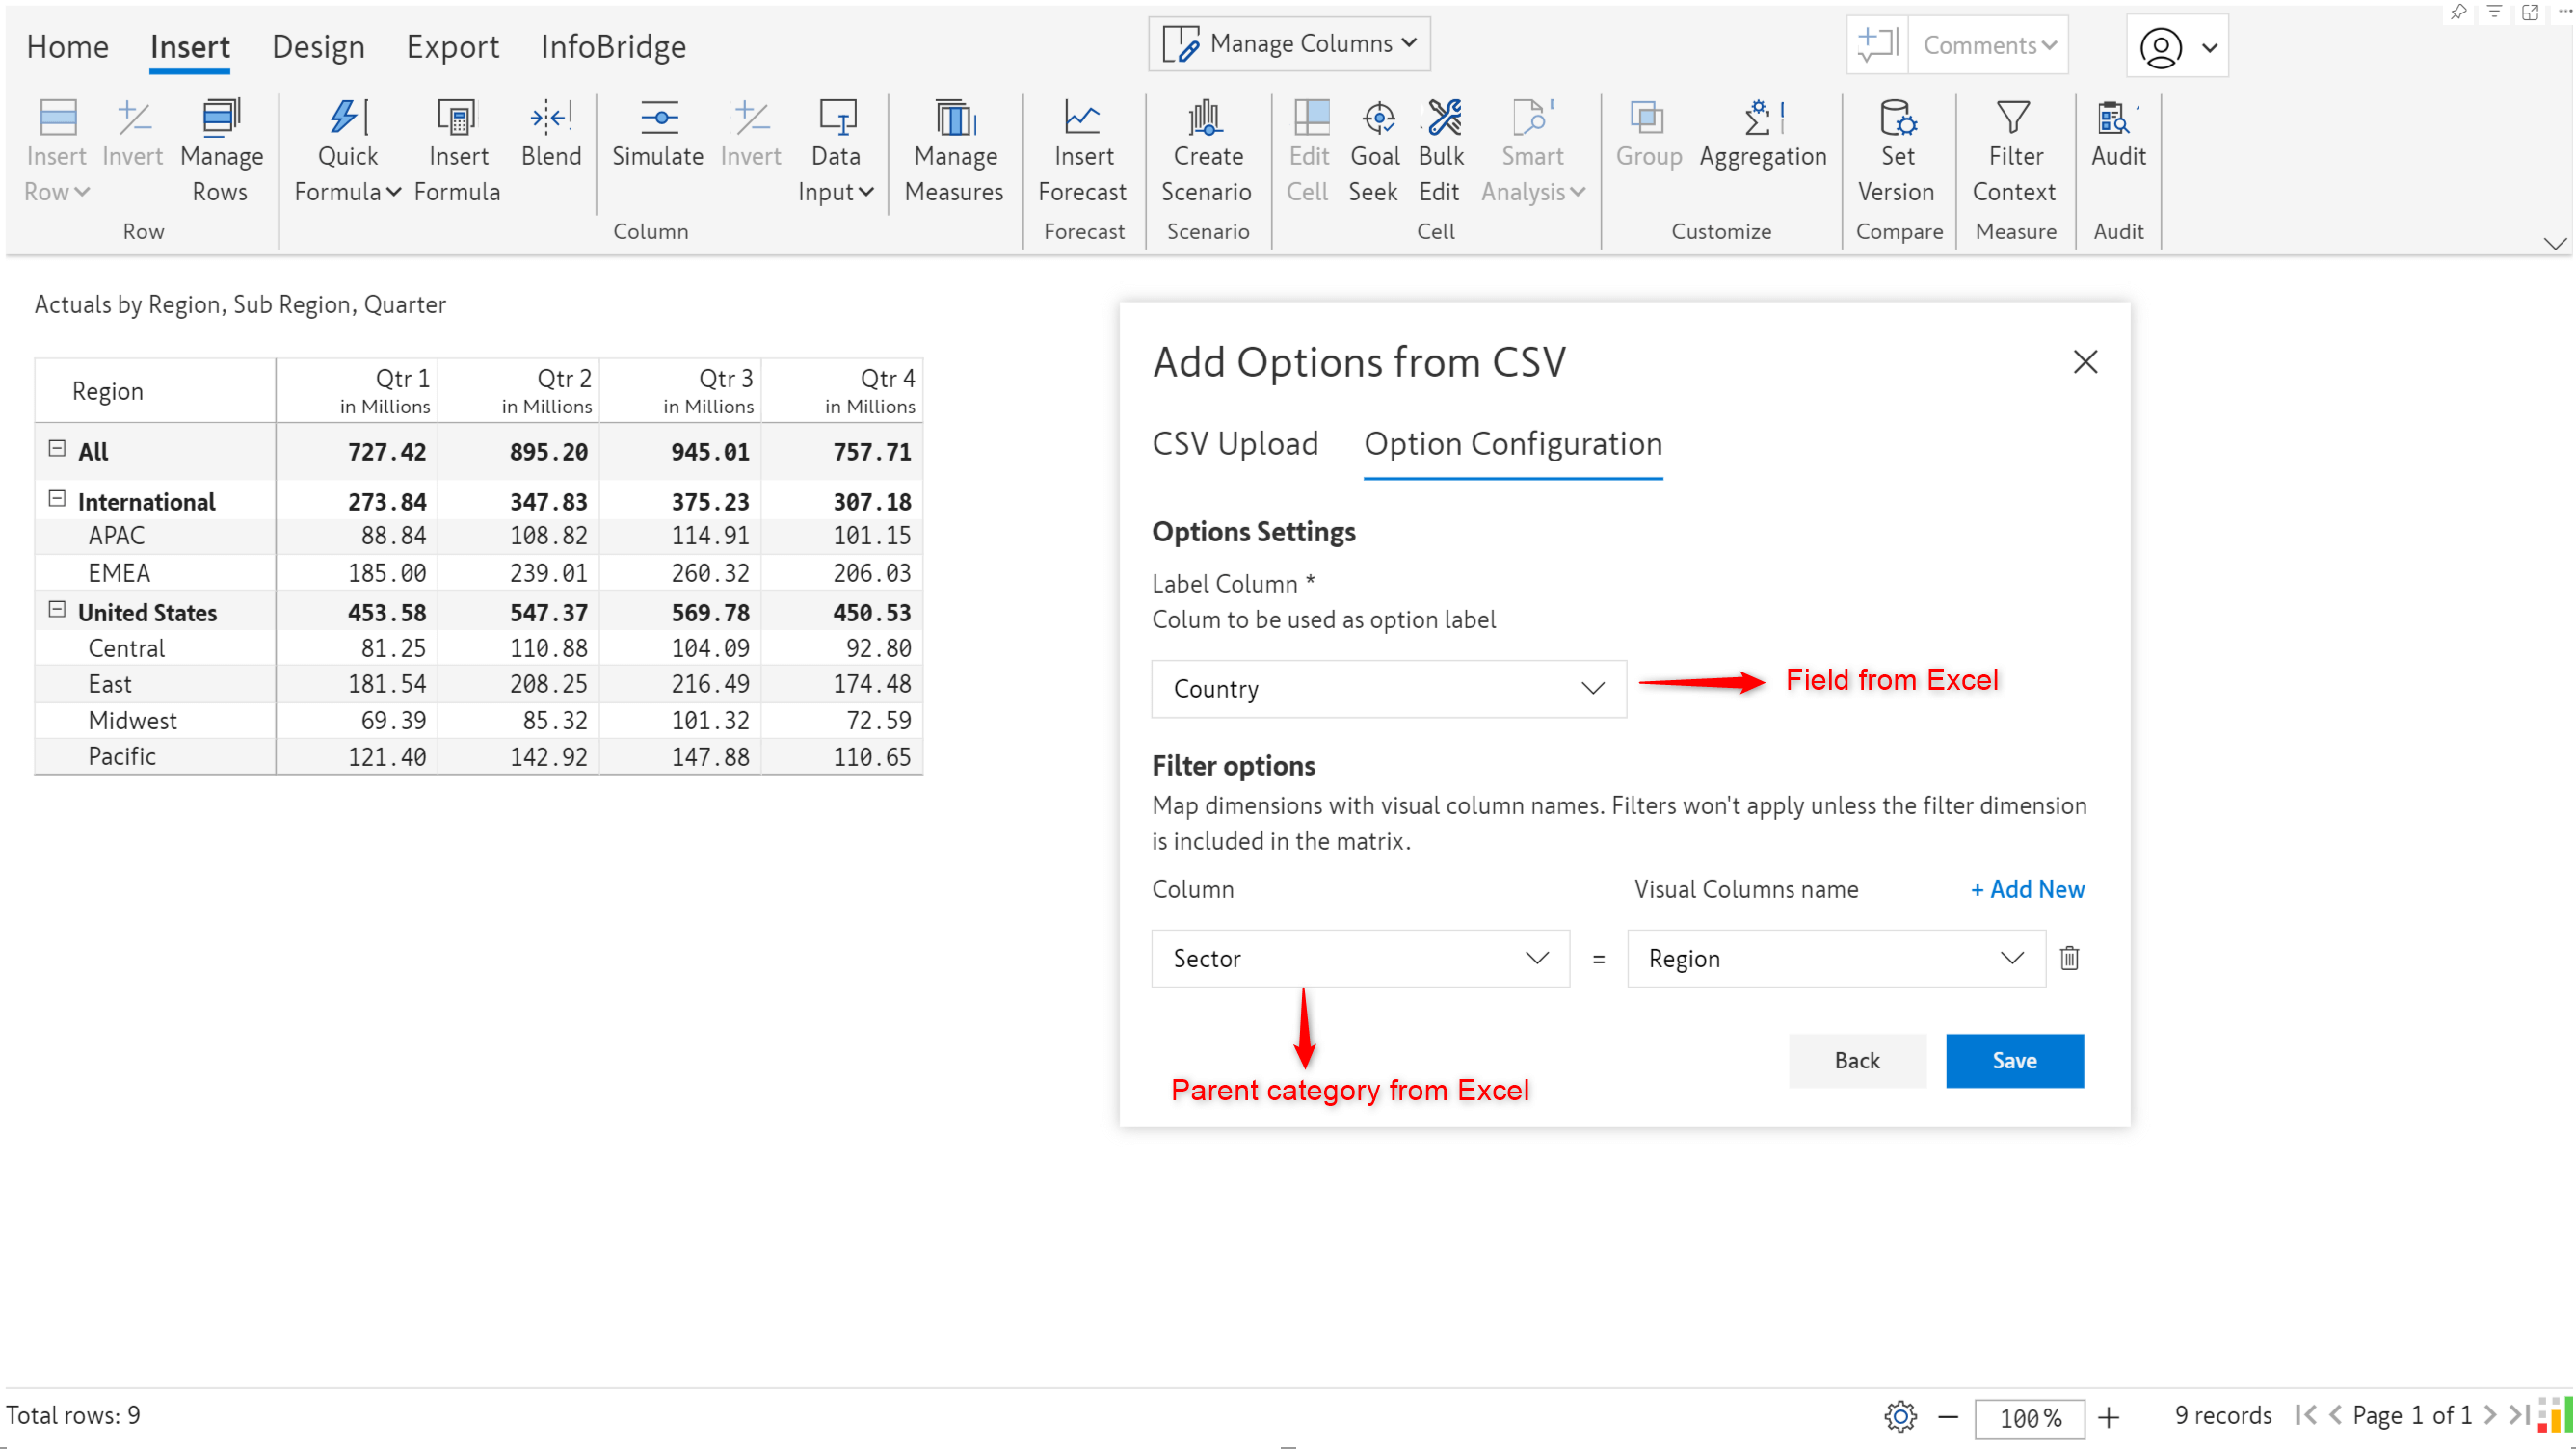
Once the field mapping and filters (optional) are set up, you will be able to see the data from the Excel sheet in the Insert rows interface.
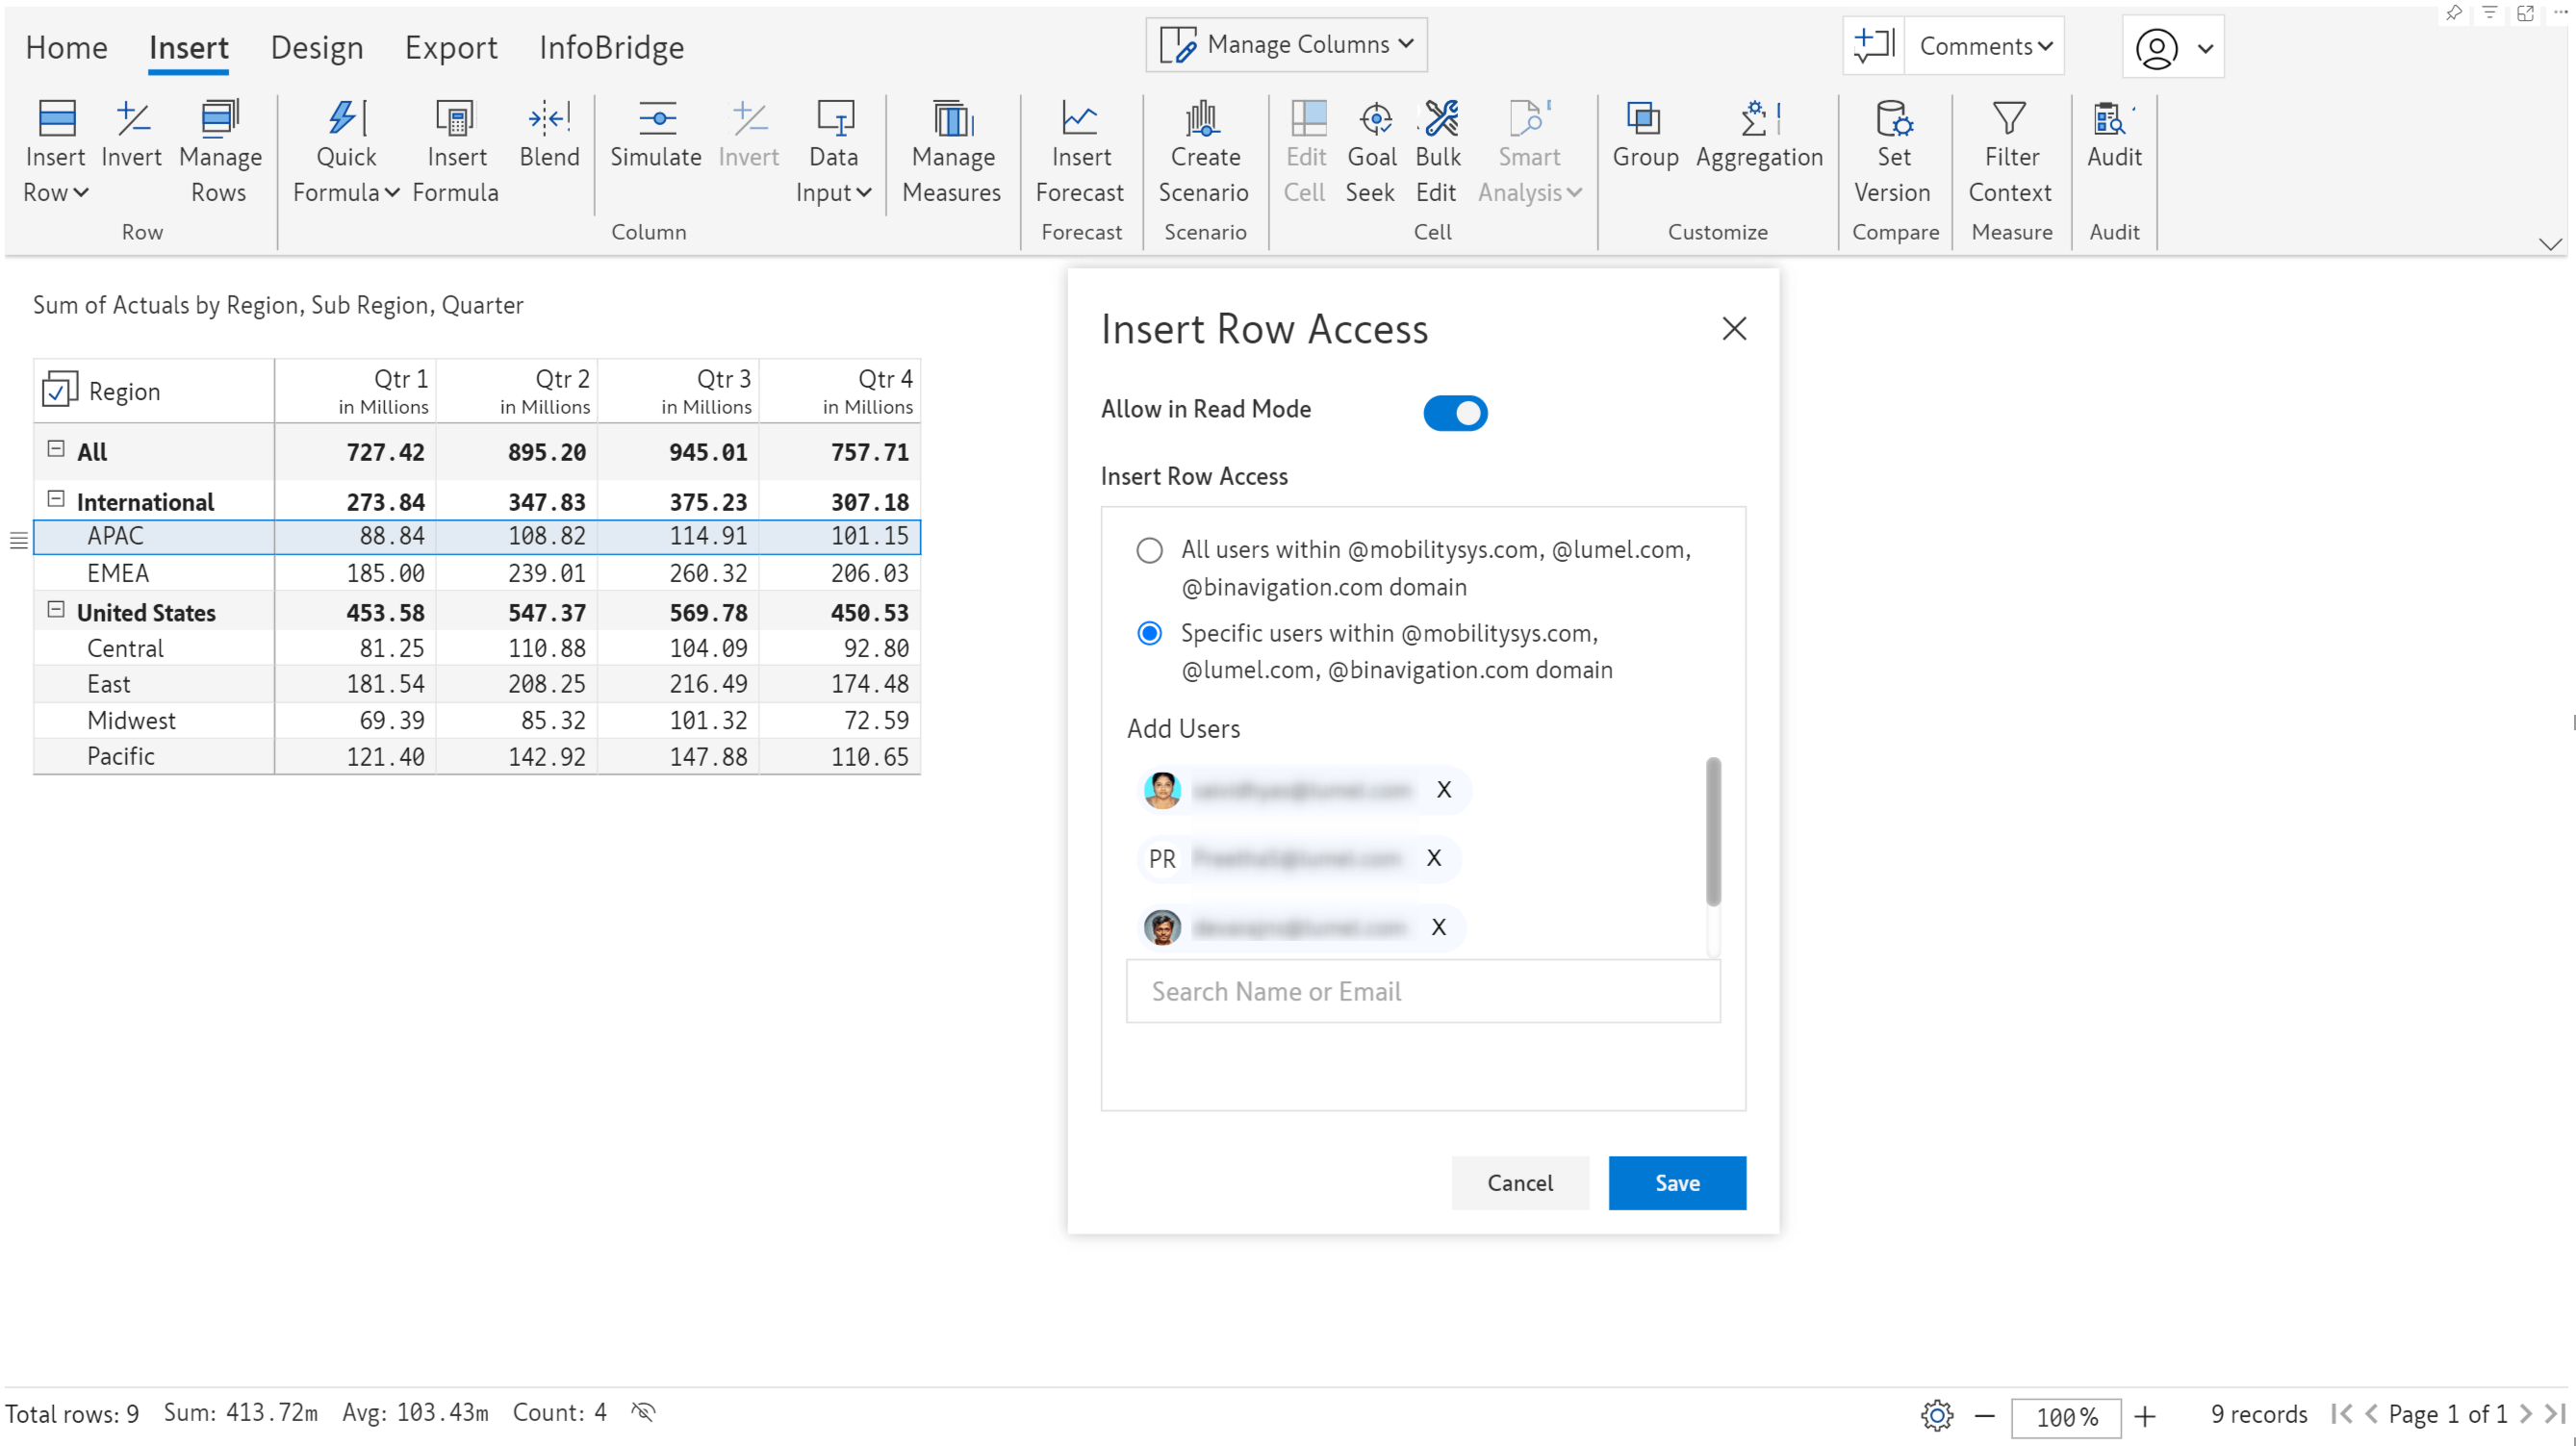
You can explicitly set permissions for users to insert rows in read mode. You have options to restrict all users, allow all users, or authorize specific users to insert rows. Navigate to Insert >Manage Rows >Settings > Insert Row Access to set permissions.
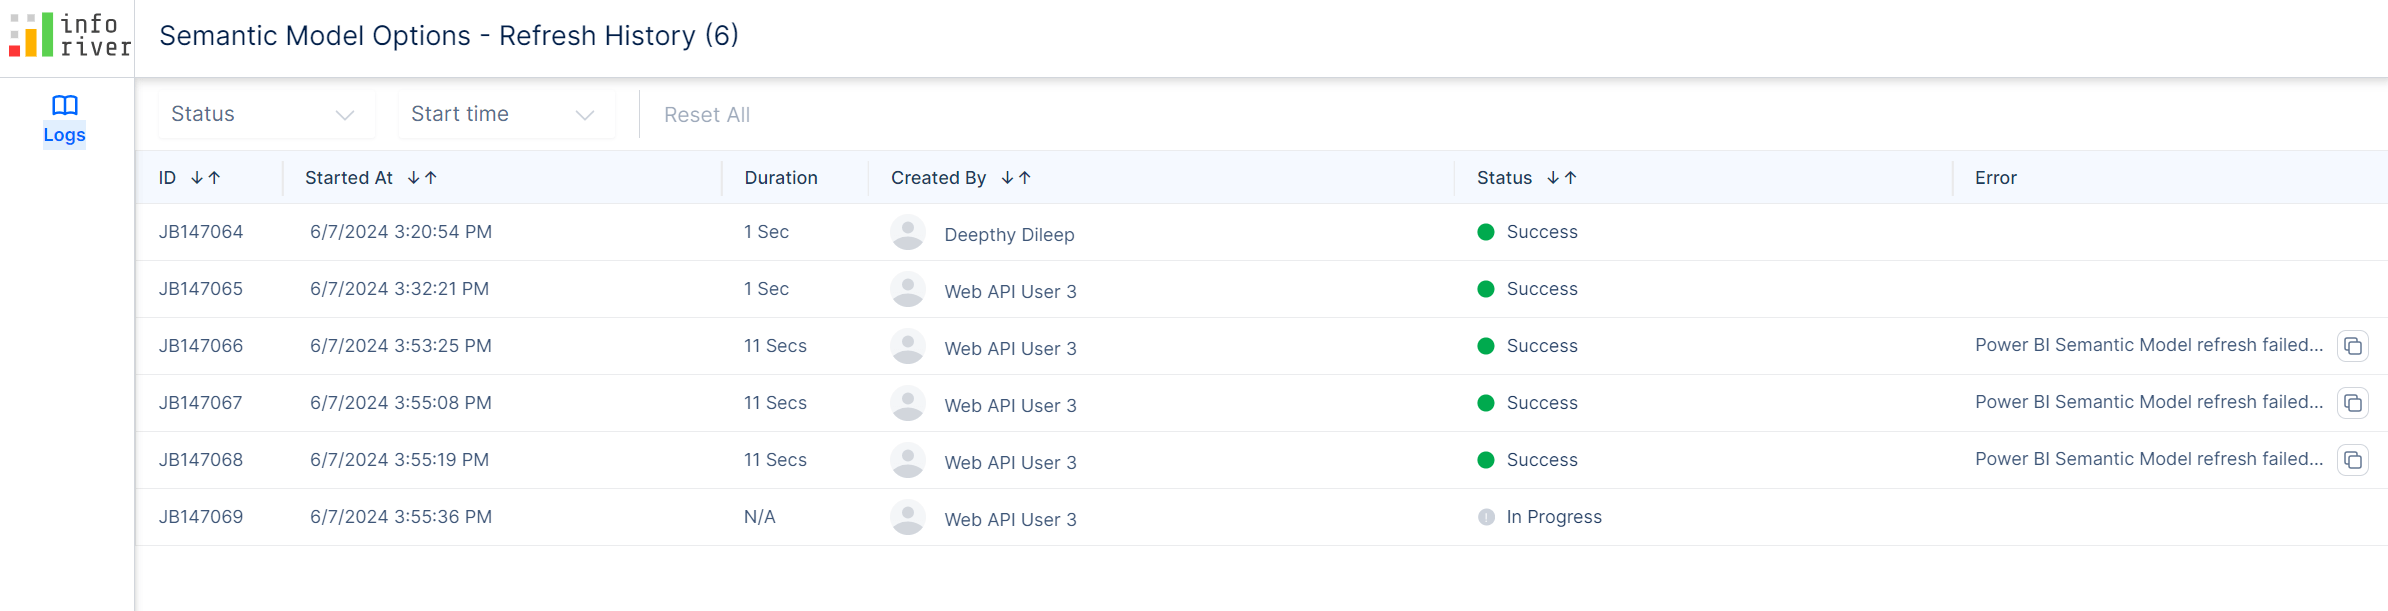
In the previous release, we introduced the capability to generate authorization tokens and perform ad-hoc semantic model refreshes. When you source the options for a single select or multi-select from a semantic model, Inforiver provides the refresh link in the options section. You can easily copy and use it to trigger refreshes.
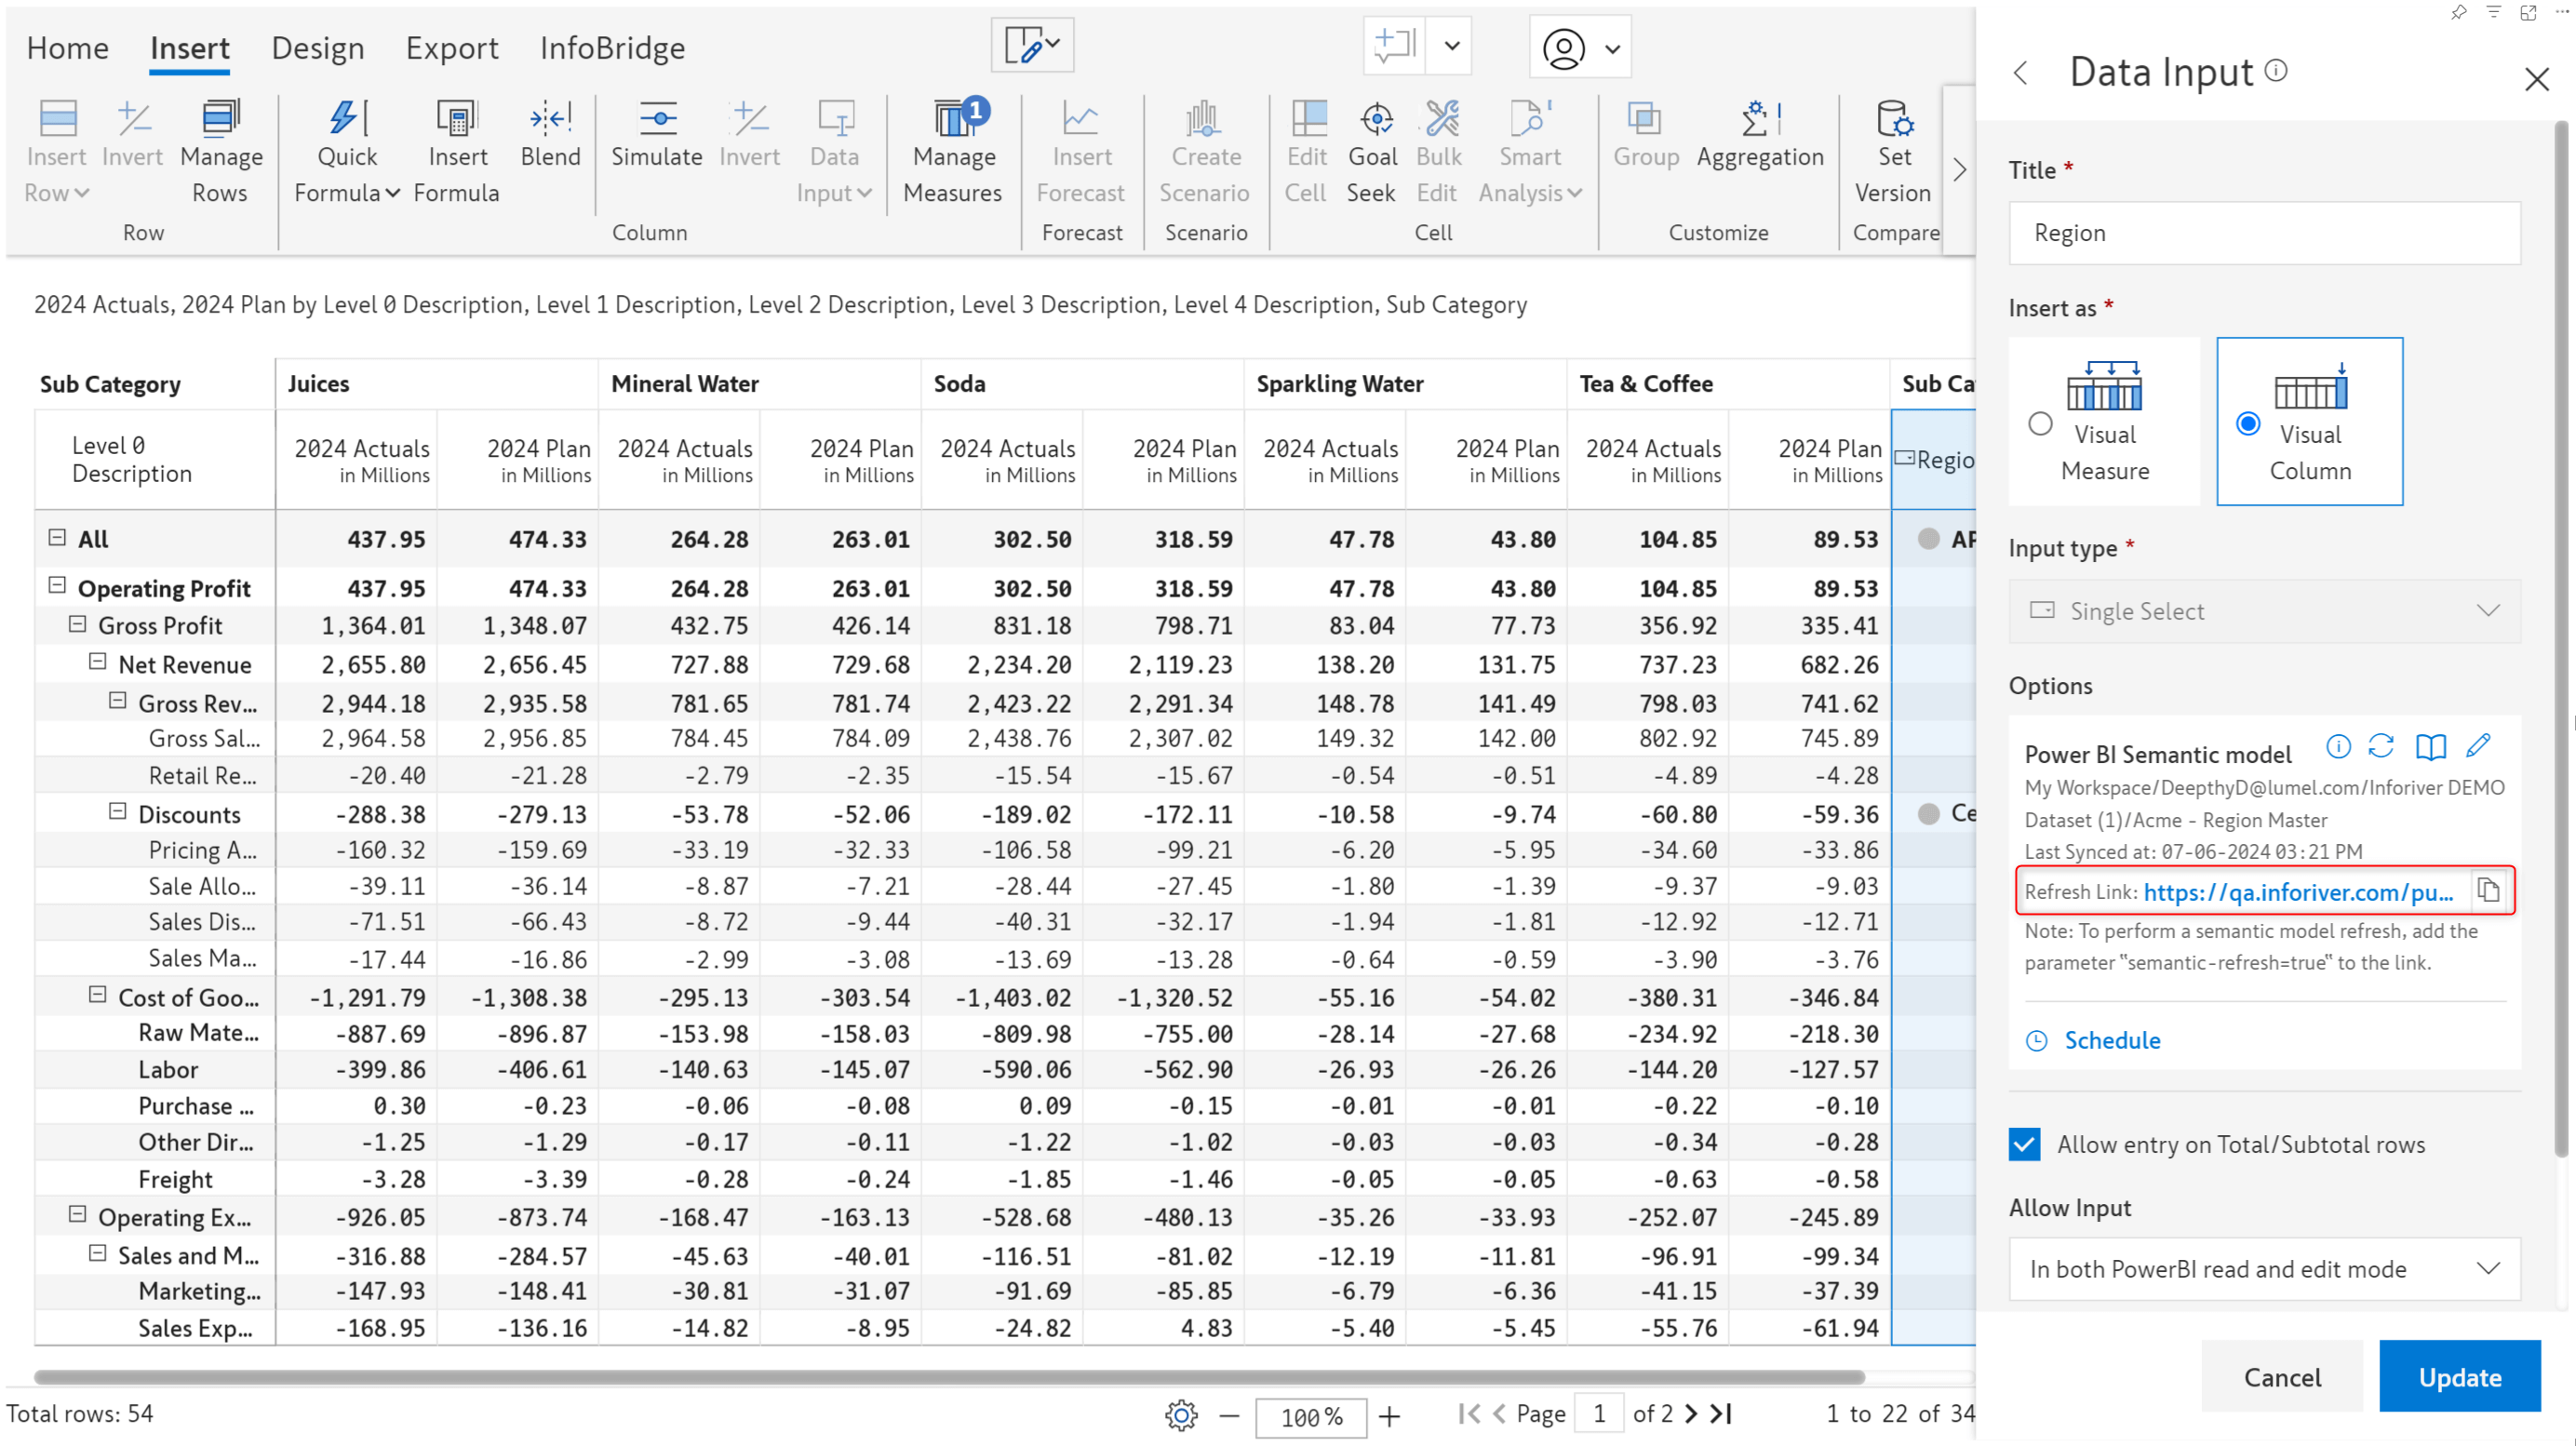
You can click on the log icon to view the history and details of semantic model data refreshes.
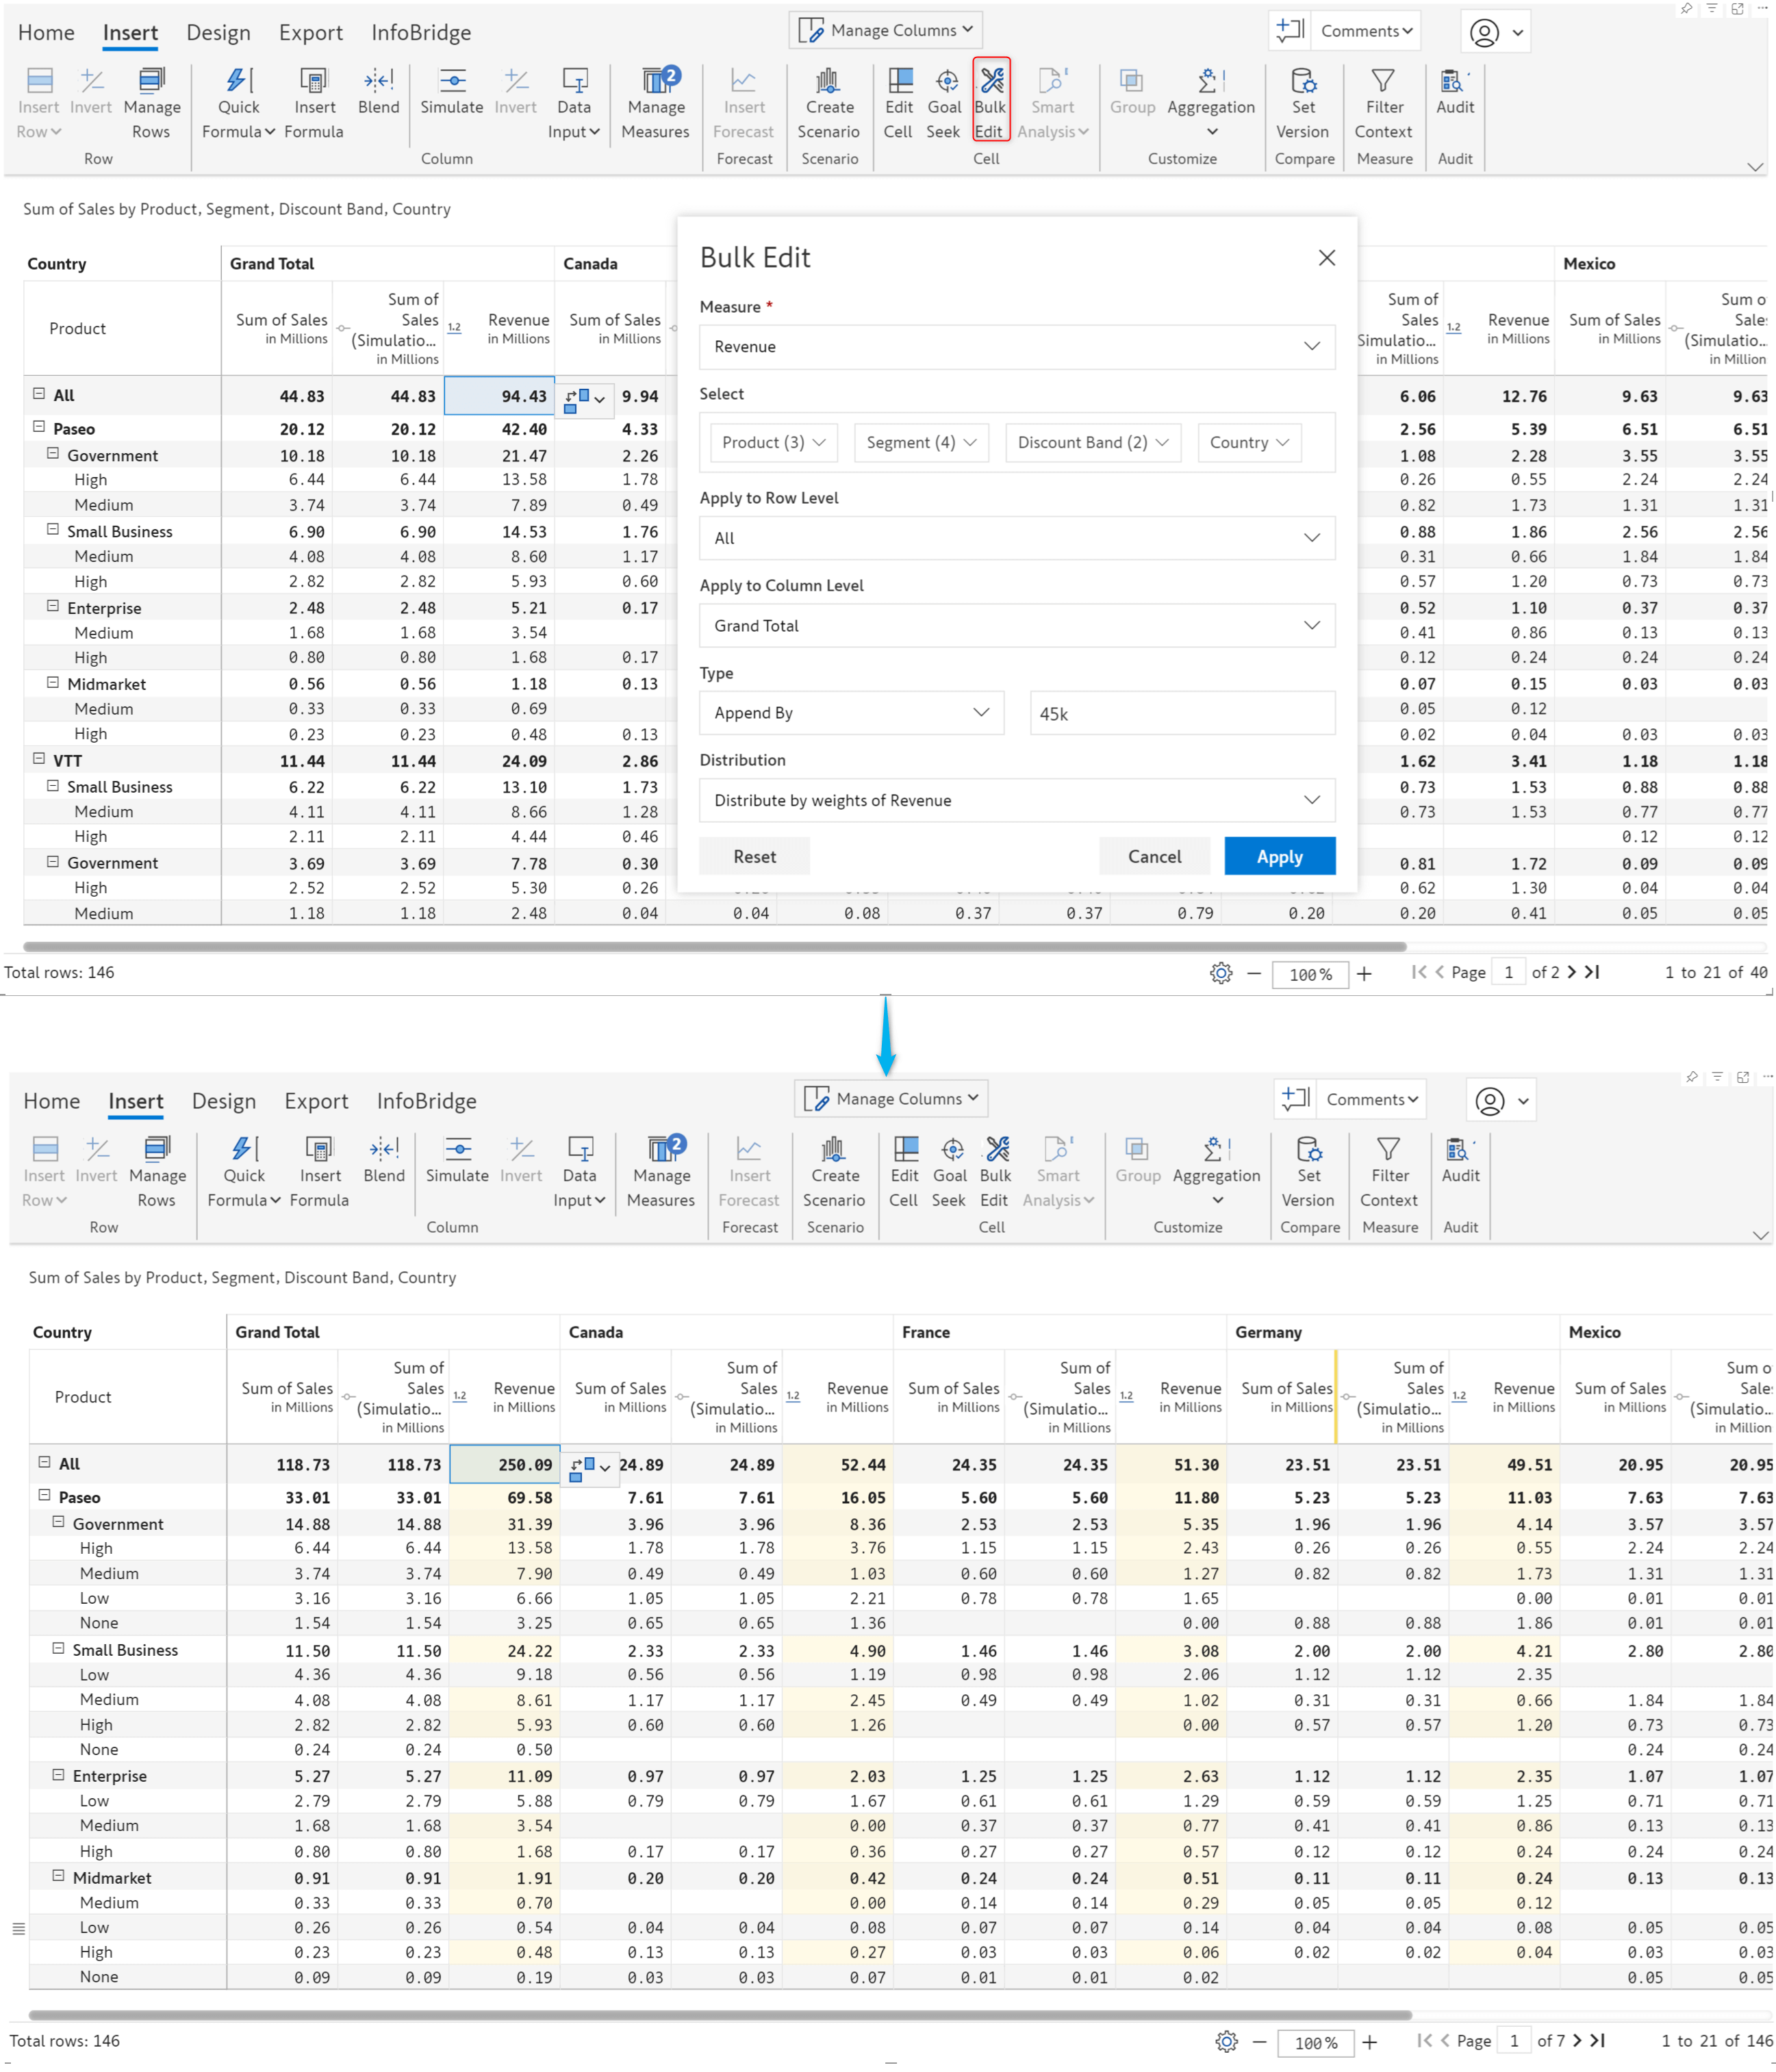
In financial reporting, costs or revenues may need to be allocated across multiple fields, or during the budgeting/forecasting process, the same values may need to be distributed across different fields. In the latest version, we are rolling out the Bulk Edit feature:
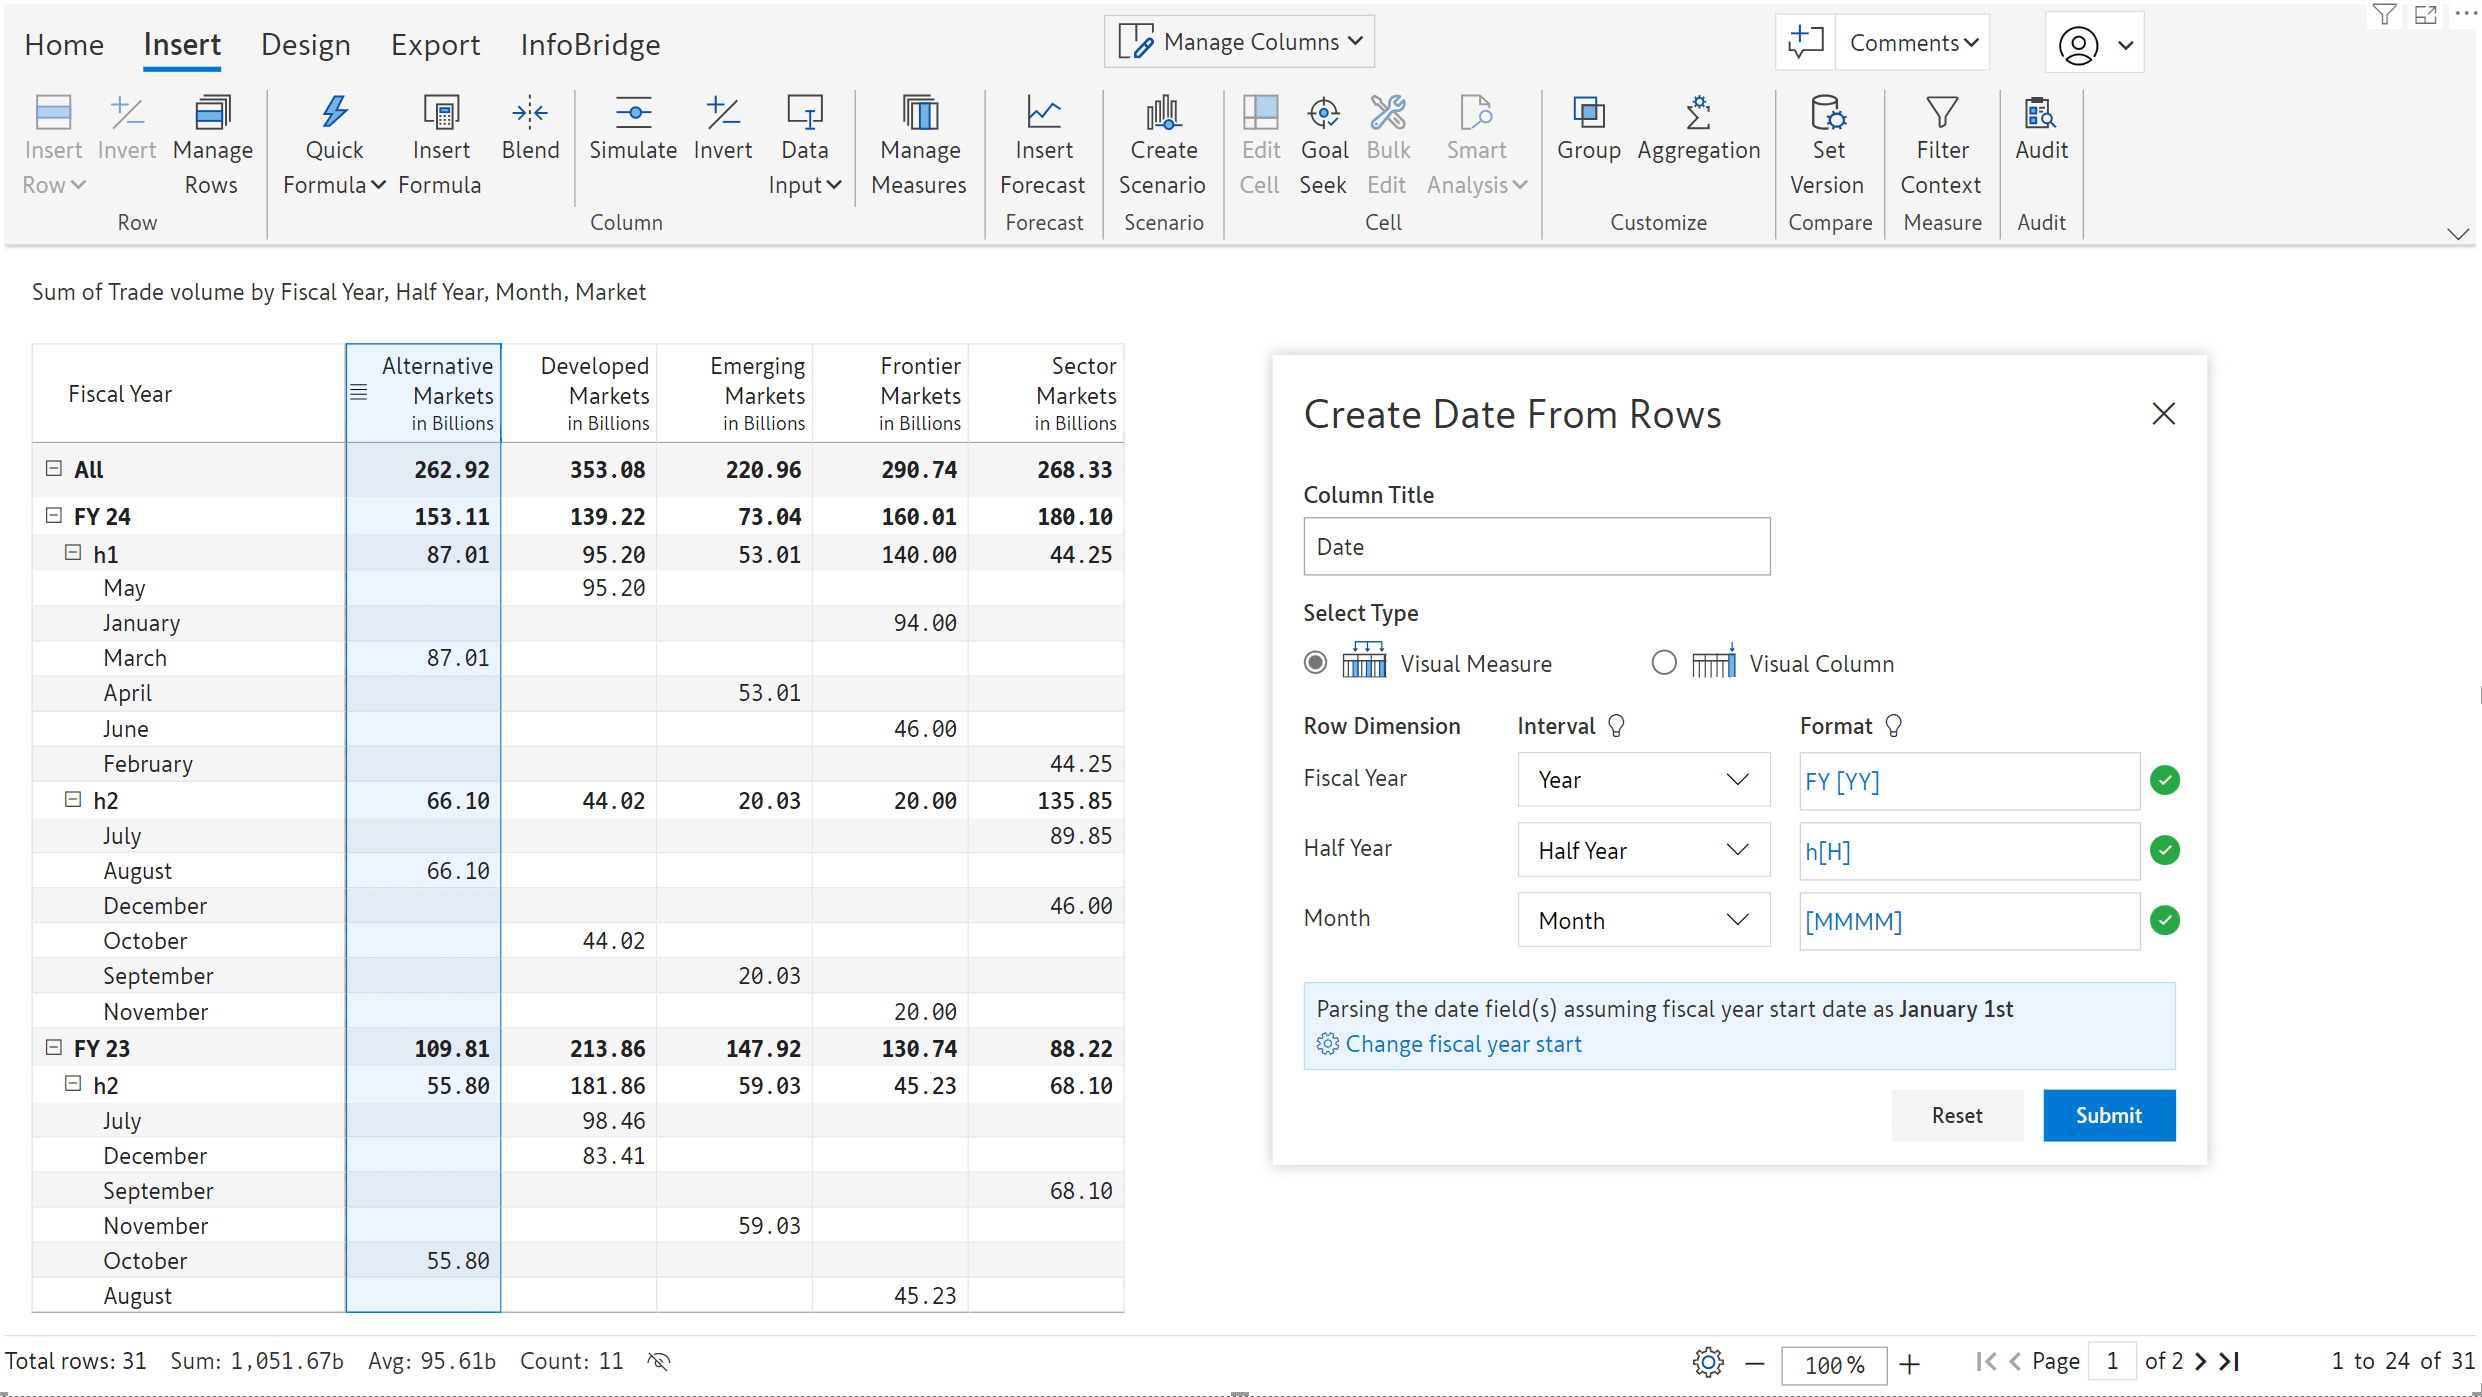
Inforiver allows you to input date values. When you have a date dimension in your rows, you can initialize data input dates with row dimension values. Navigate to Data Input > Date > Copy from rows to initialize. Even non-Power BI date formats are recognized in the latest version.
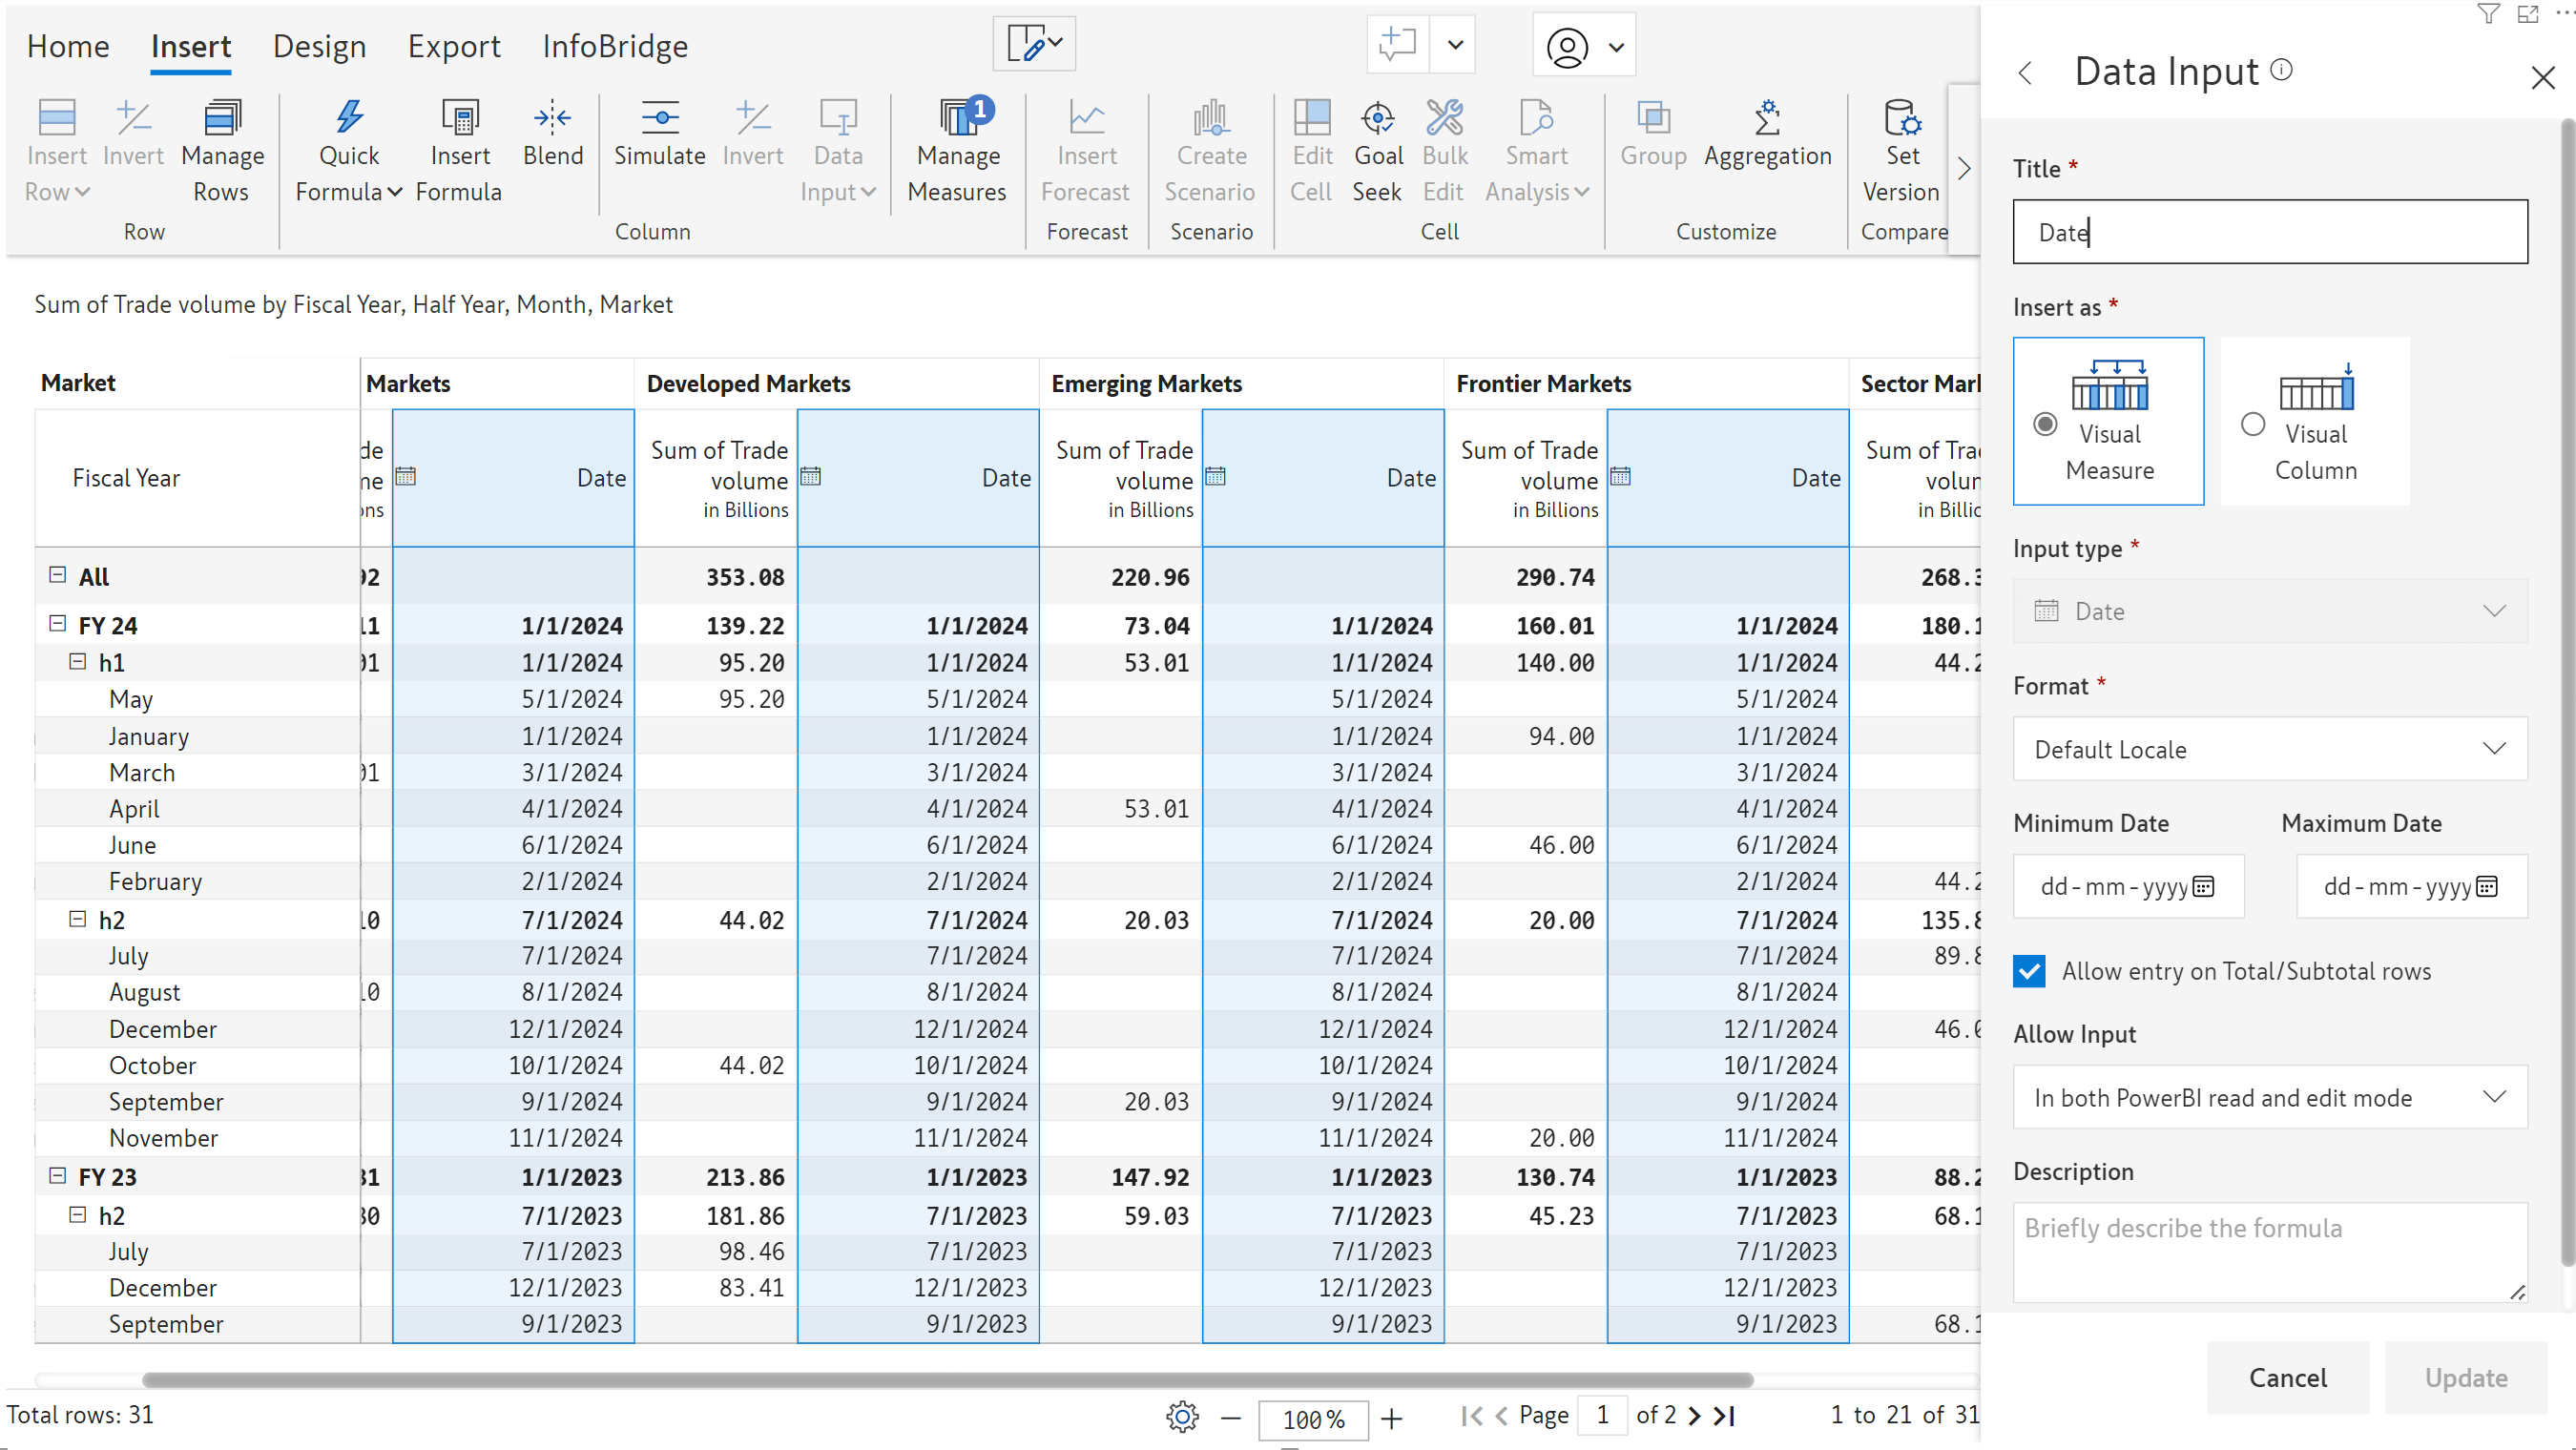
You can see how the values in the date data input fields have been initialized from the rows.
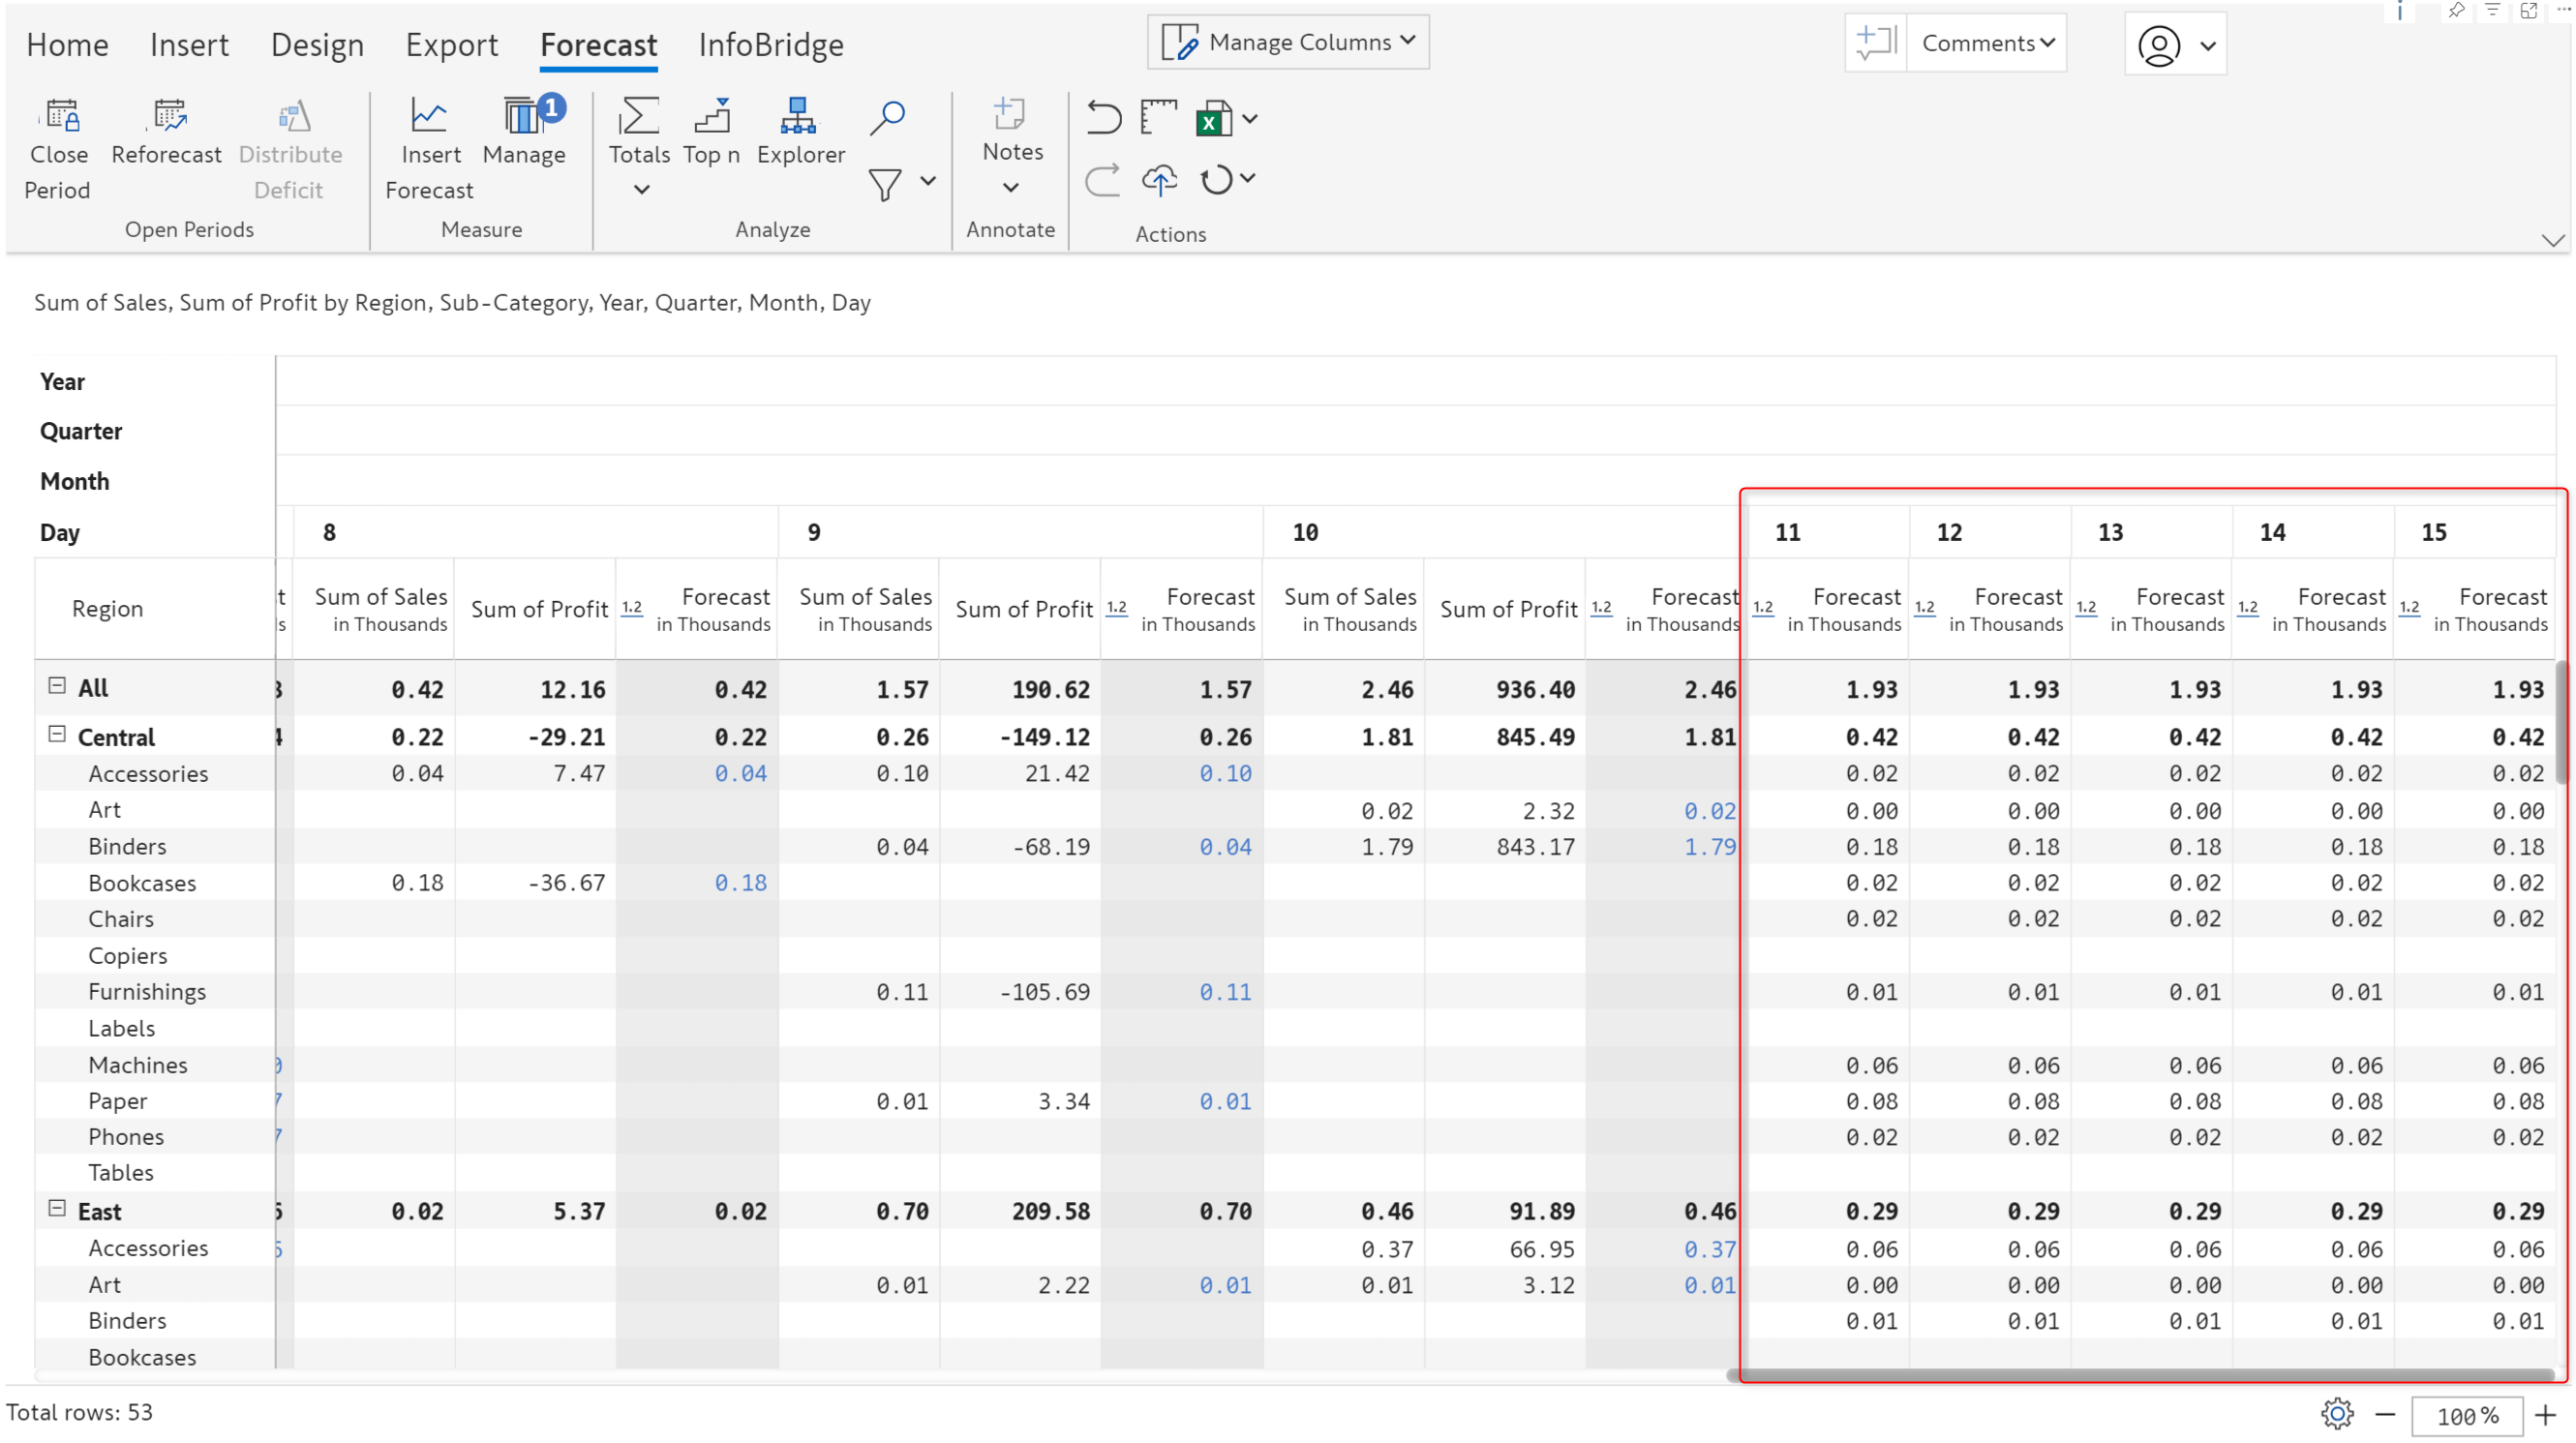
Inforiver’s robust forecasting feature provides a wide range of options for configuring and maintaining your forecasts. Inforiver already supports yearly, half-yearly, quarterly, and monthly forecasts. In the 3.0 release, we have added the capability to forecast for a specific number of days or generate weekly forecasts.
Daily forecasts
Daily forecasts can be applied to areas like
Let’s configure a sales forecast from March 11th to March 15th.
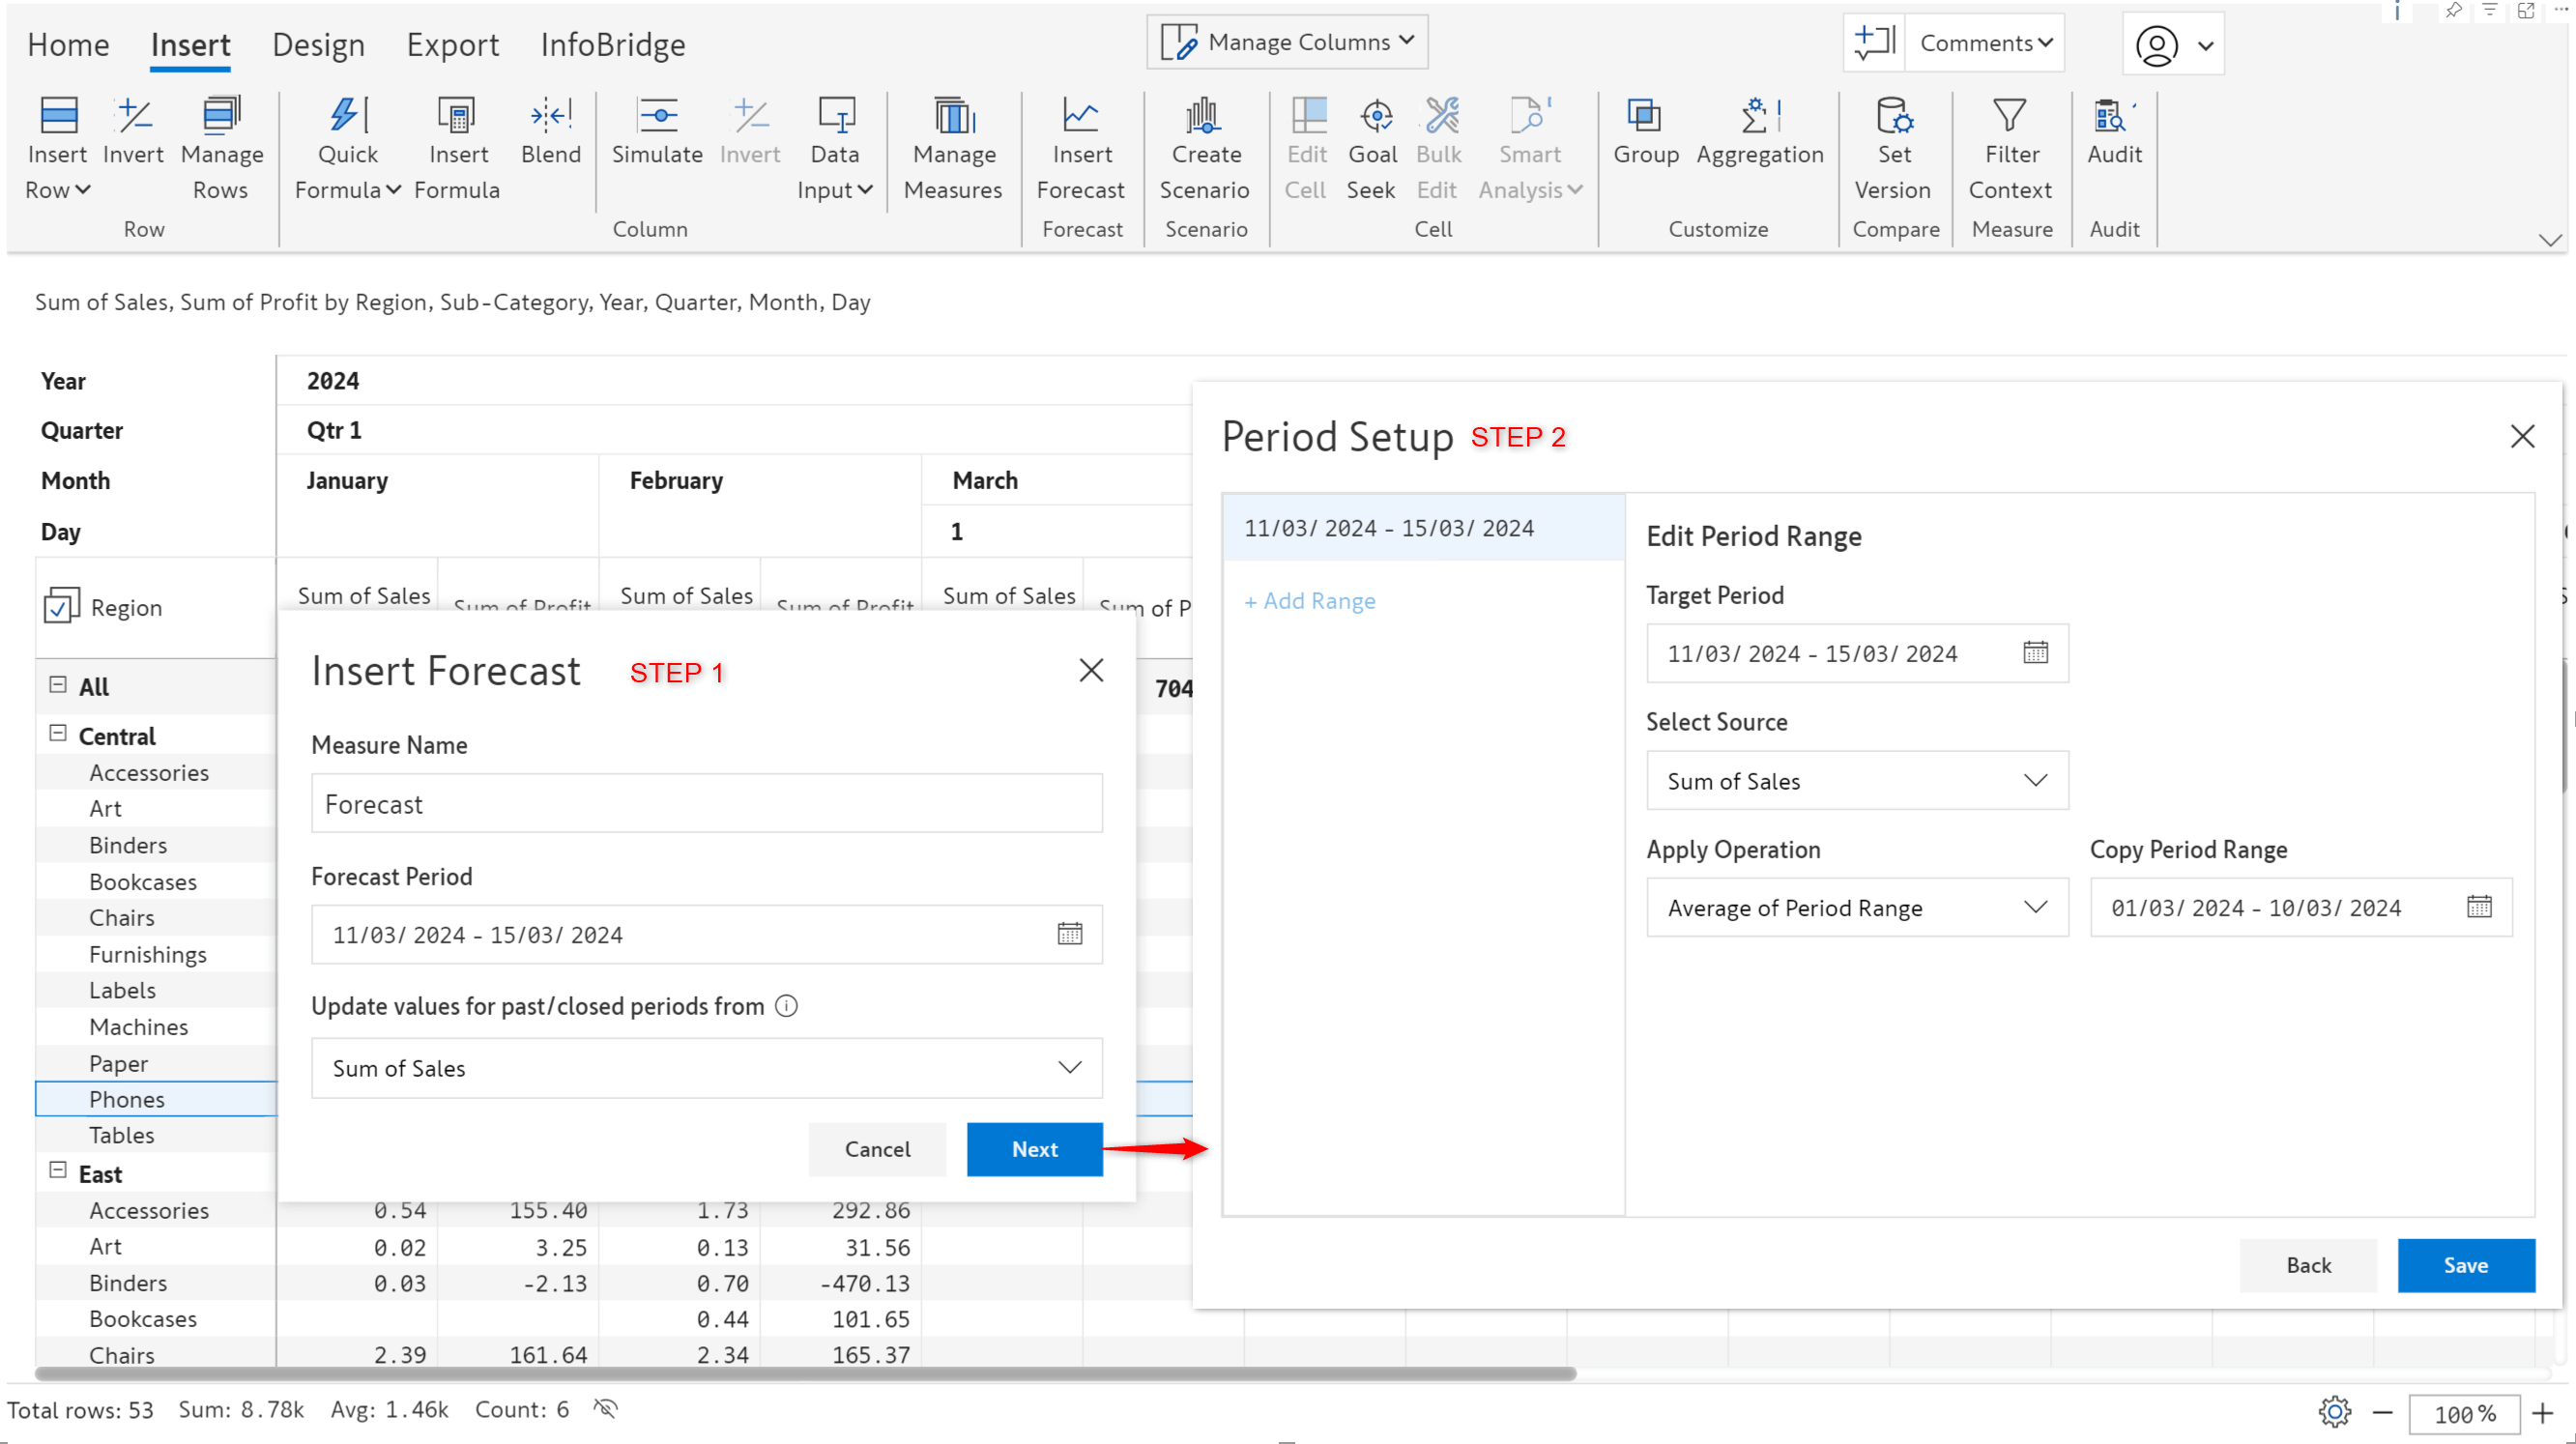
With Inforiver, you can create forecasts at different granularities (yearly/monthly/weekly/daily). We’ve generated a daily forecast for the specified number of days.
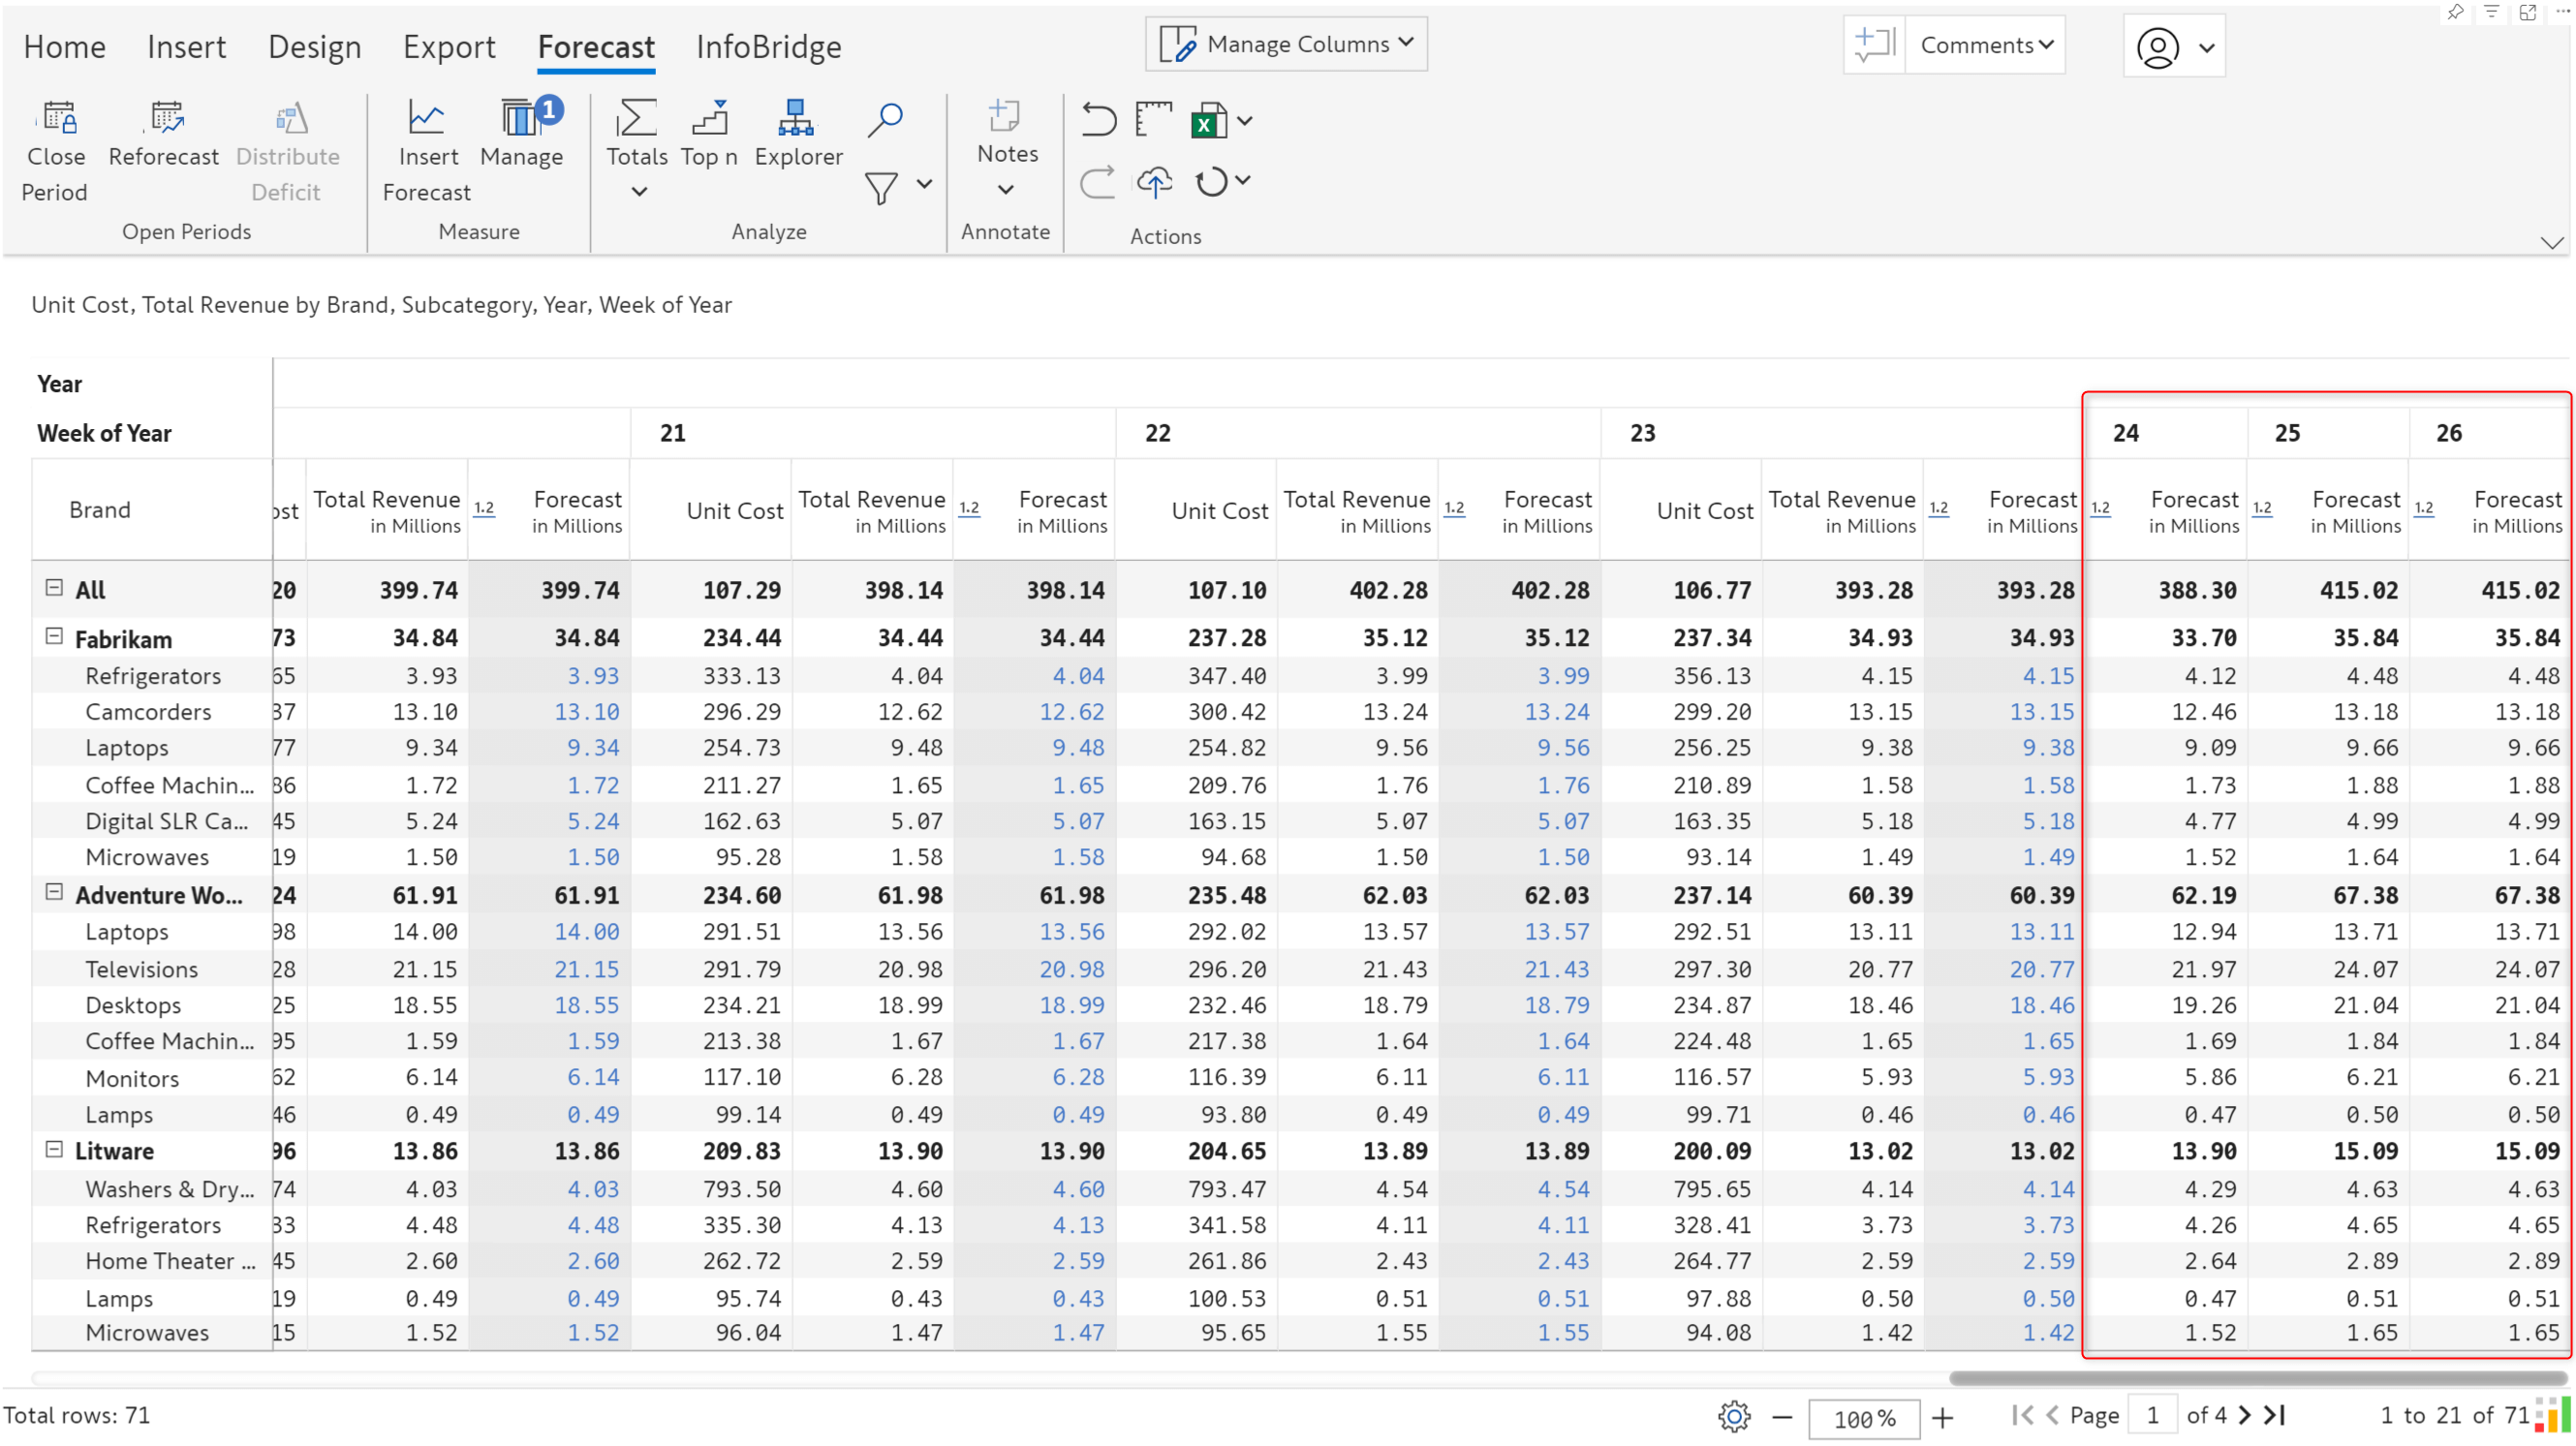
Weekly forecast
When you have weeks in your column dimension, Inforiver automatically detects the week numbers while configuring the forecast.
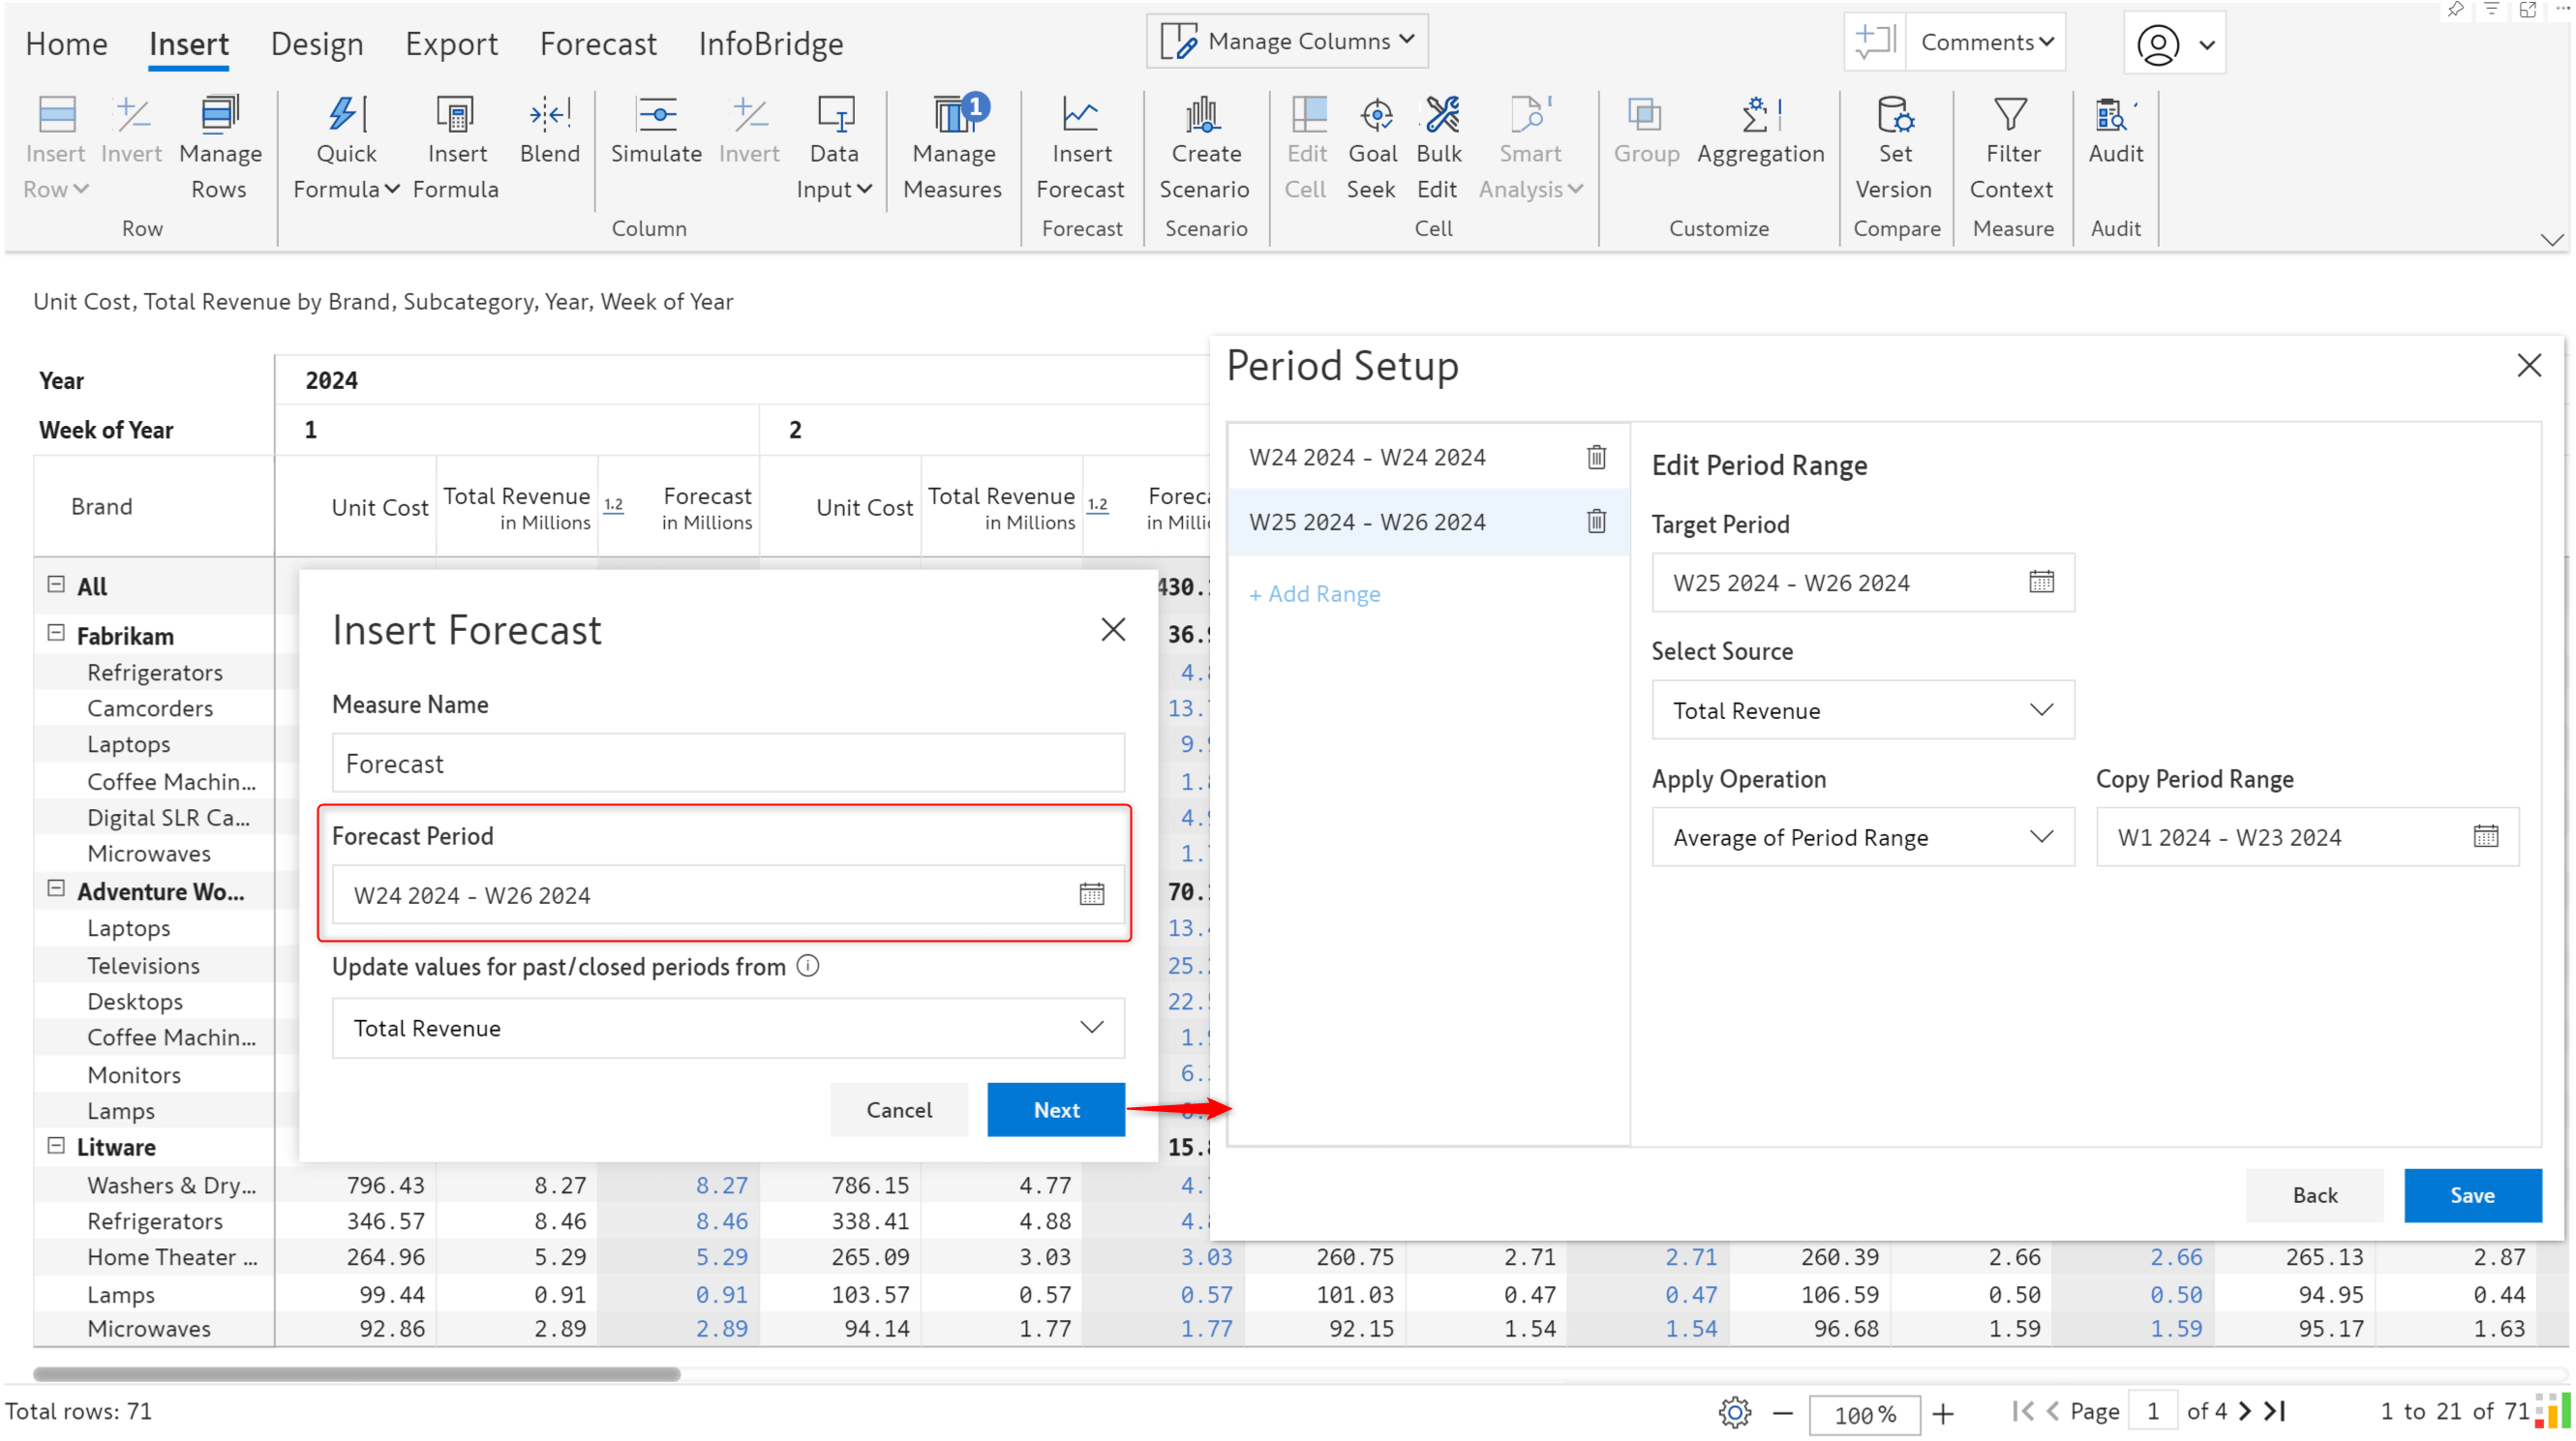
We’ve generated a weekly forecast for the last 3 weeks of June.
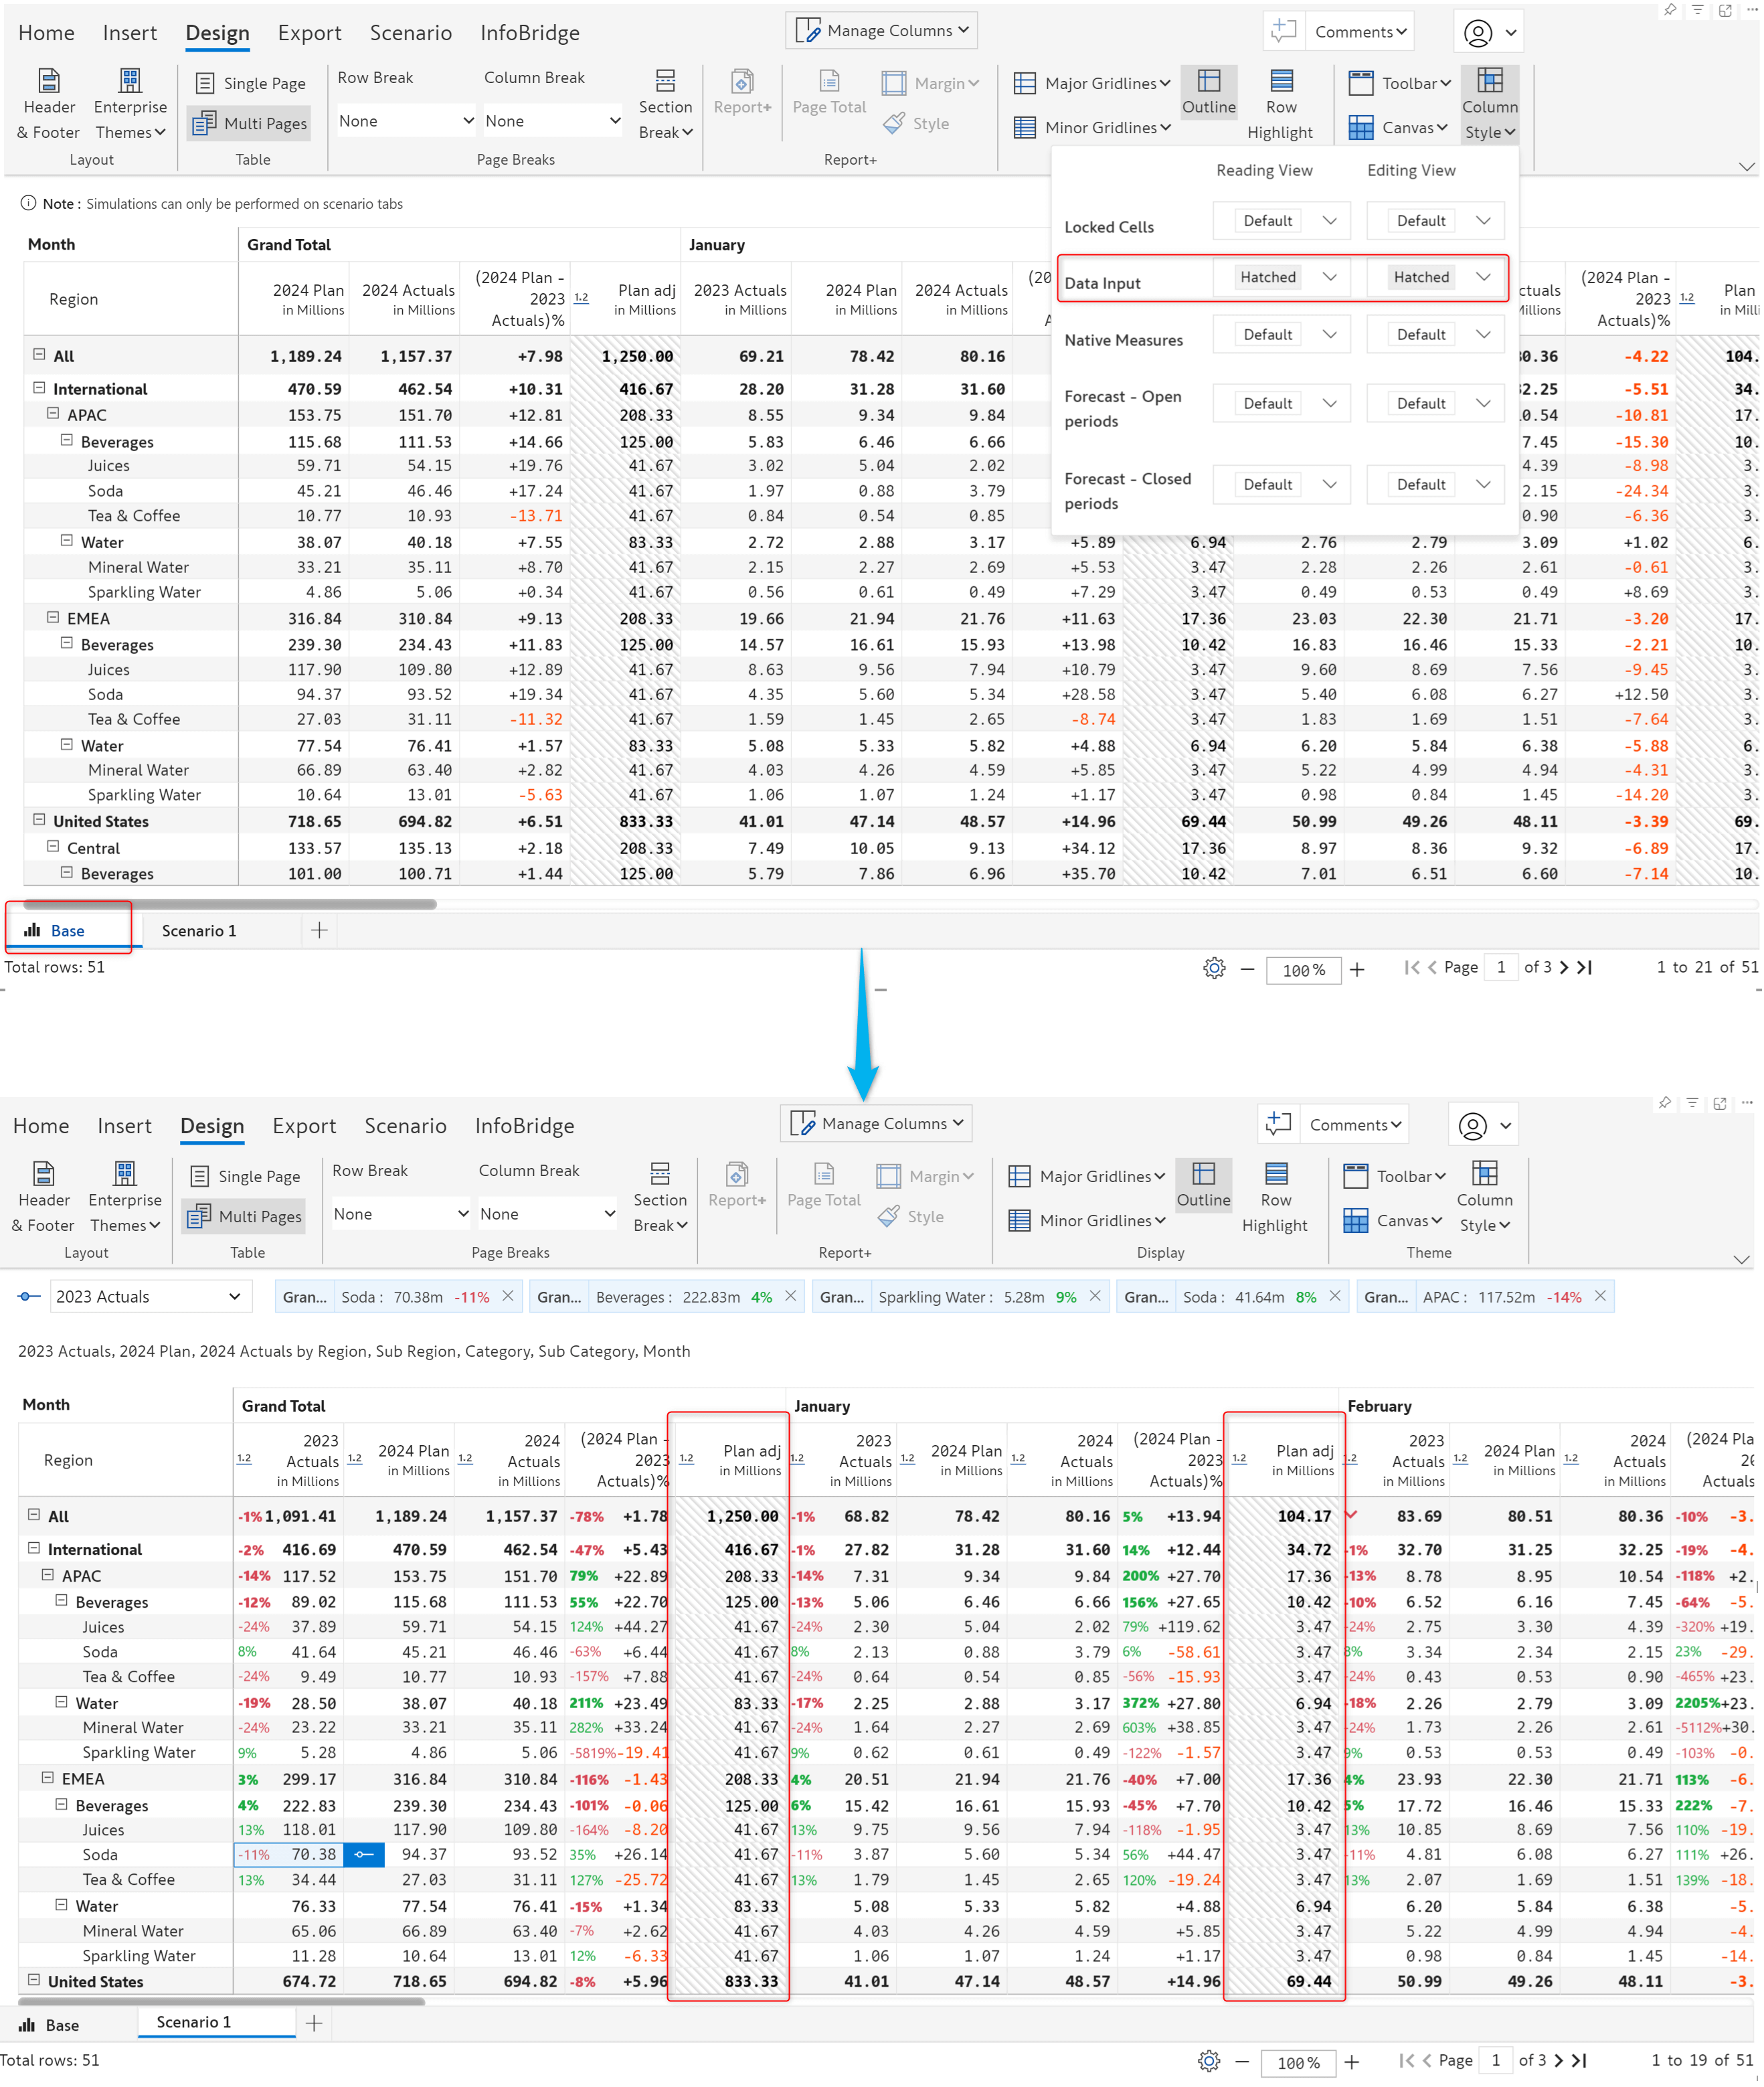
You can replicate the formatting applied to the base or to any scenario with the Copy-style formatting from scenario option. With this feature, you can maintain consistent formatting across all scenarios.
Click on the format painter icon to apply formatting from another scenario/base.
Column styles applied in the base will automatically be copied over to scenarios. In this report, the data input fields can be identified with the hatched style, which has been cascaded to the scenario as well.
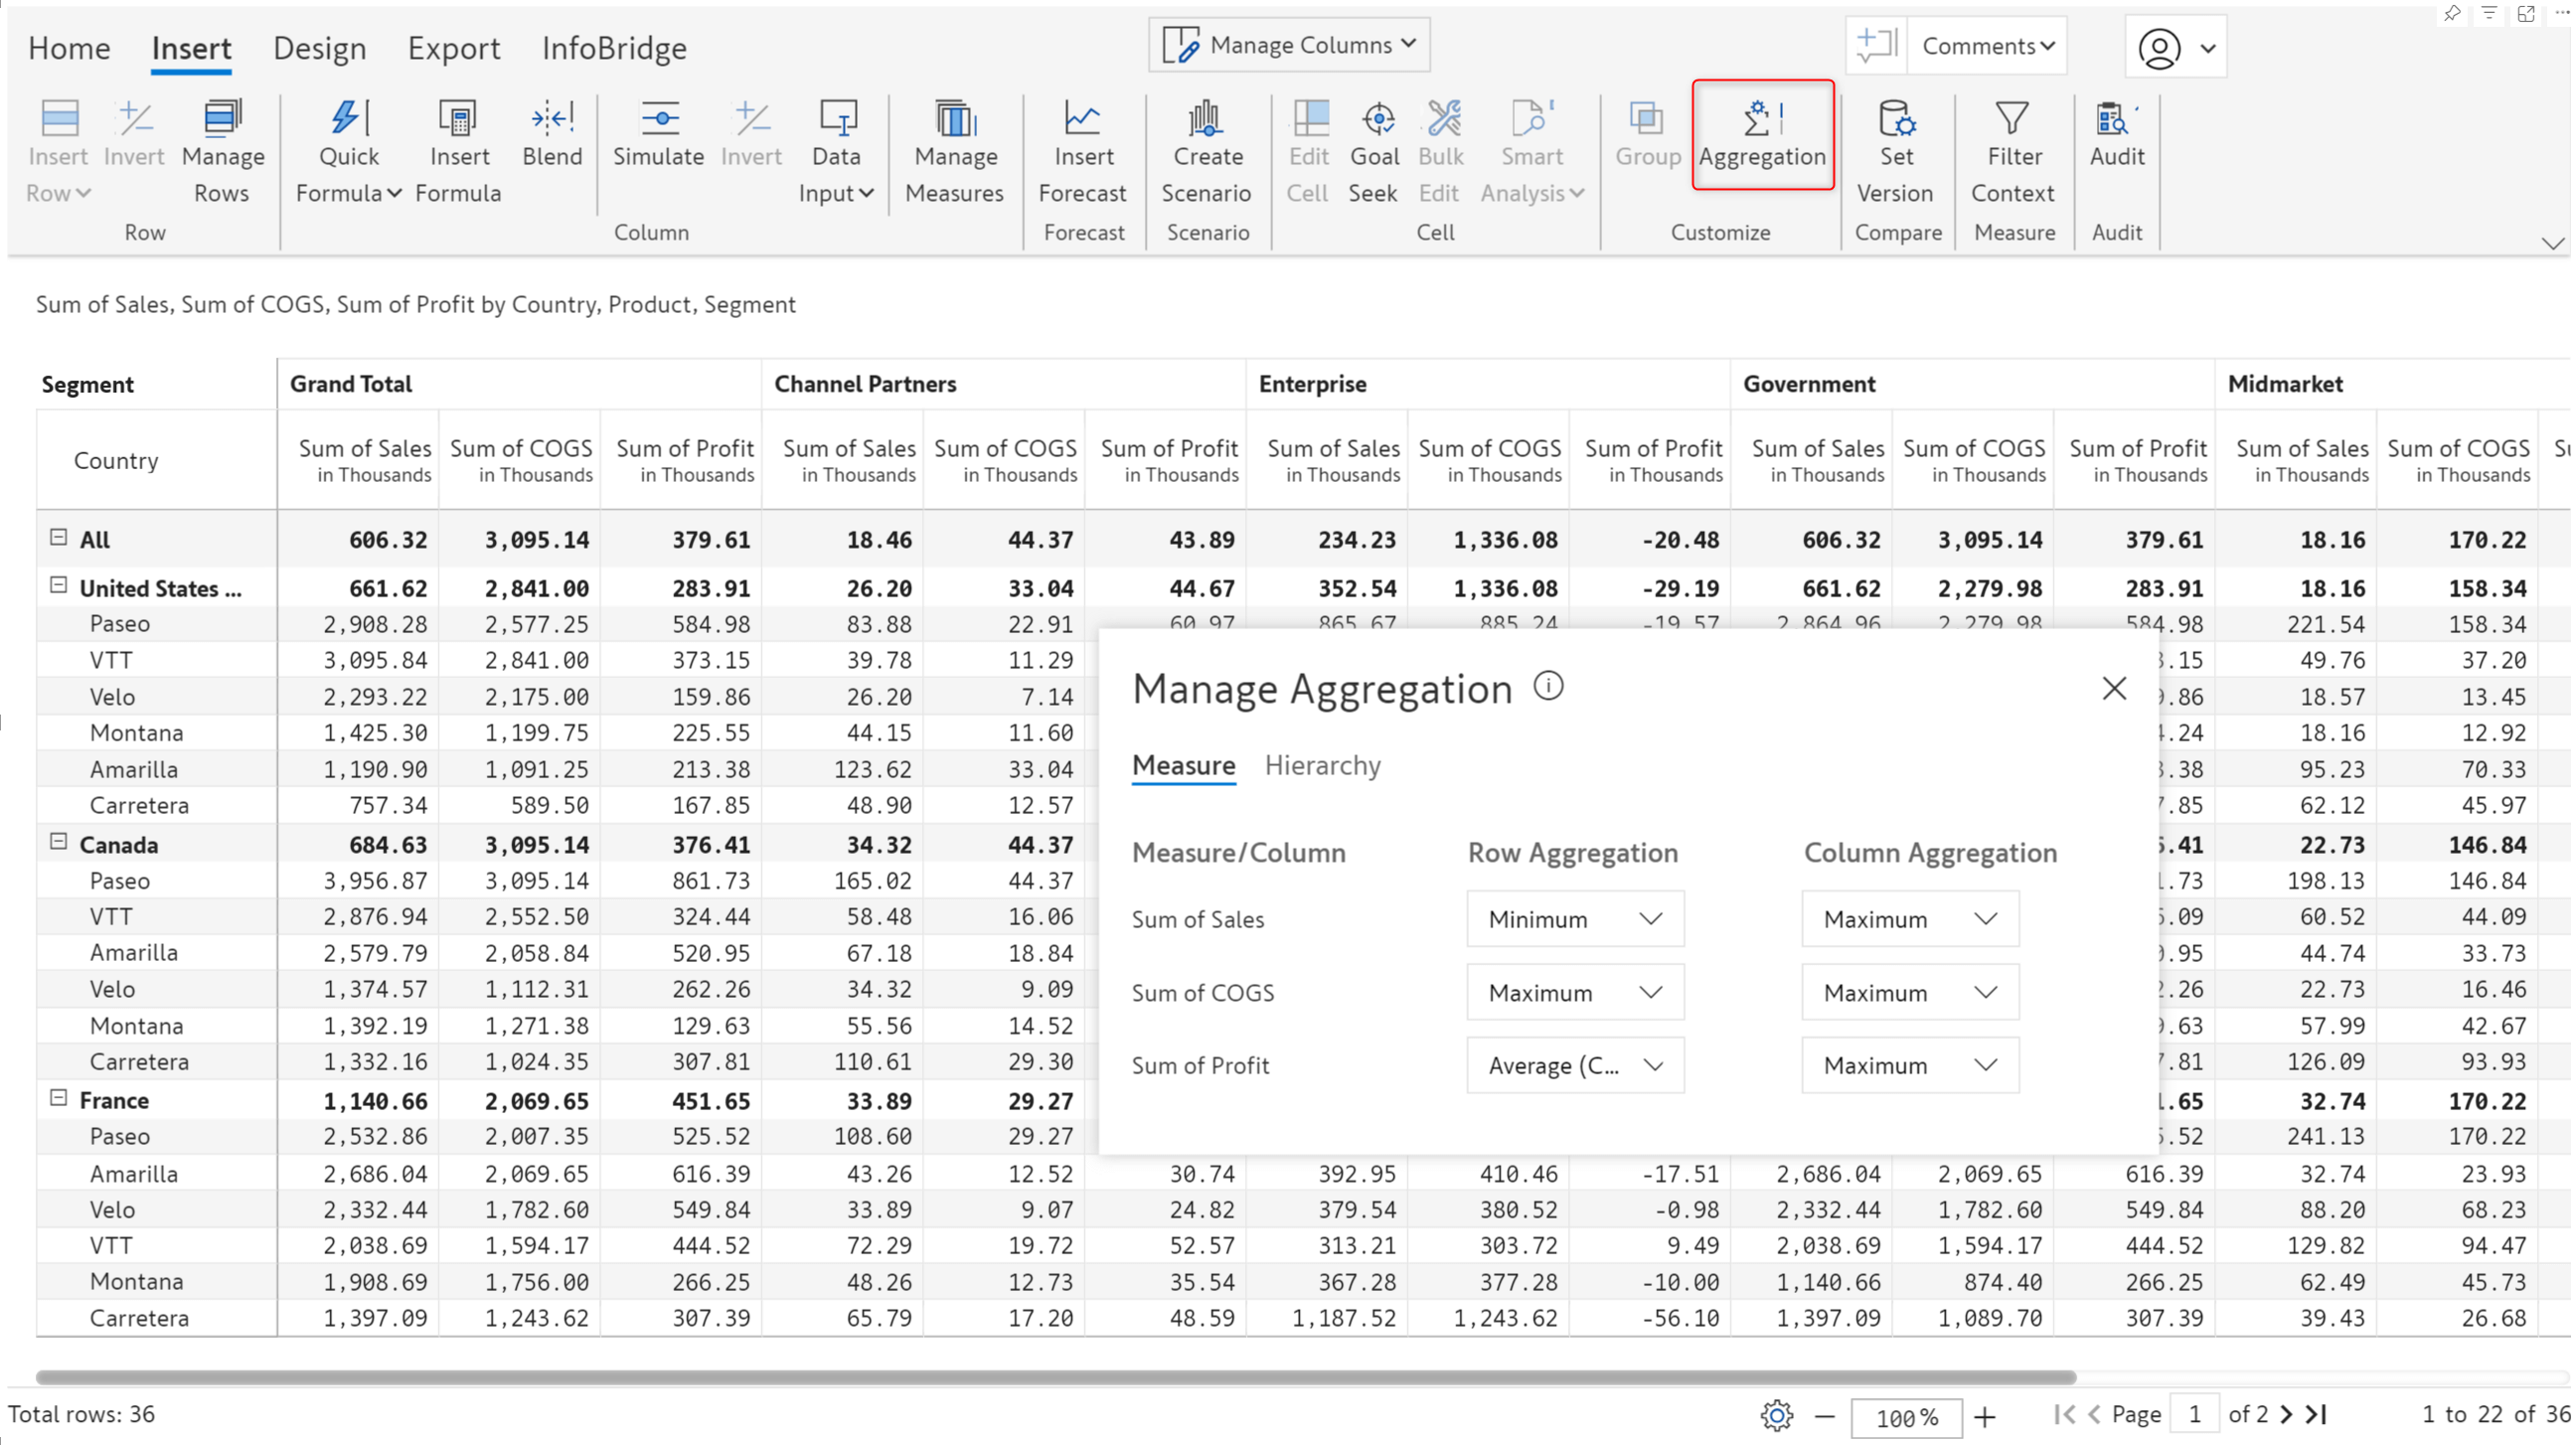
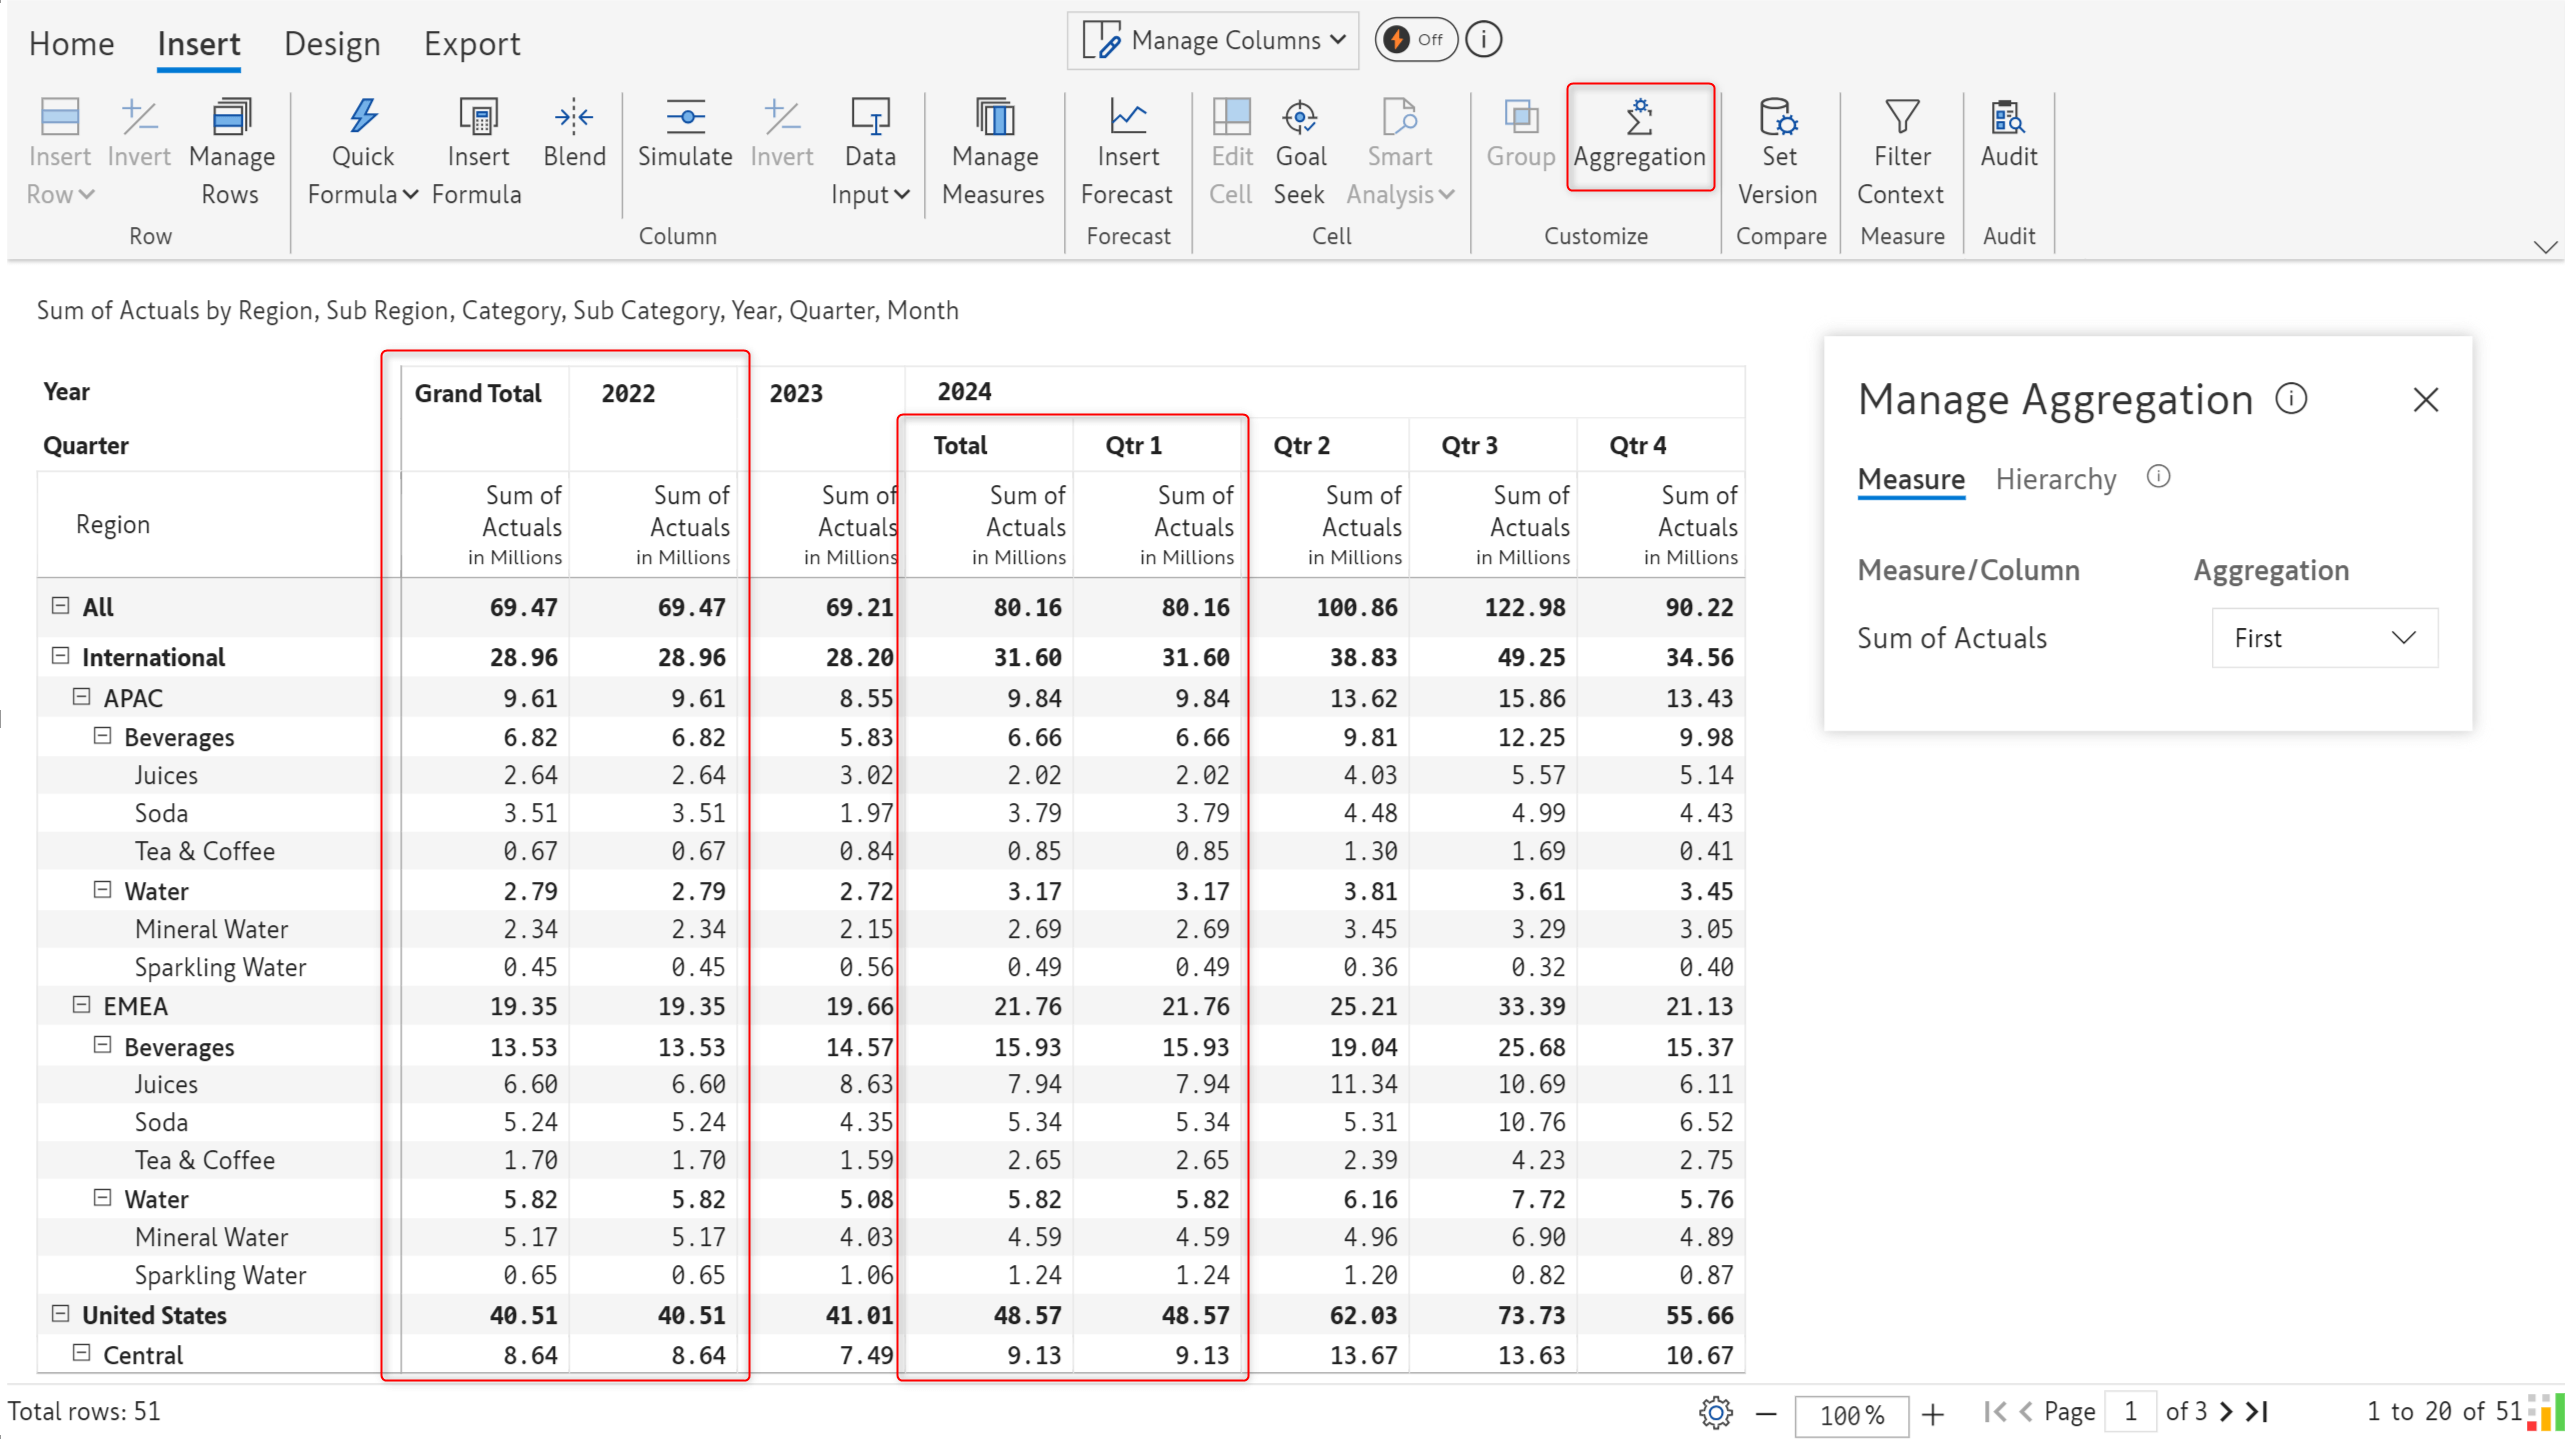
With Inforiver, you can set aggregation at multiple levels: category, measure, and report. In the 3.0 version, the Manage aggregation interface allows you to directly set the row and column aggregation for each measure.
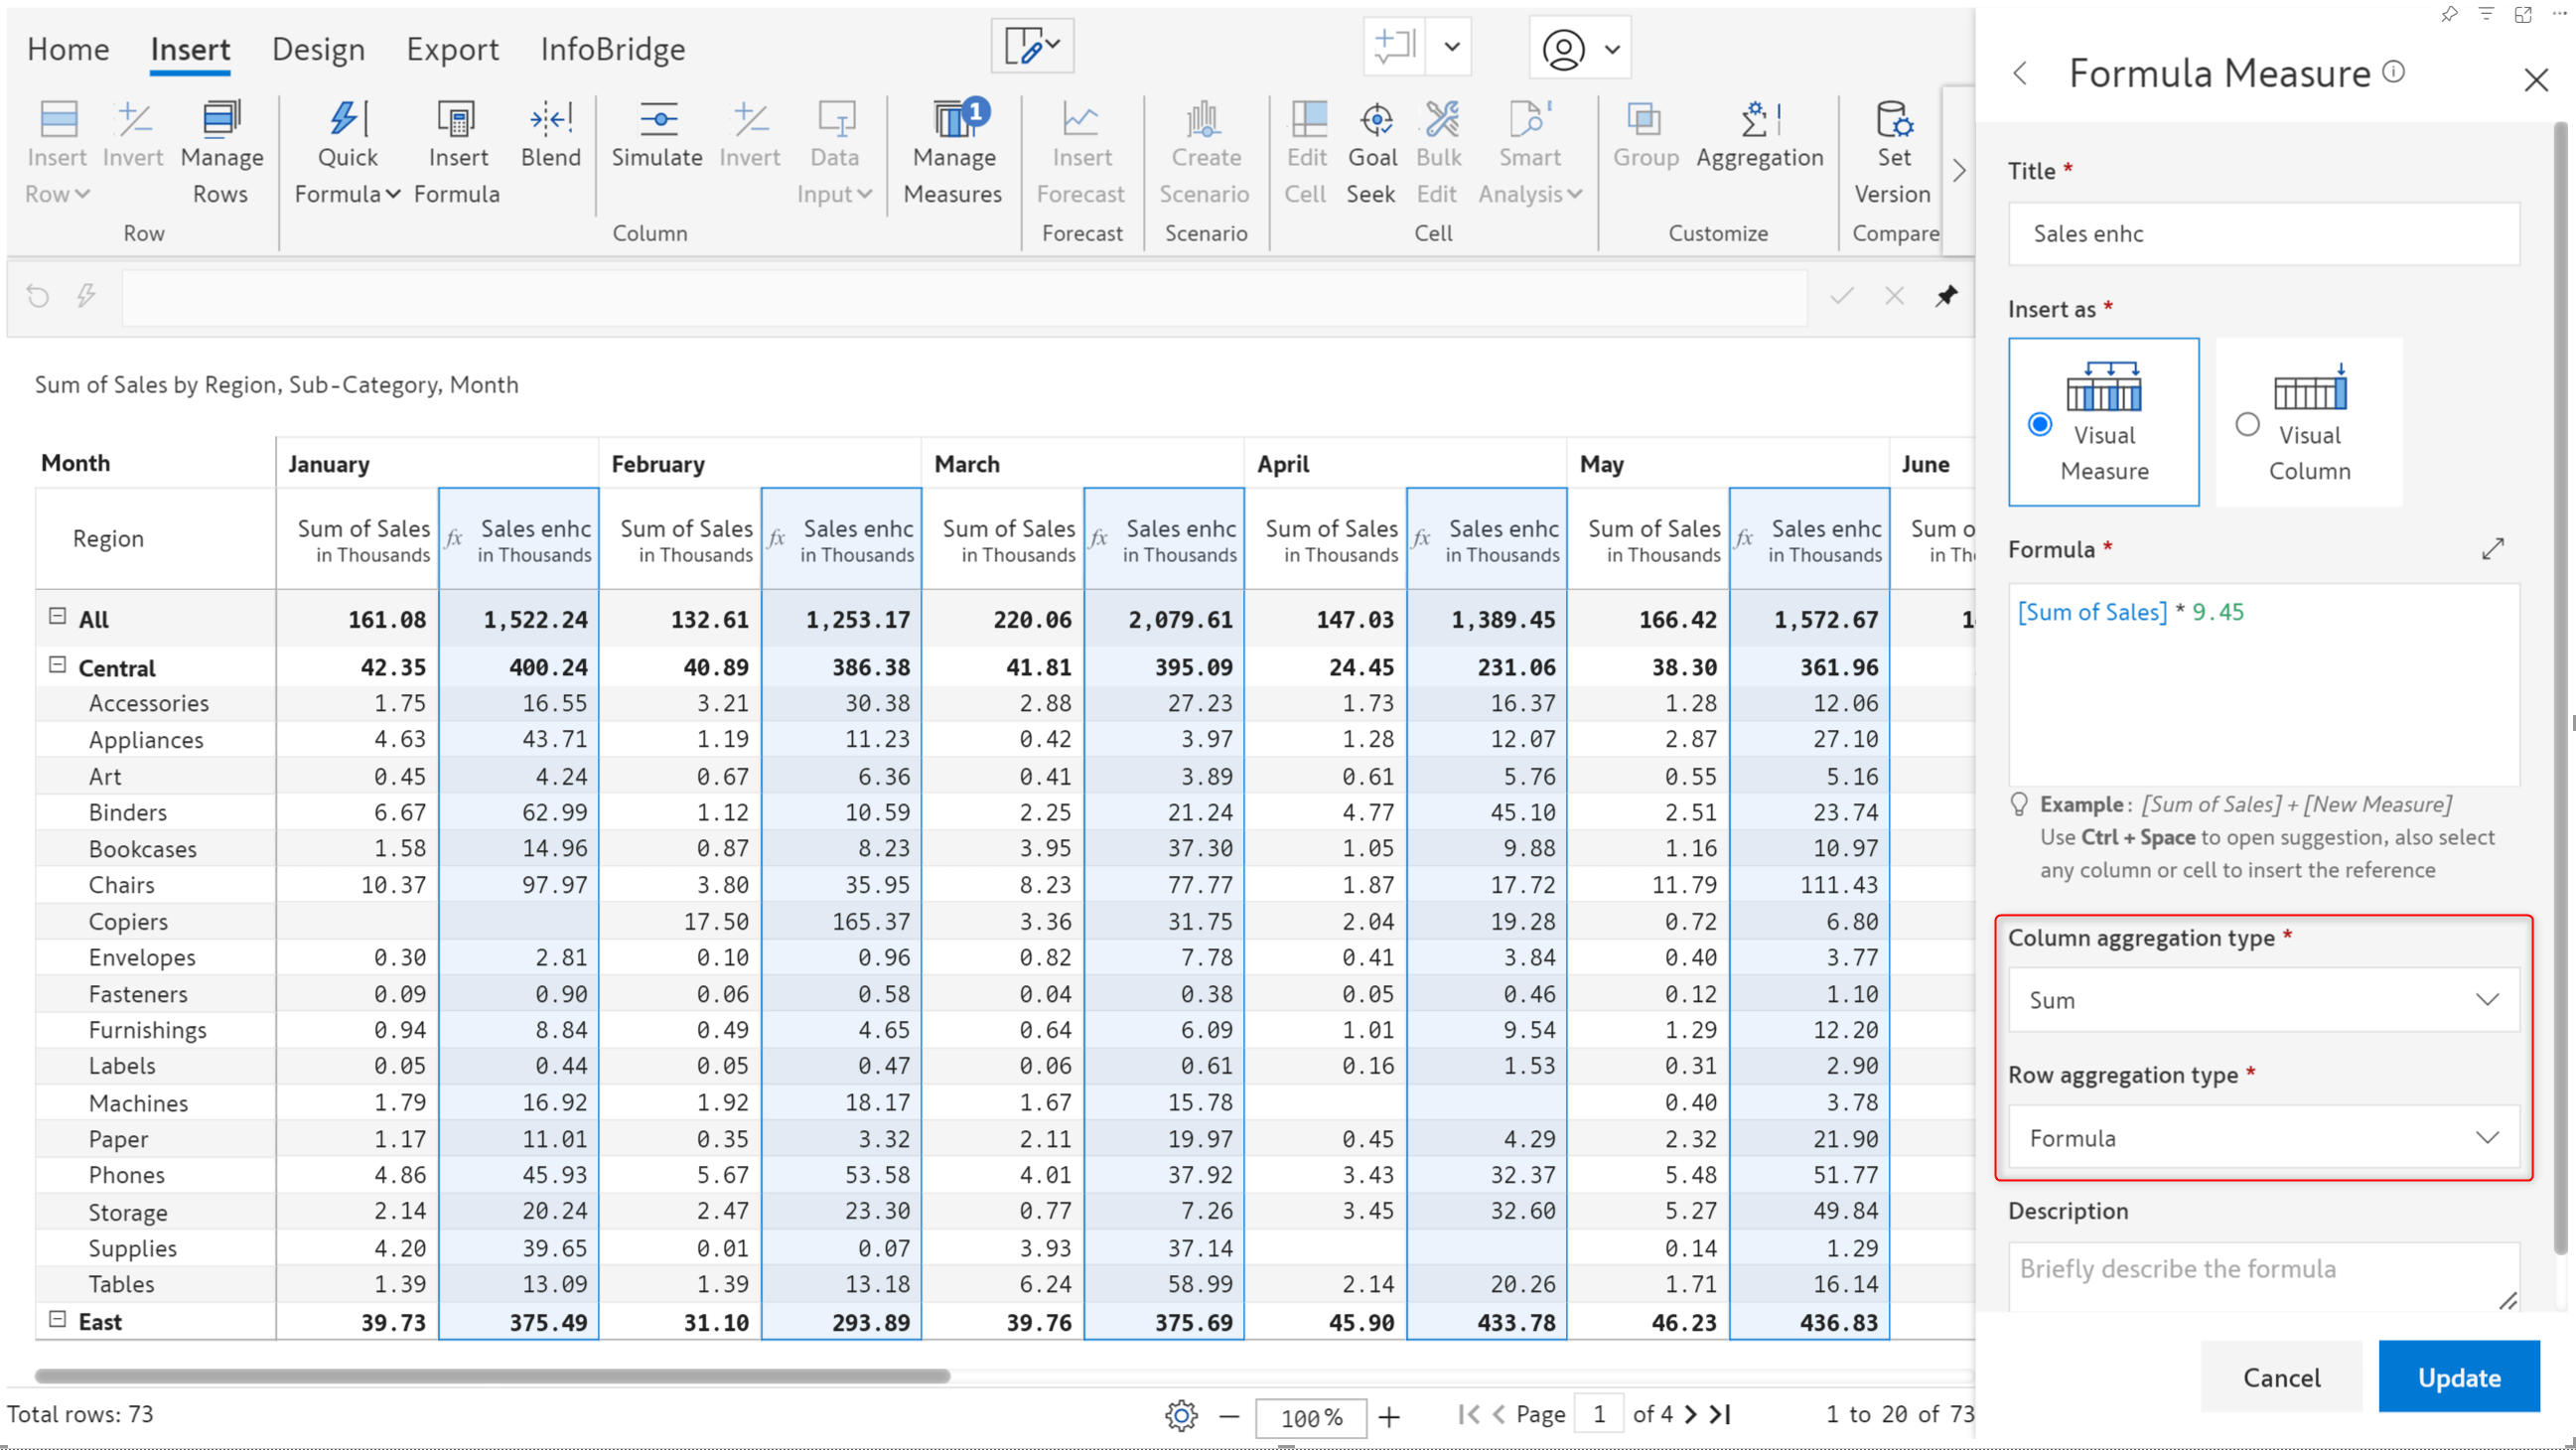
Inforiver automatically sets the row aggregation to formula and the column aggregation to sum for formula measures. You can override the default aggregation a required.
Note: When you select weighted average as the row aggregation type, the column aggregation will be set to weighted average and cannot be overridden.
You can view and edit the aggregation for formula measures from the Manage aggregation interface.
P&L or cash flow statements often require the values from the first or last periods as the column subtotals and grand totals.
First aggregation type: The values from the first period are used for the column subtotals and grand totals. In the example, the Actuals from Q1 are used as the subtotals at the year level. The Actuals from 2022 (the earliest year) are used for the grand total.
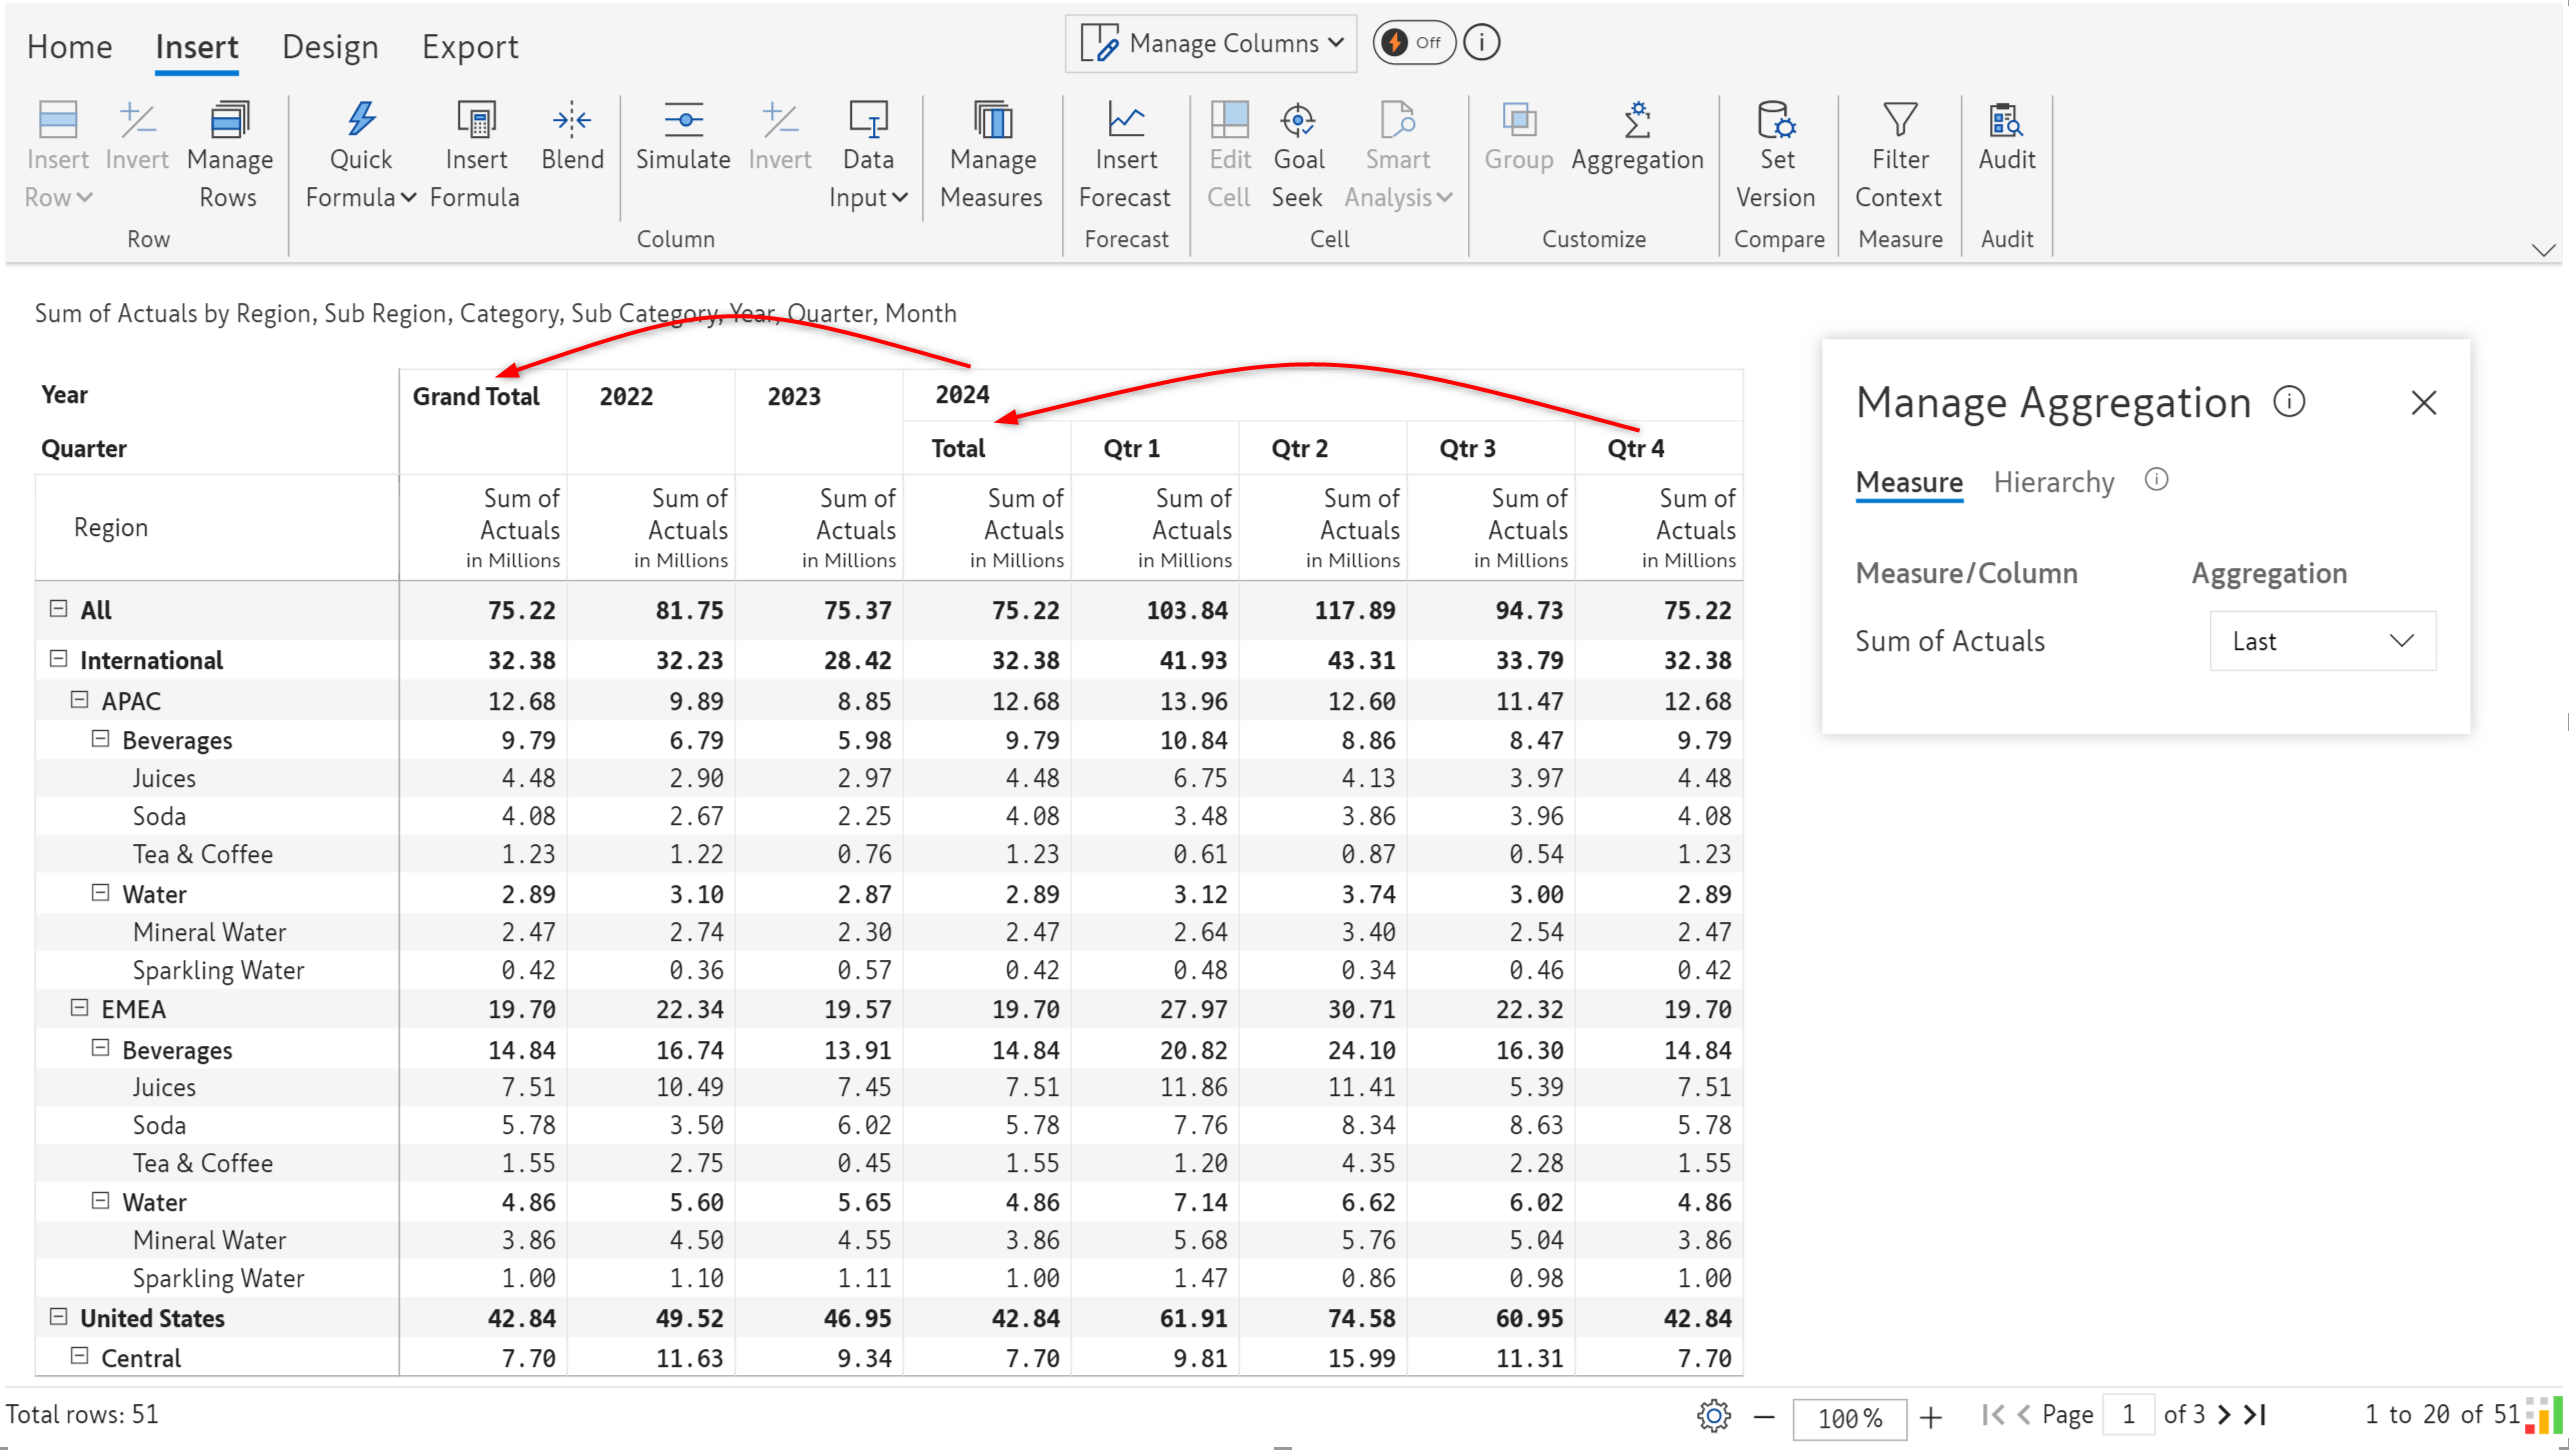
Last aggregation type: The last period is used to populate the grand totals and subtotals.
With the latest version, we’ve added new date functions like start of month, end of quarter, and start of year.
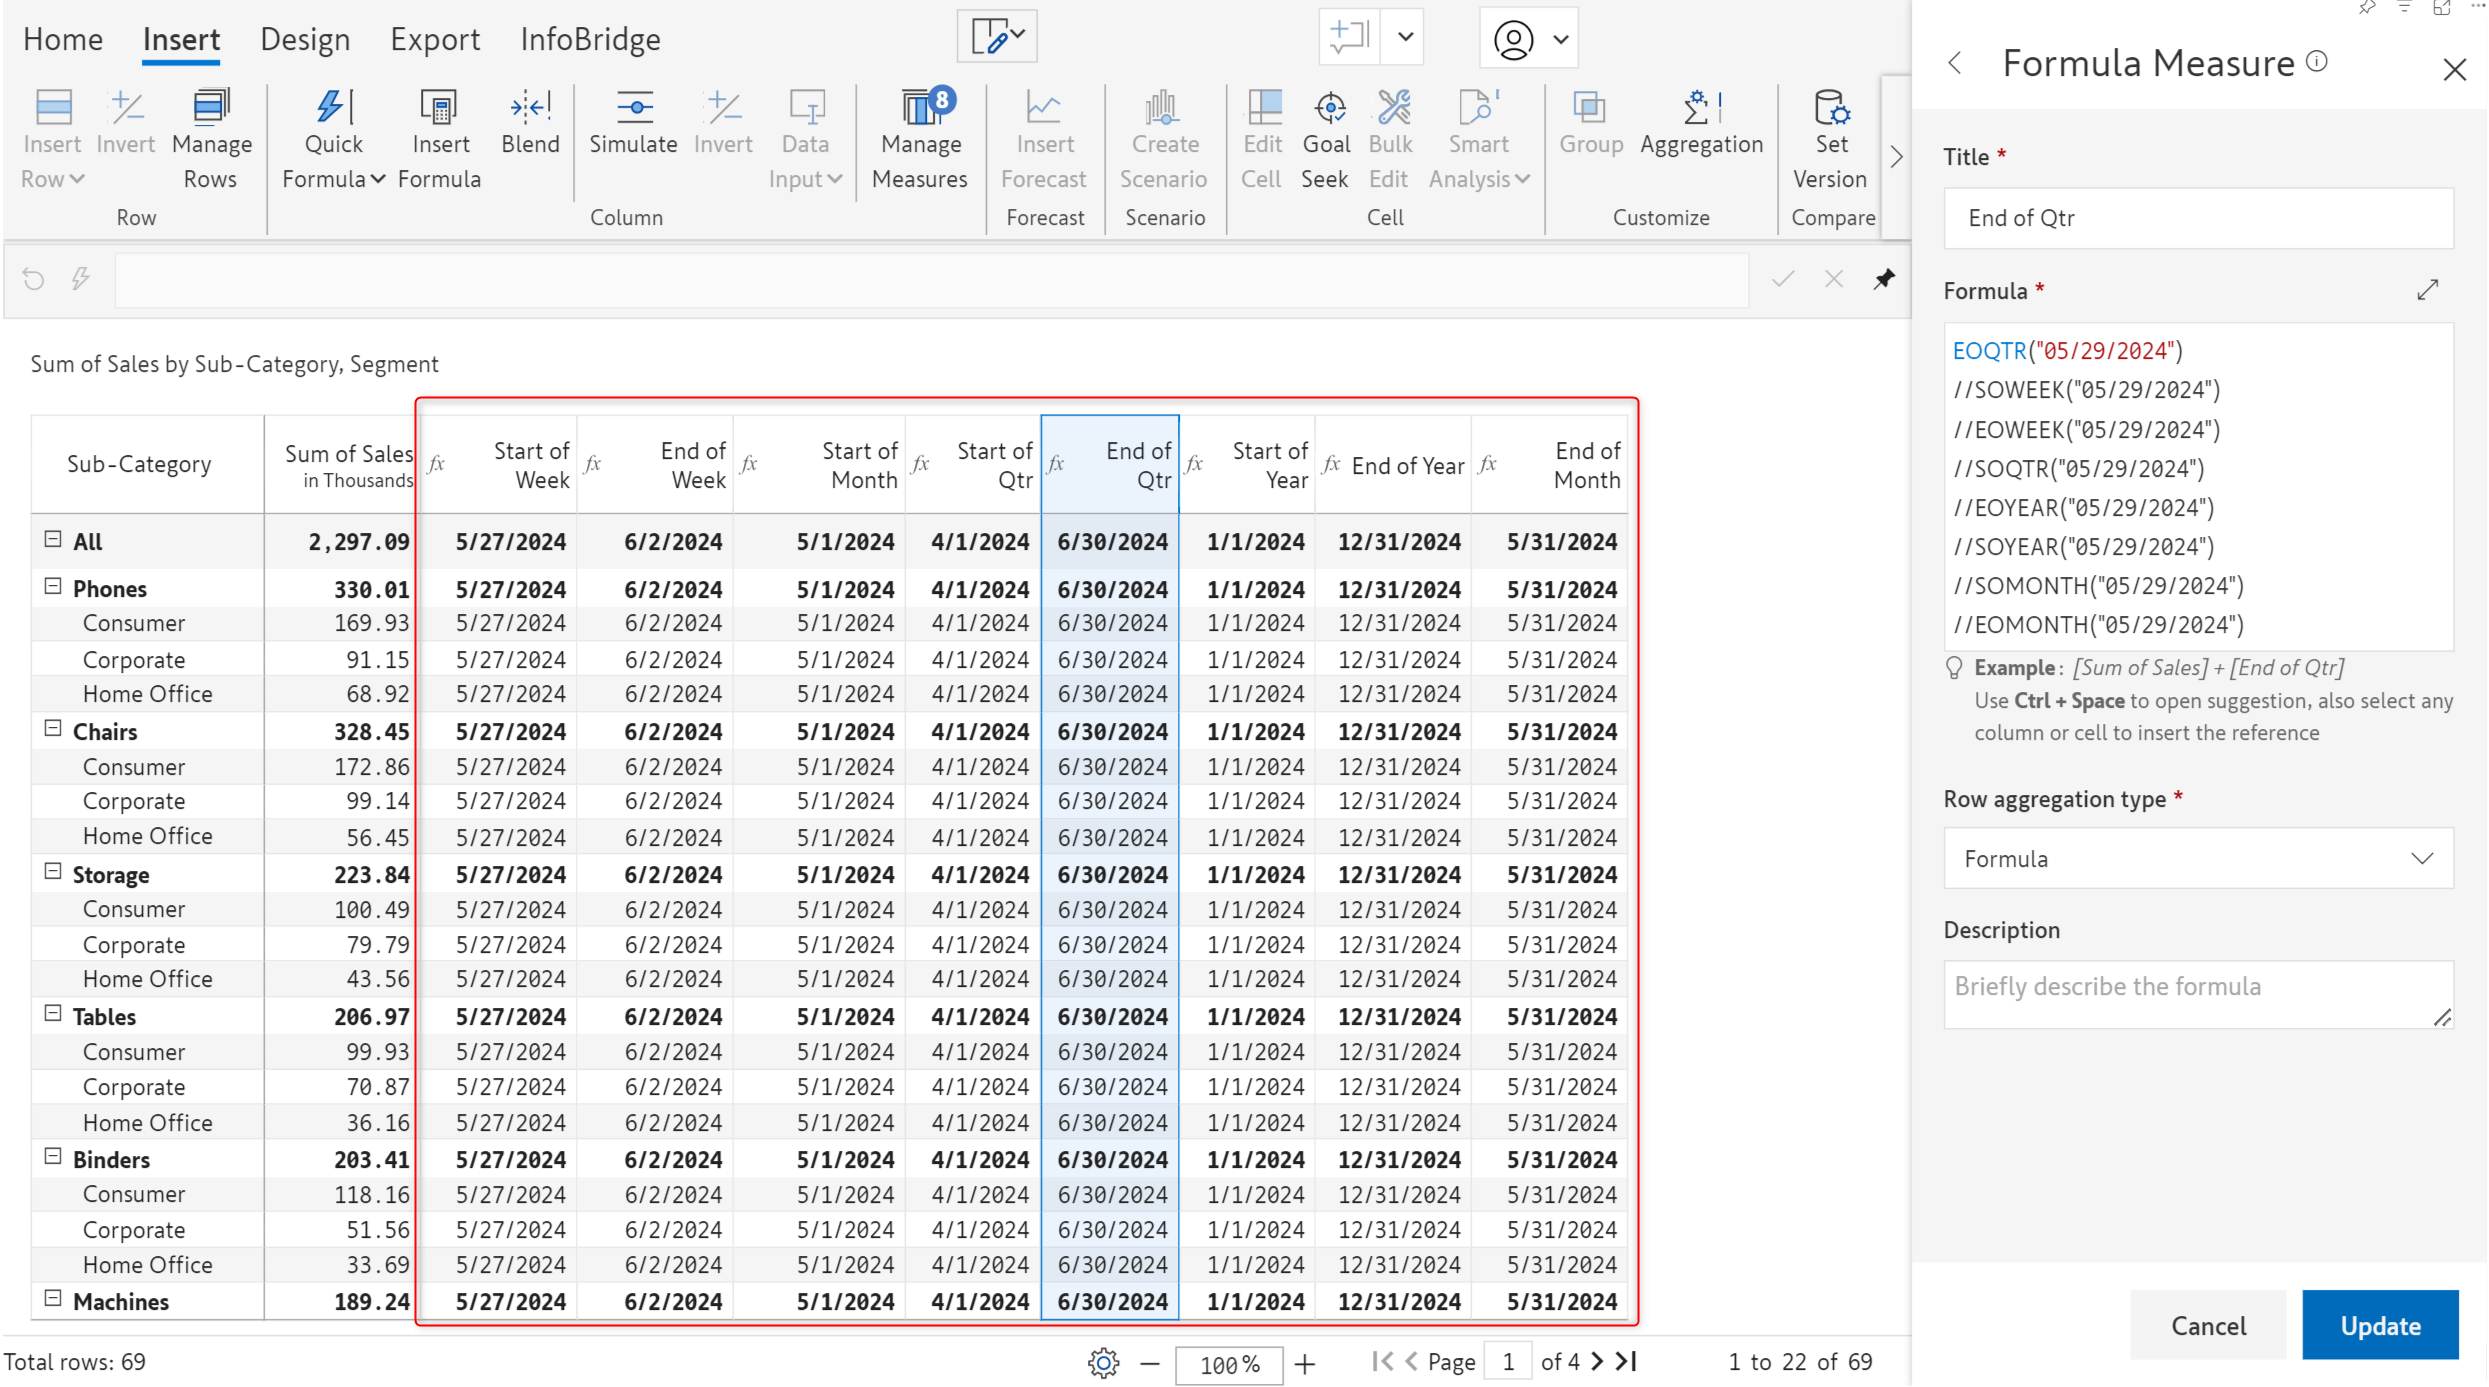
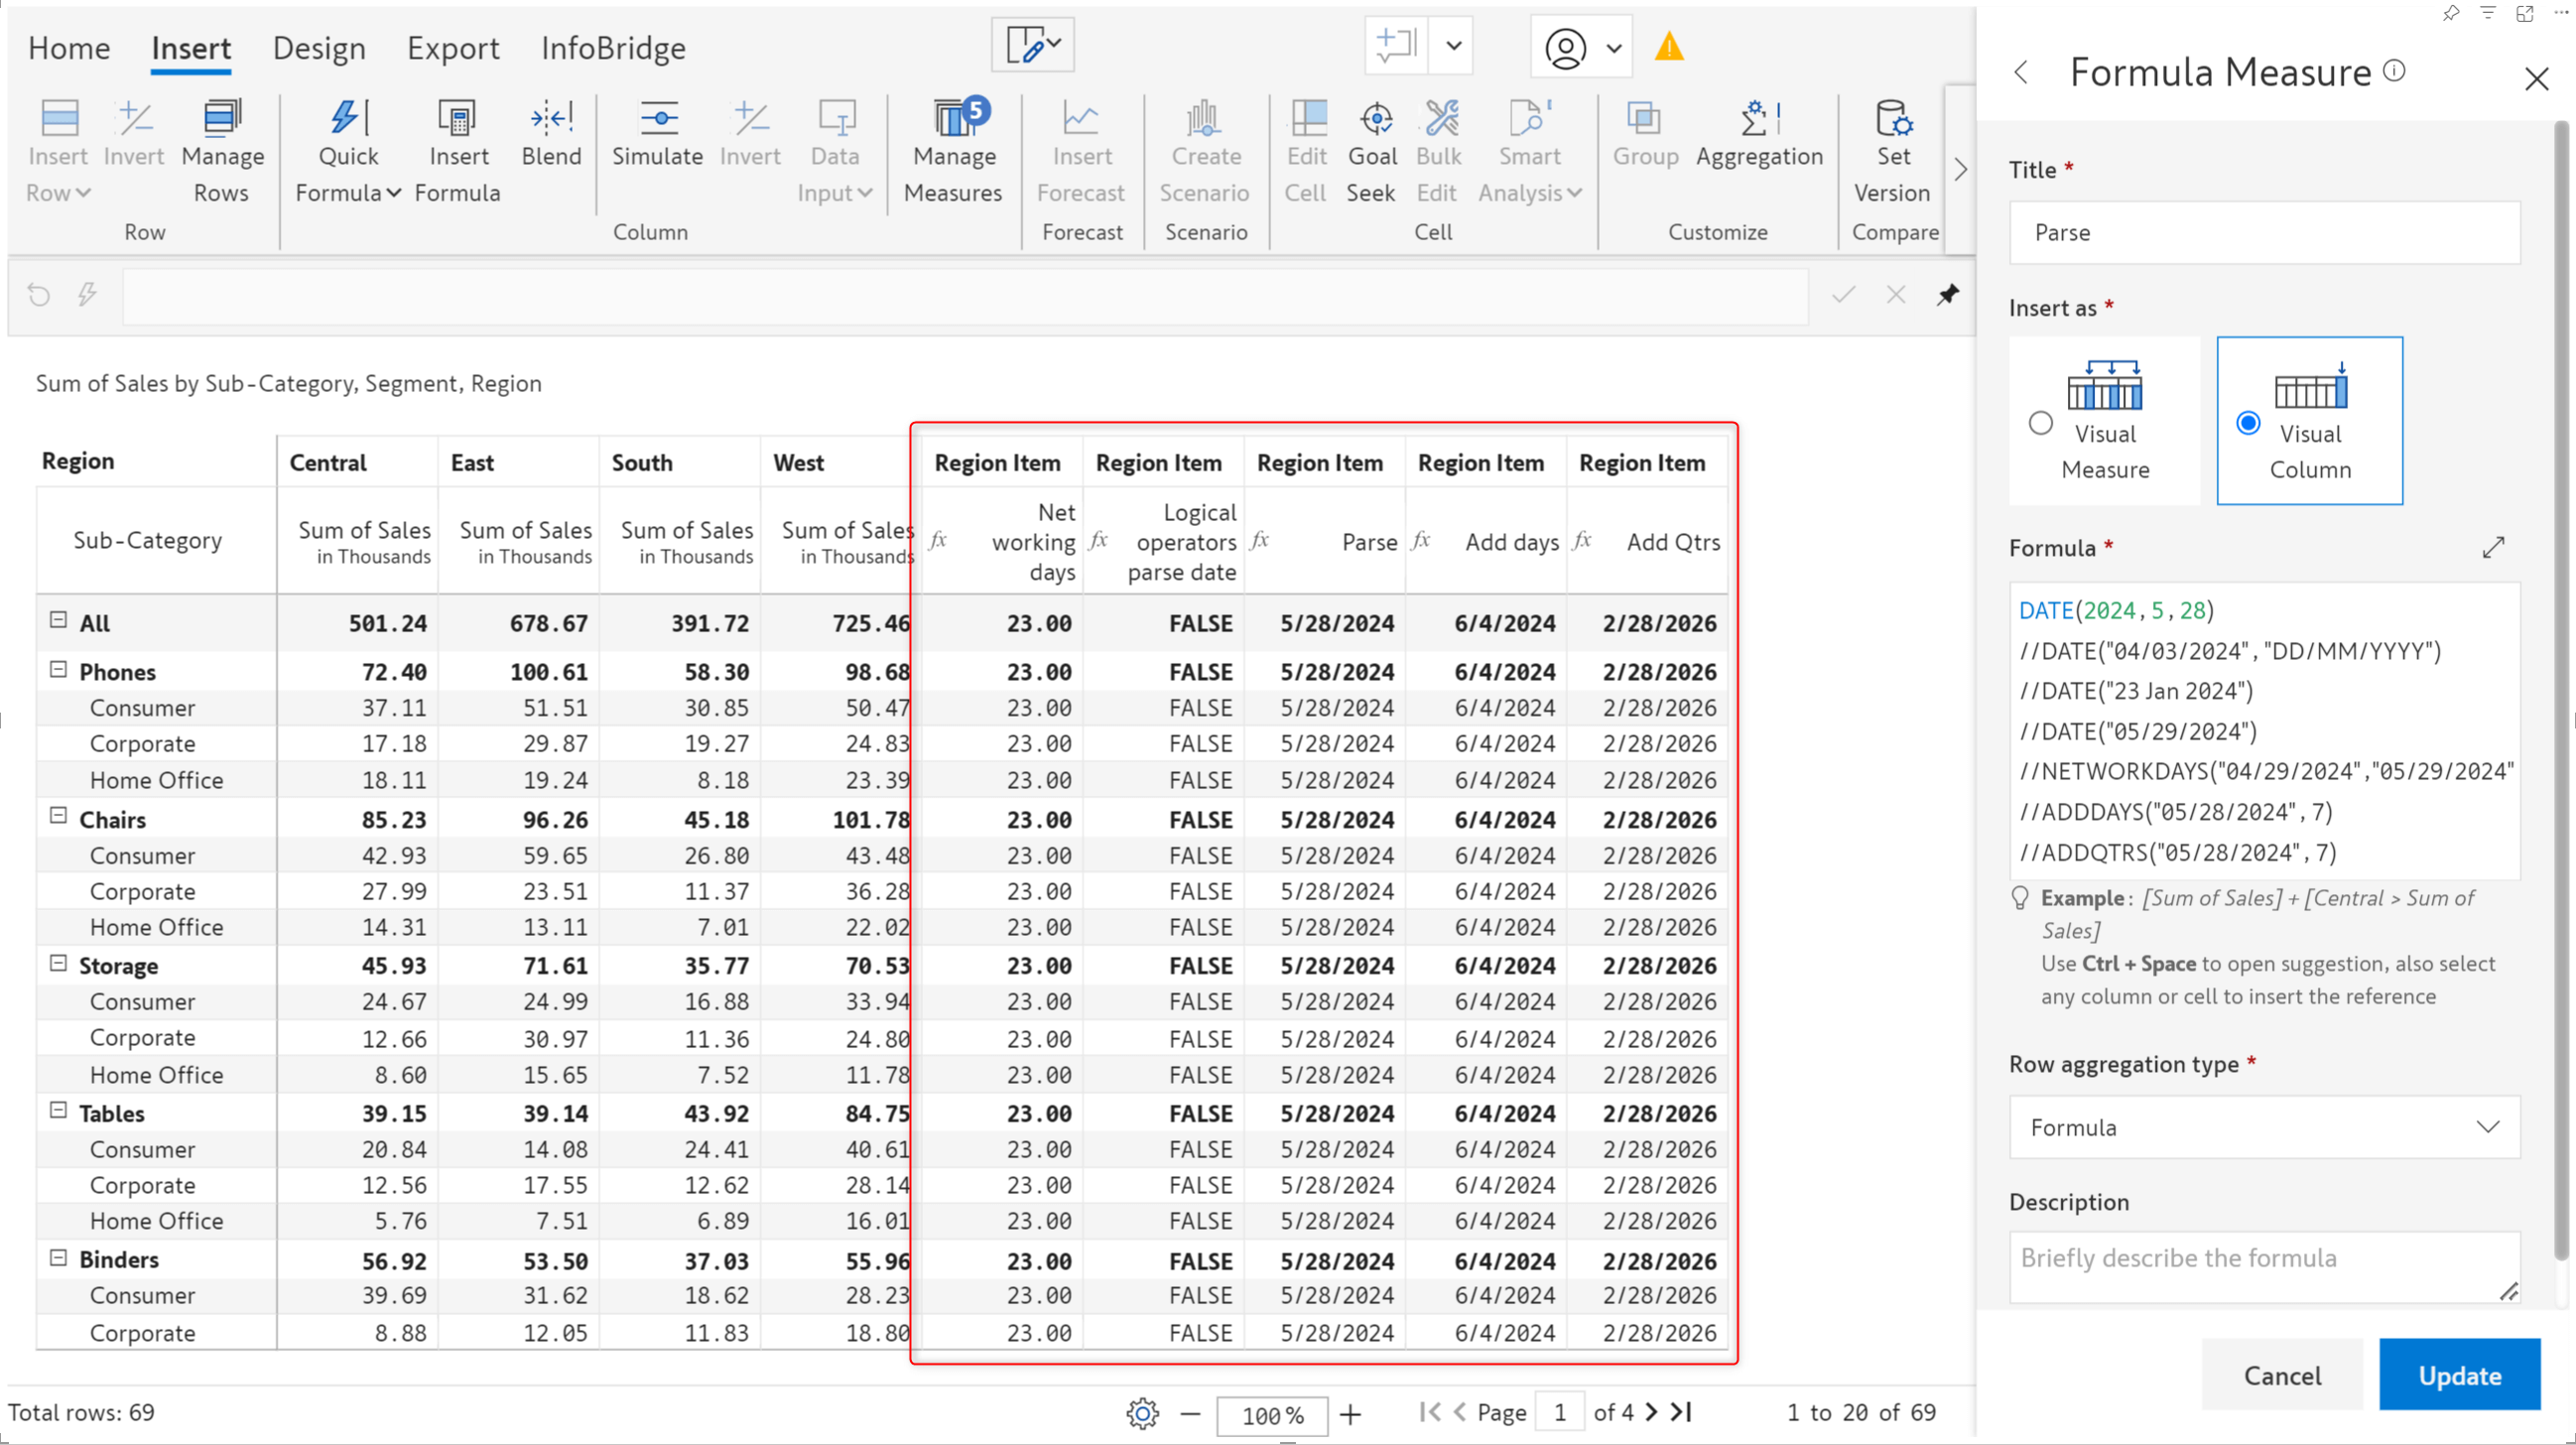
We have also introduced formulas to add days/quarters/months/years to an input date. Additionally, you can calculate the number of working days between 2 dates using the NETWORKDAYS formula. The DATE function has been enhanced to parse date values in different formats.
| FUNCTION NAME | DESCRIPTION |
| SOWEEK | Returns the starting date of the week |
| SOMONTH | Returns the starting date of the month |
| SOQTR | Returns the starting date of the quarter |
| SOYEAR | Returns the starting date of the year |
| EOWEEK | Returns the last date of the week |
| EOMONTH | Returns the last date of the month |
| EOQTR | Returns the last date of the quarter |
| EOYEAR | Returns the last date of the year |
| NETWORKDAYS | Returns the number of workdays between two input dates |
| ADDDAYS | Adds a specified number of days to the input date |
| ADDWEEKS | Adds a specified number of weeks to the input date |
| ADDMONTHS | Adds a specified number of months to the input date |
| ADDQTRS | Adds a specified number of quarters to the input date |
| ADDYEARS | Adds a specified number of years to the input date |
| DATE() | Parses string as per given format or identifies format |
| Logical operators >, <, <=, >=, == | Compares input dates and returns a boolean value. |
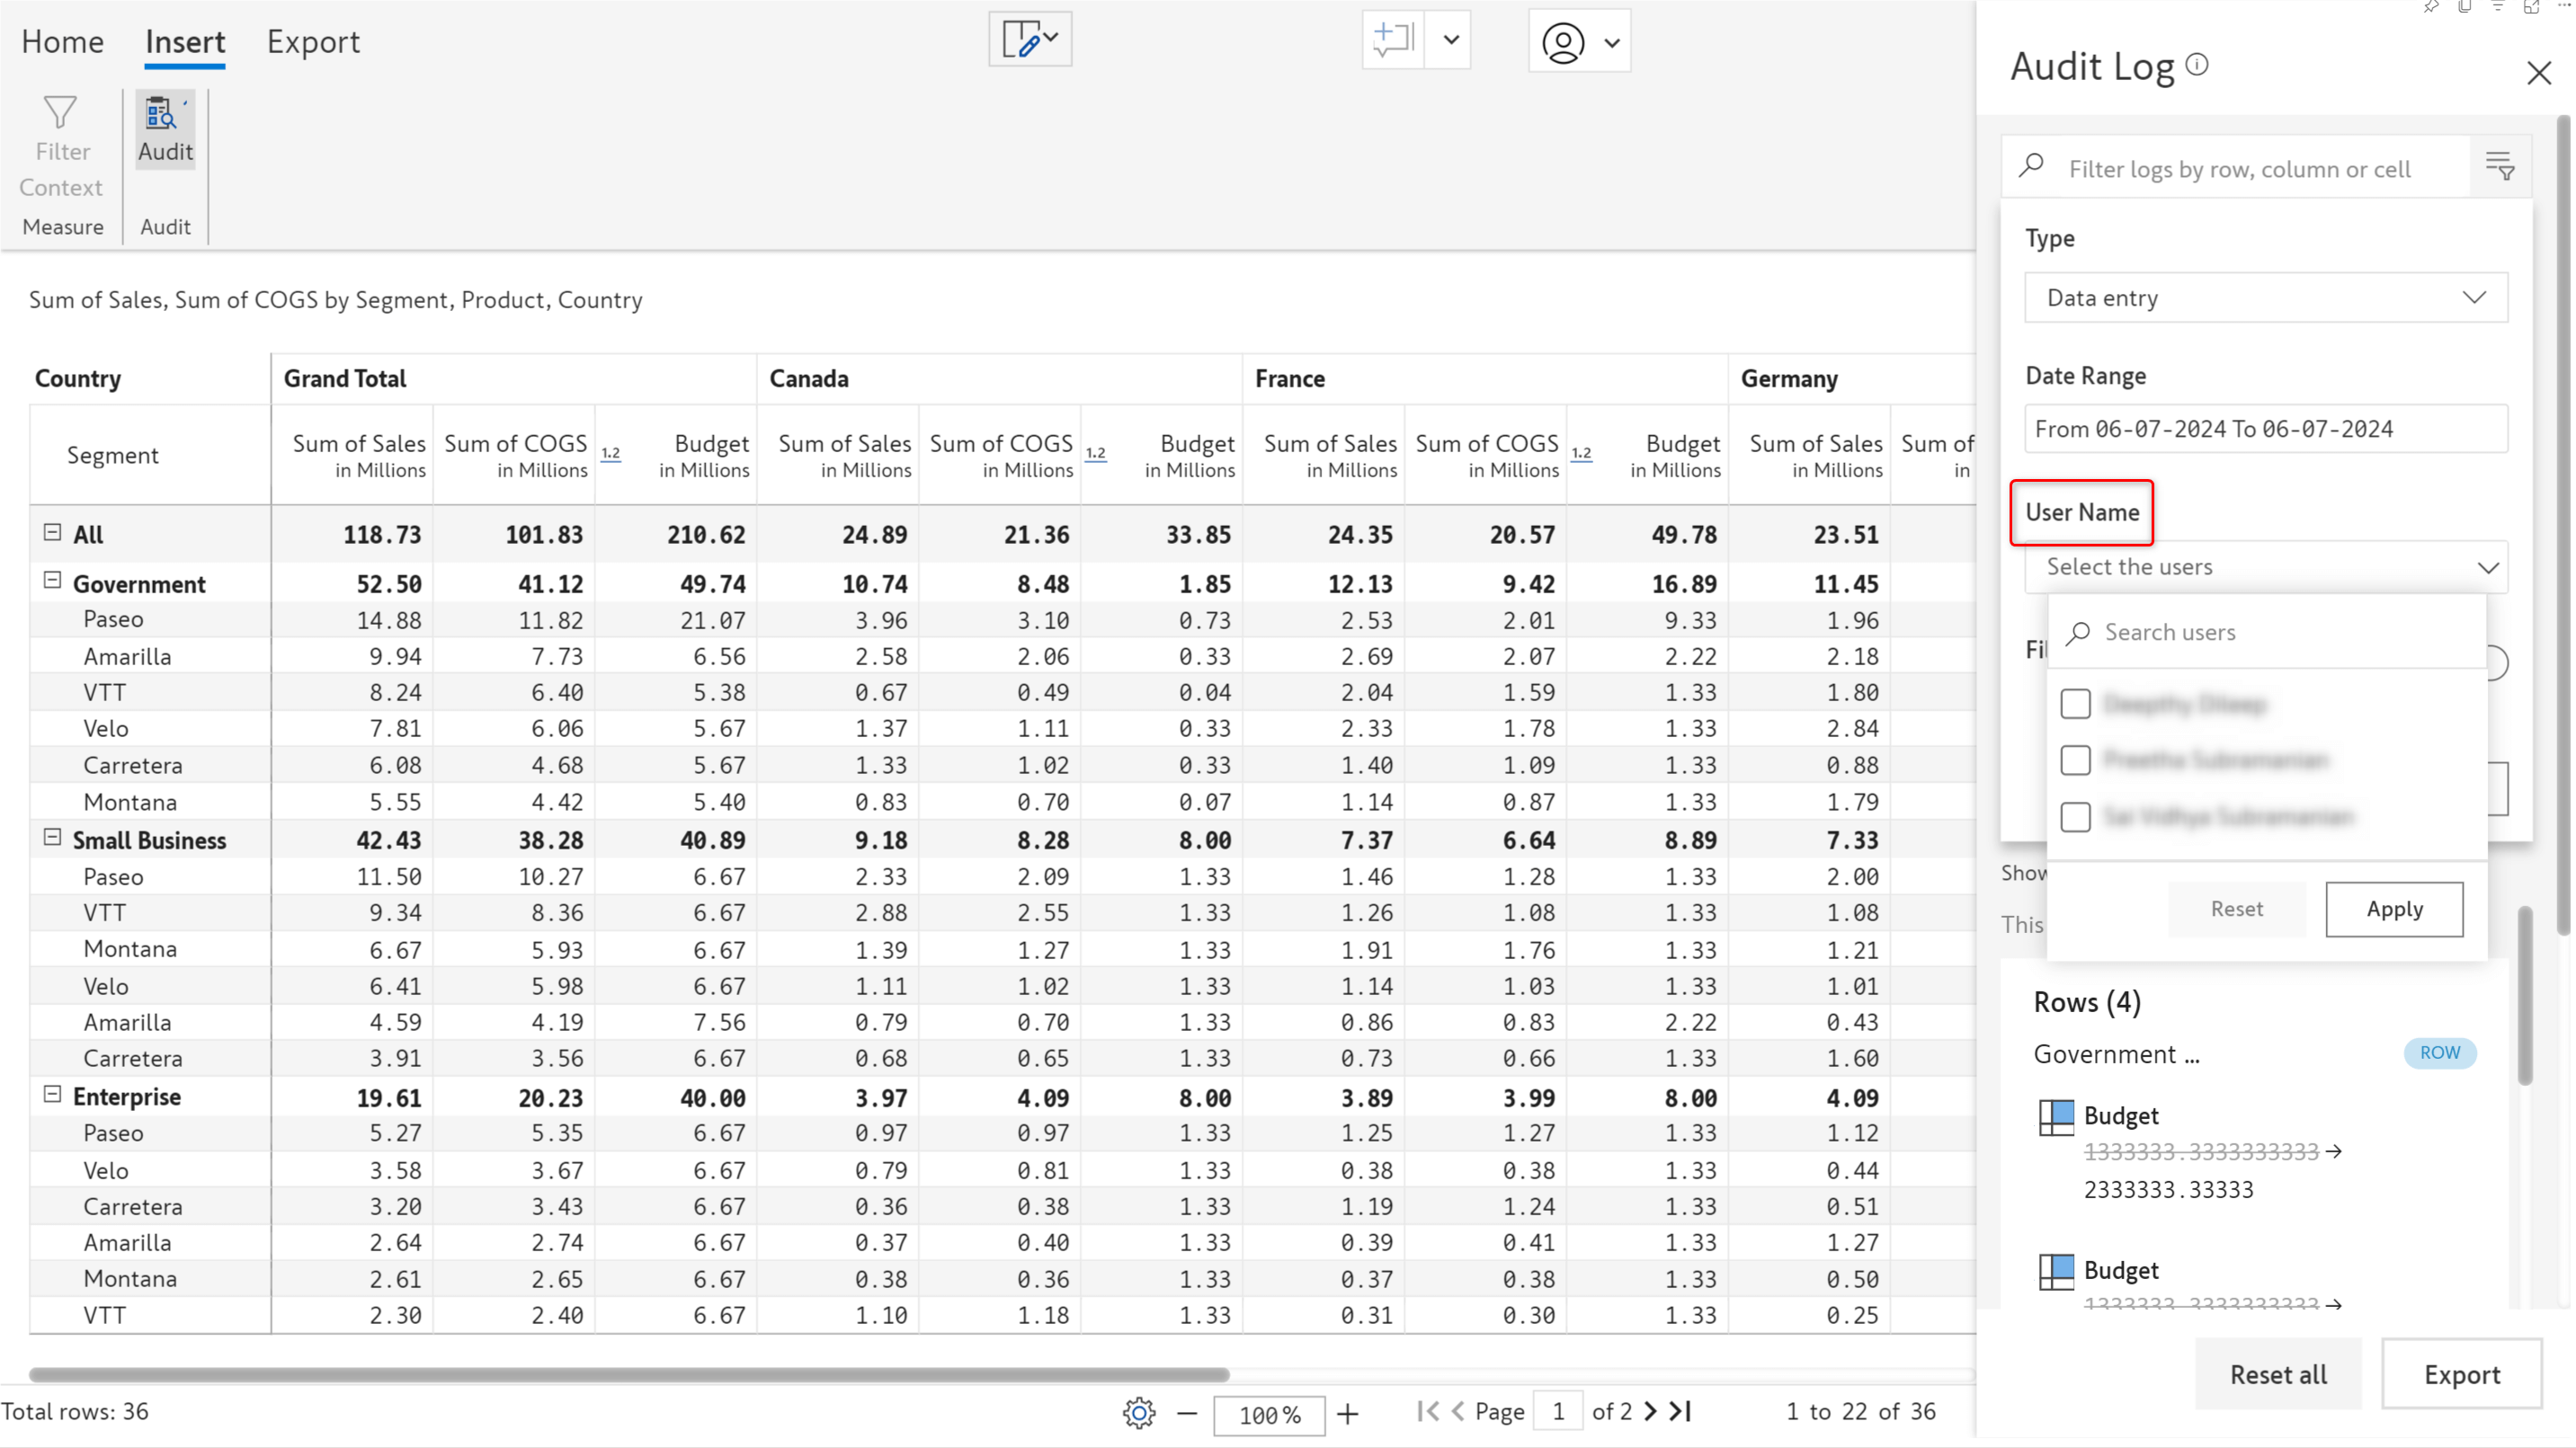
The Inforiver platform facilitates collaborating on reports. A case in point is multiple users entering and updating values in a data input field. However, if you needed to track the changes made by a particular user, you would need to scan the entire audit log! In the 3.0 version, you will have this data at your fingertips. You can now filter the data entry audit log based on the username. This feature is available in reading mode as well.
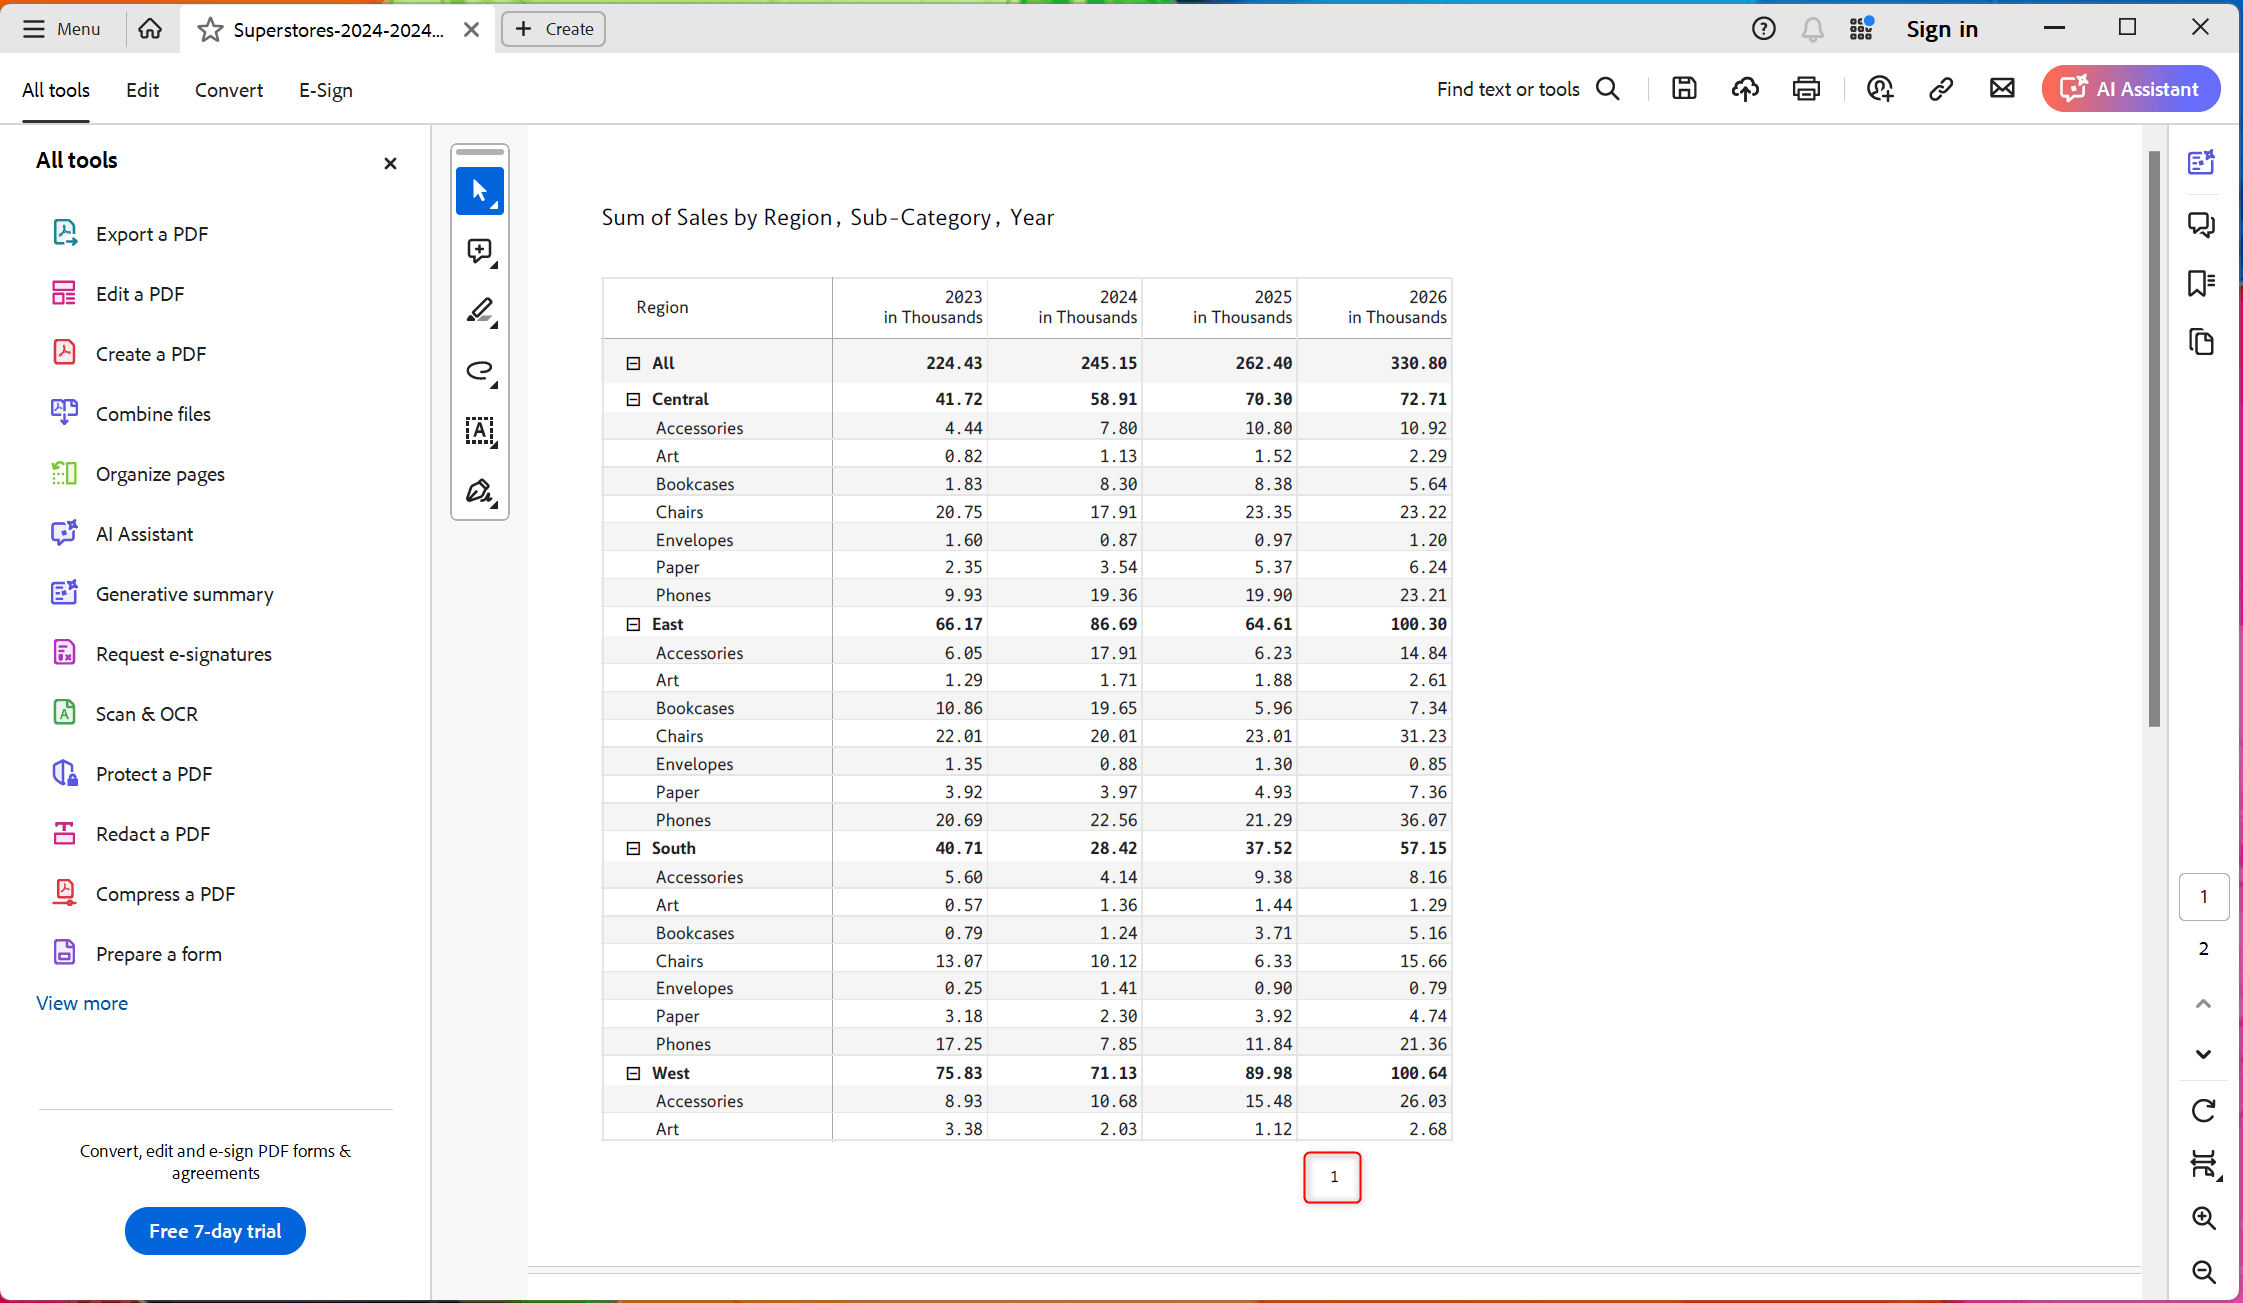
The PDF extract in your scheduled reports will now display the page number.
Note: InfoBridge will be available with new pricing in July. Reach out to us to know more!
With that, we conclude the 3.0. Writeback Matrix release updates.
Your support and feedback enable us to continuously refine Inforiver. We look forward to your suggestions and have many more exciting innovations lined up! Visit the Inforiver Community to share your ideas, vote on others’ submissions, and interact with other users.

Inforiver helps enterprises consolidate planning, reporting & analytics on a single platform (Power BI). The no-code, self-service award-winning platform has been recognized as the industry’s best and is adopted by many Fortune 100 firms.
Inforiver is a product of Lumel, the #1 Power BI AppSource Partner. The firm serves over 3,000 customers worldwide through its portfolio of products offered under the brands Inforiver, EDITable, ValQ, and xViz.

How Leading Teams Go Beyond Native Power BI with Inforiver Analytics+