Upcoming webinar on 'Inforiver Charts : The fastest way to deliver stories in Power BI', Aug 29th , Monday, 10.30 AM CST. Register Now
Upcoming webinar on 'Inforiver Charts : The fastest way to deliver stories in Power BI', Aug 29th , Monday, 10.30 AM CST. Register Now
Welcome to the Inforiver Premium 2.6 release update! We are thrilled to announce exciting new features like on-load scripts and time intelligence formulae. We also have a range of new customization options and enhancements across forecasting, excel export, variance calculations, and more - most anticipated by our Inforiver user community!
Key enhancements in the 2.6 release are listed below. The release notes are organized by the toolbar section in which each feature can be accessed. Feel free to jump into the section that interests you the most!
You can create visual hierarchies in Inforiver by grouping rows. The 2.6 release provides the capability to set conditional formatting for a row group.
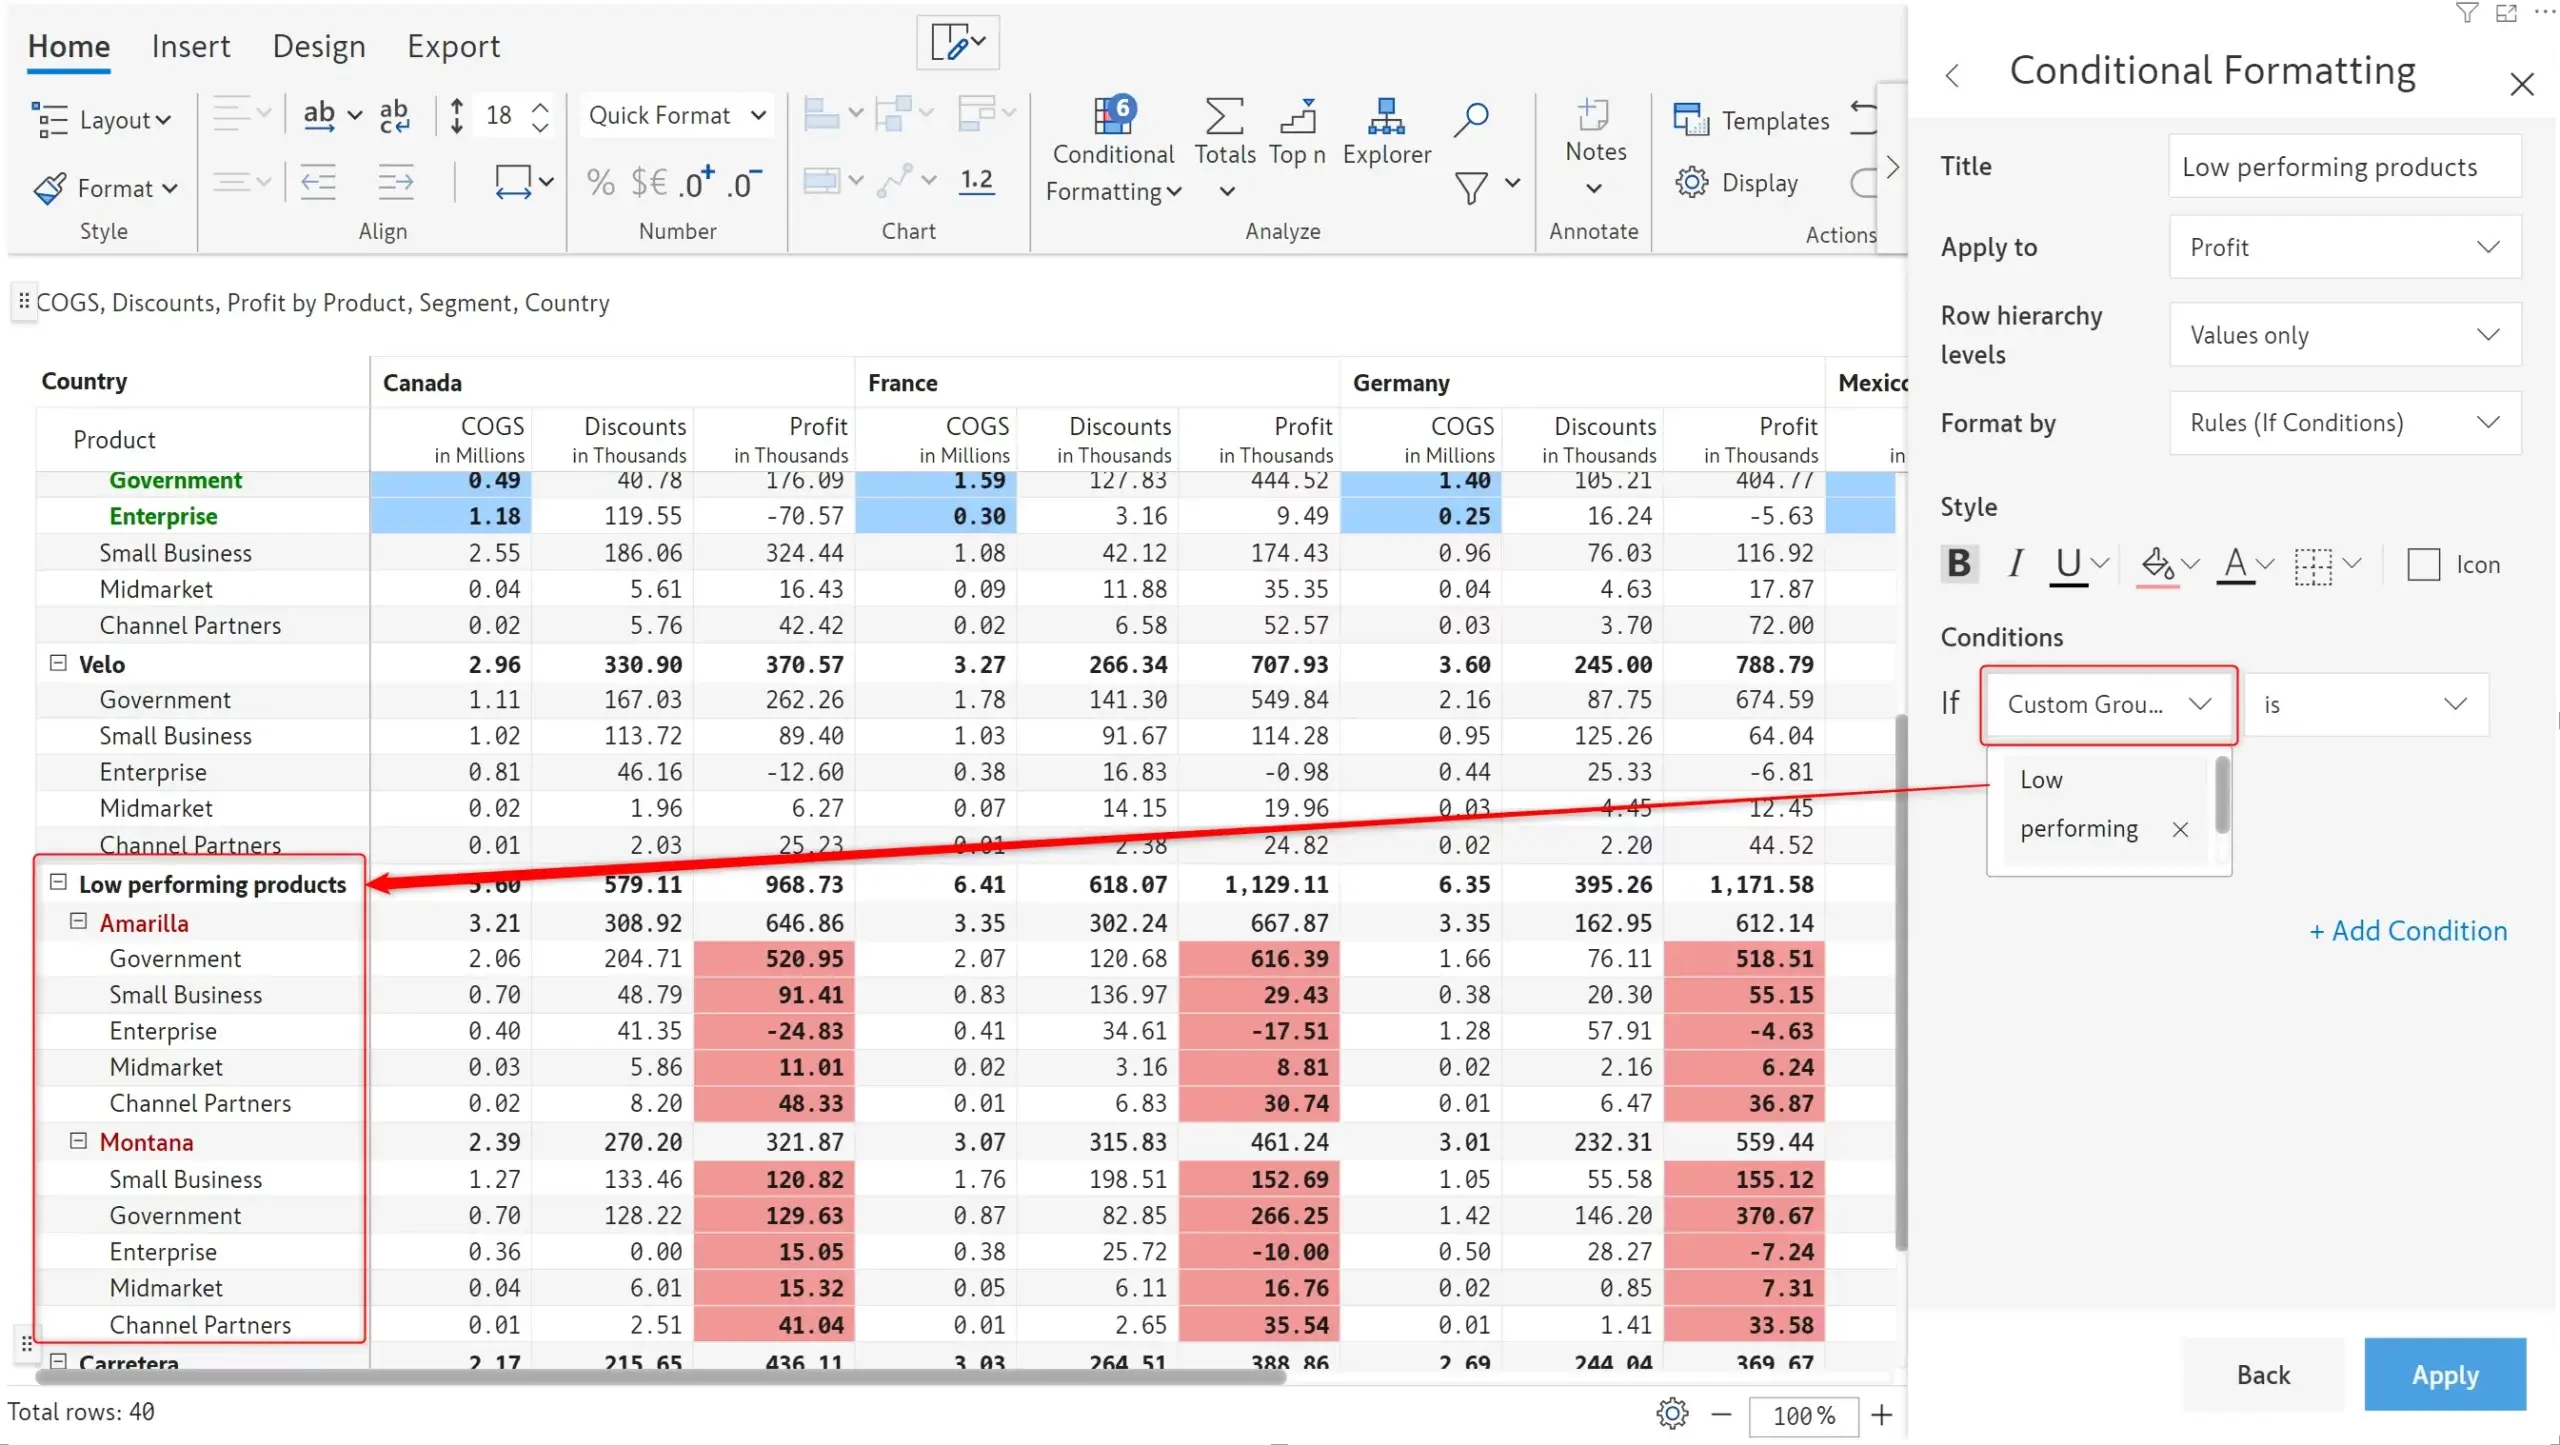
In the example below, we have created different conditional formatting rules for each of the row groups: ‘Paseo - low revenue’, ‘VTT - High revenue’ and ‘Low performing products’.
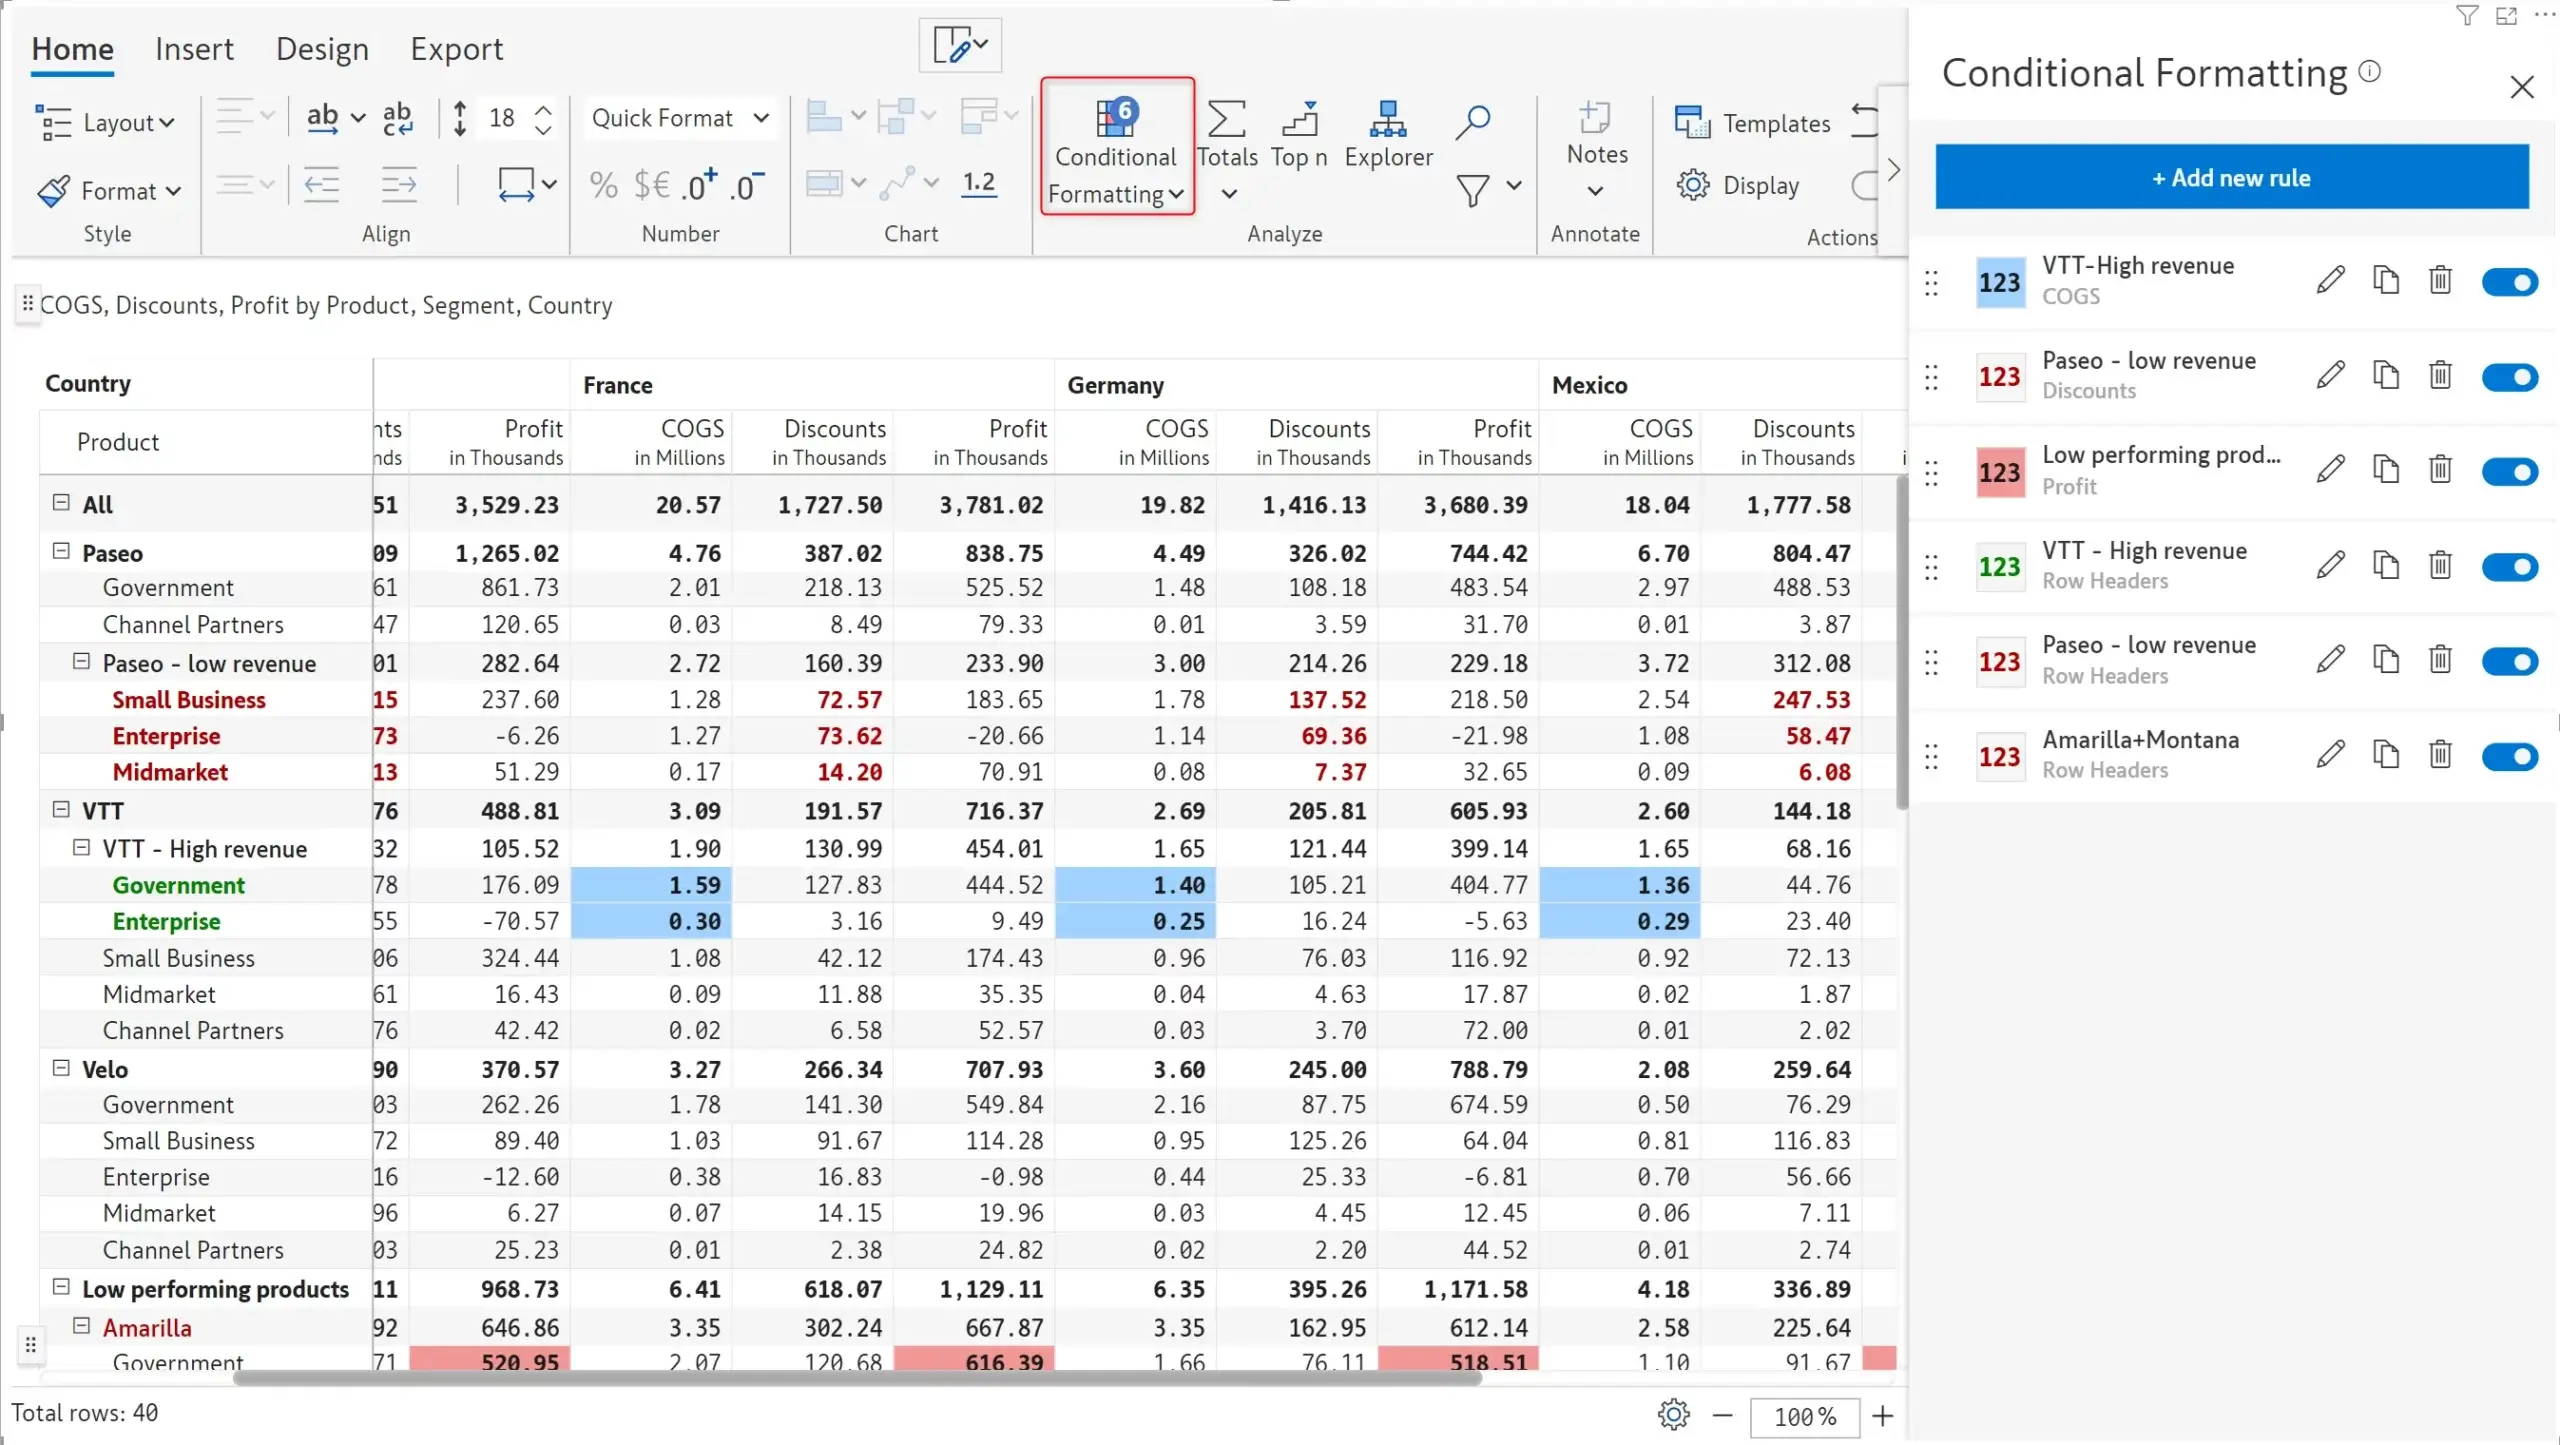
In the image below, notice how formatting has been applied for the “Low performing products” group: a background color has been applied and the values are in bold for the Profit measure.
Inforiver’s new on-load scripting feature enables you to list a set of actions to be performed on loading the visual. You can display messages, set the layout, hide columns, or apply filters as the visual is loaded. The scripts will be executed when you open the report, switch to the tab containing the visual or refresh the visual. Inforiver offers an array of built-in functions that you can use to effortlessly set up scripts.
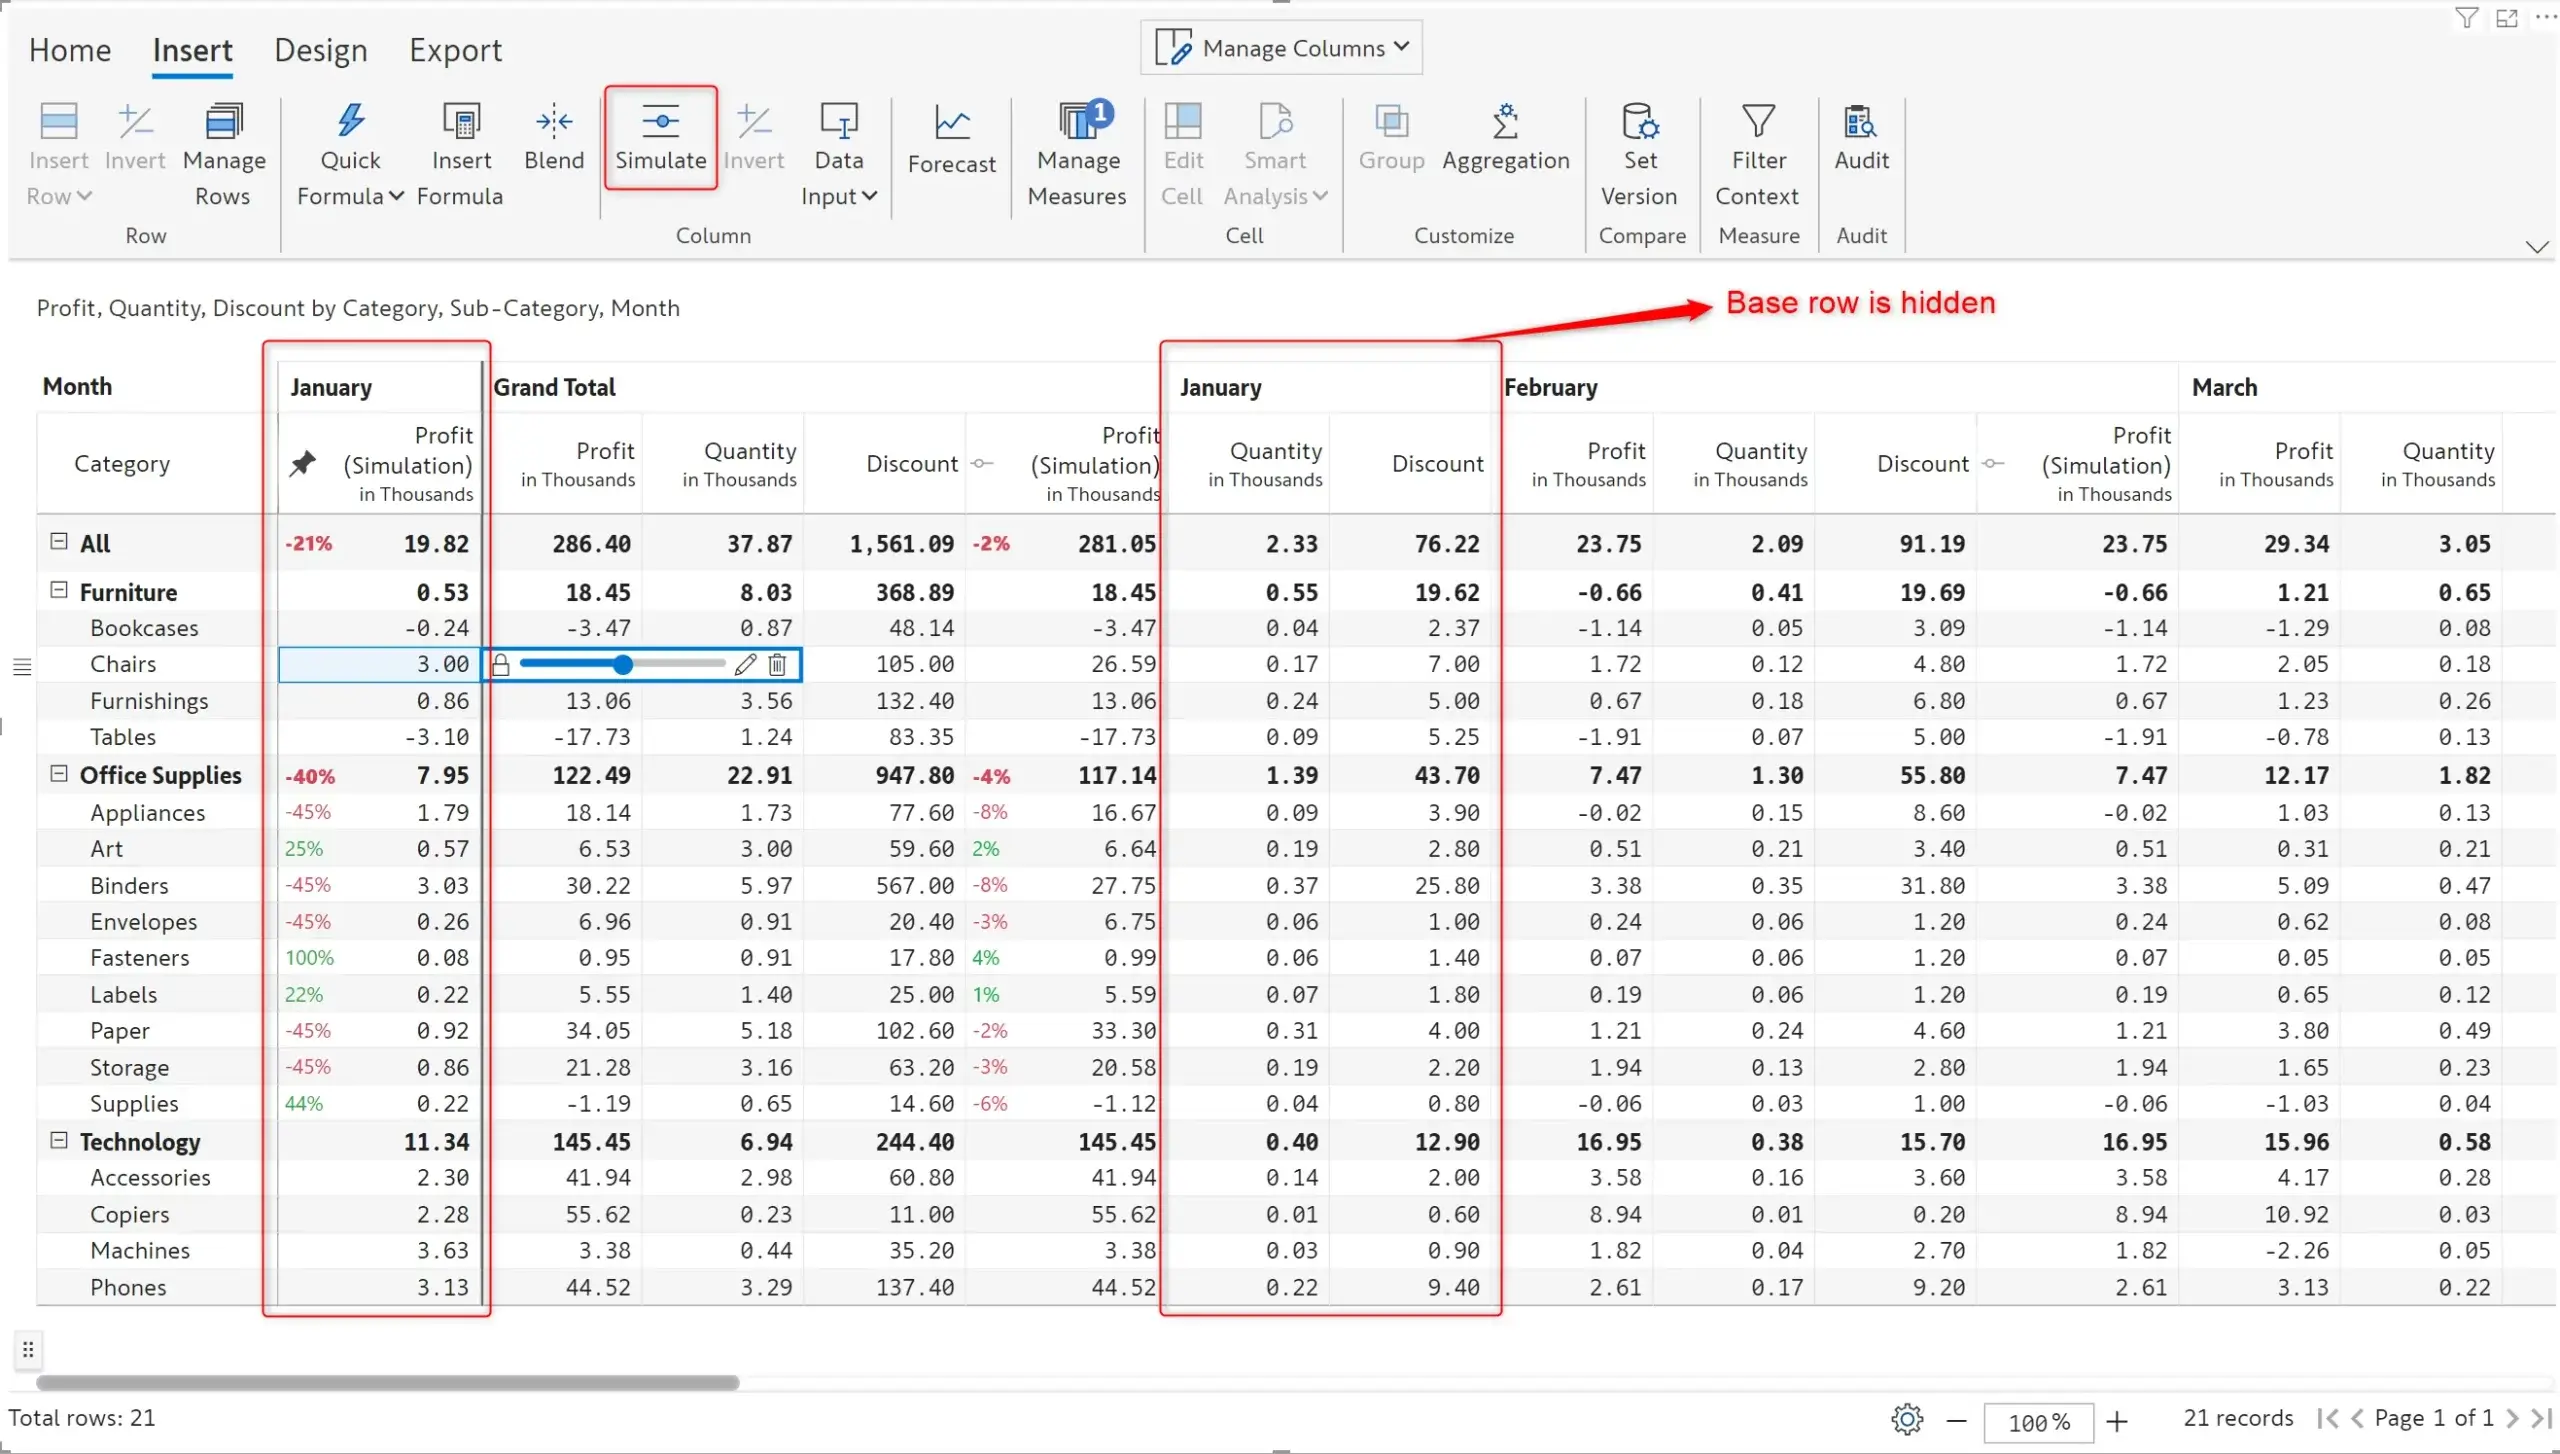
Inforiver’s pin rows feature enables you to tag important rows in your data at the top of your report. Using this feature creates duplicate rows in the visual level (there is no change to your data). In the report below, notice how the pinned rows such as ‘Bookcases’ are repeated in the table below.
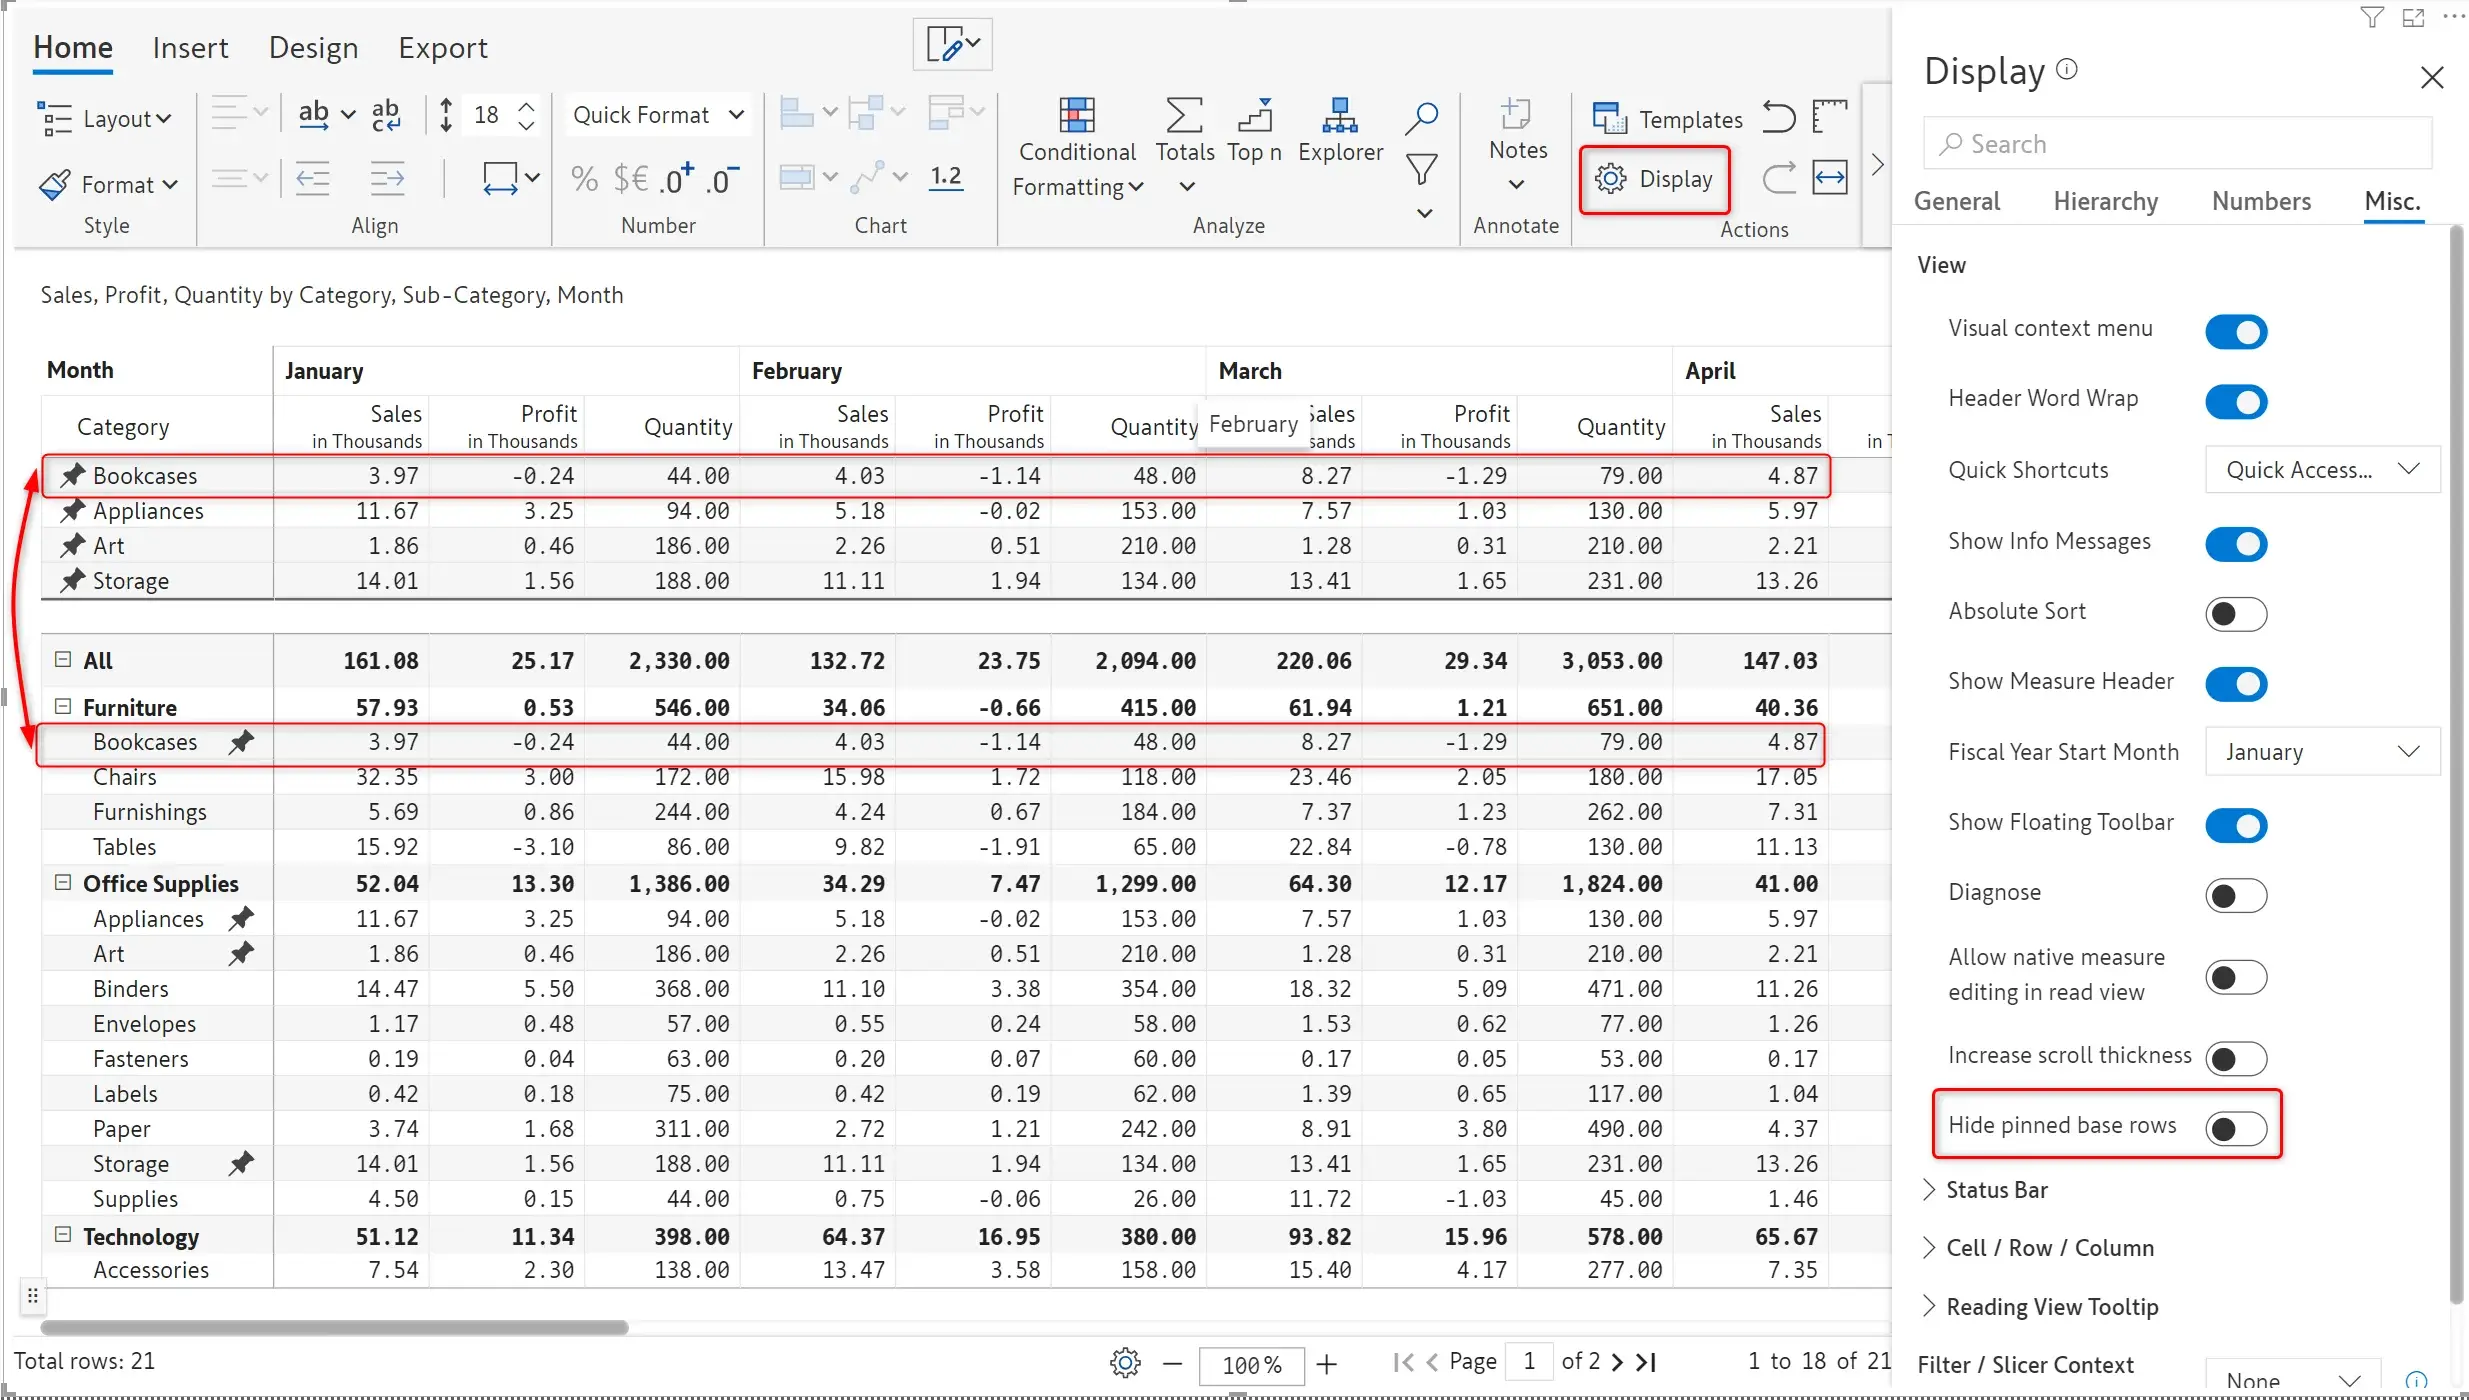
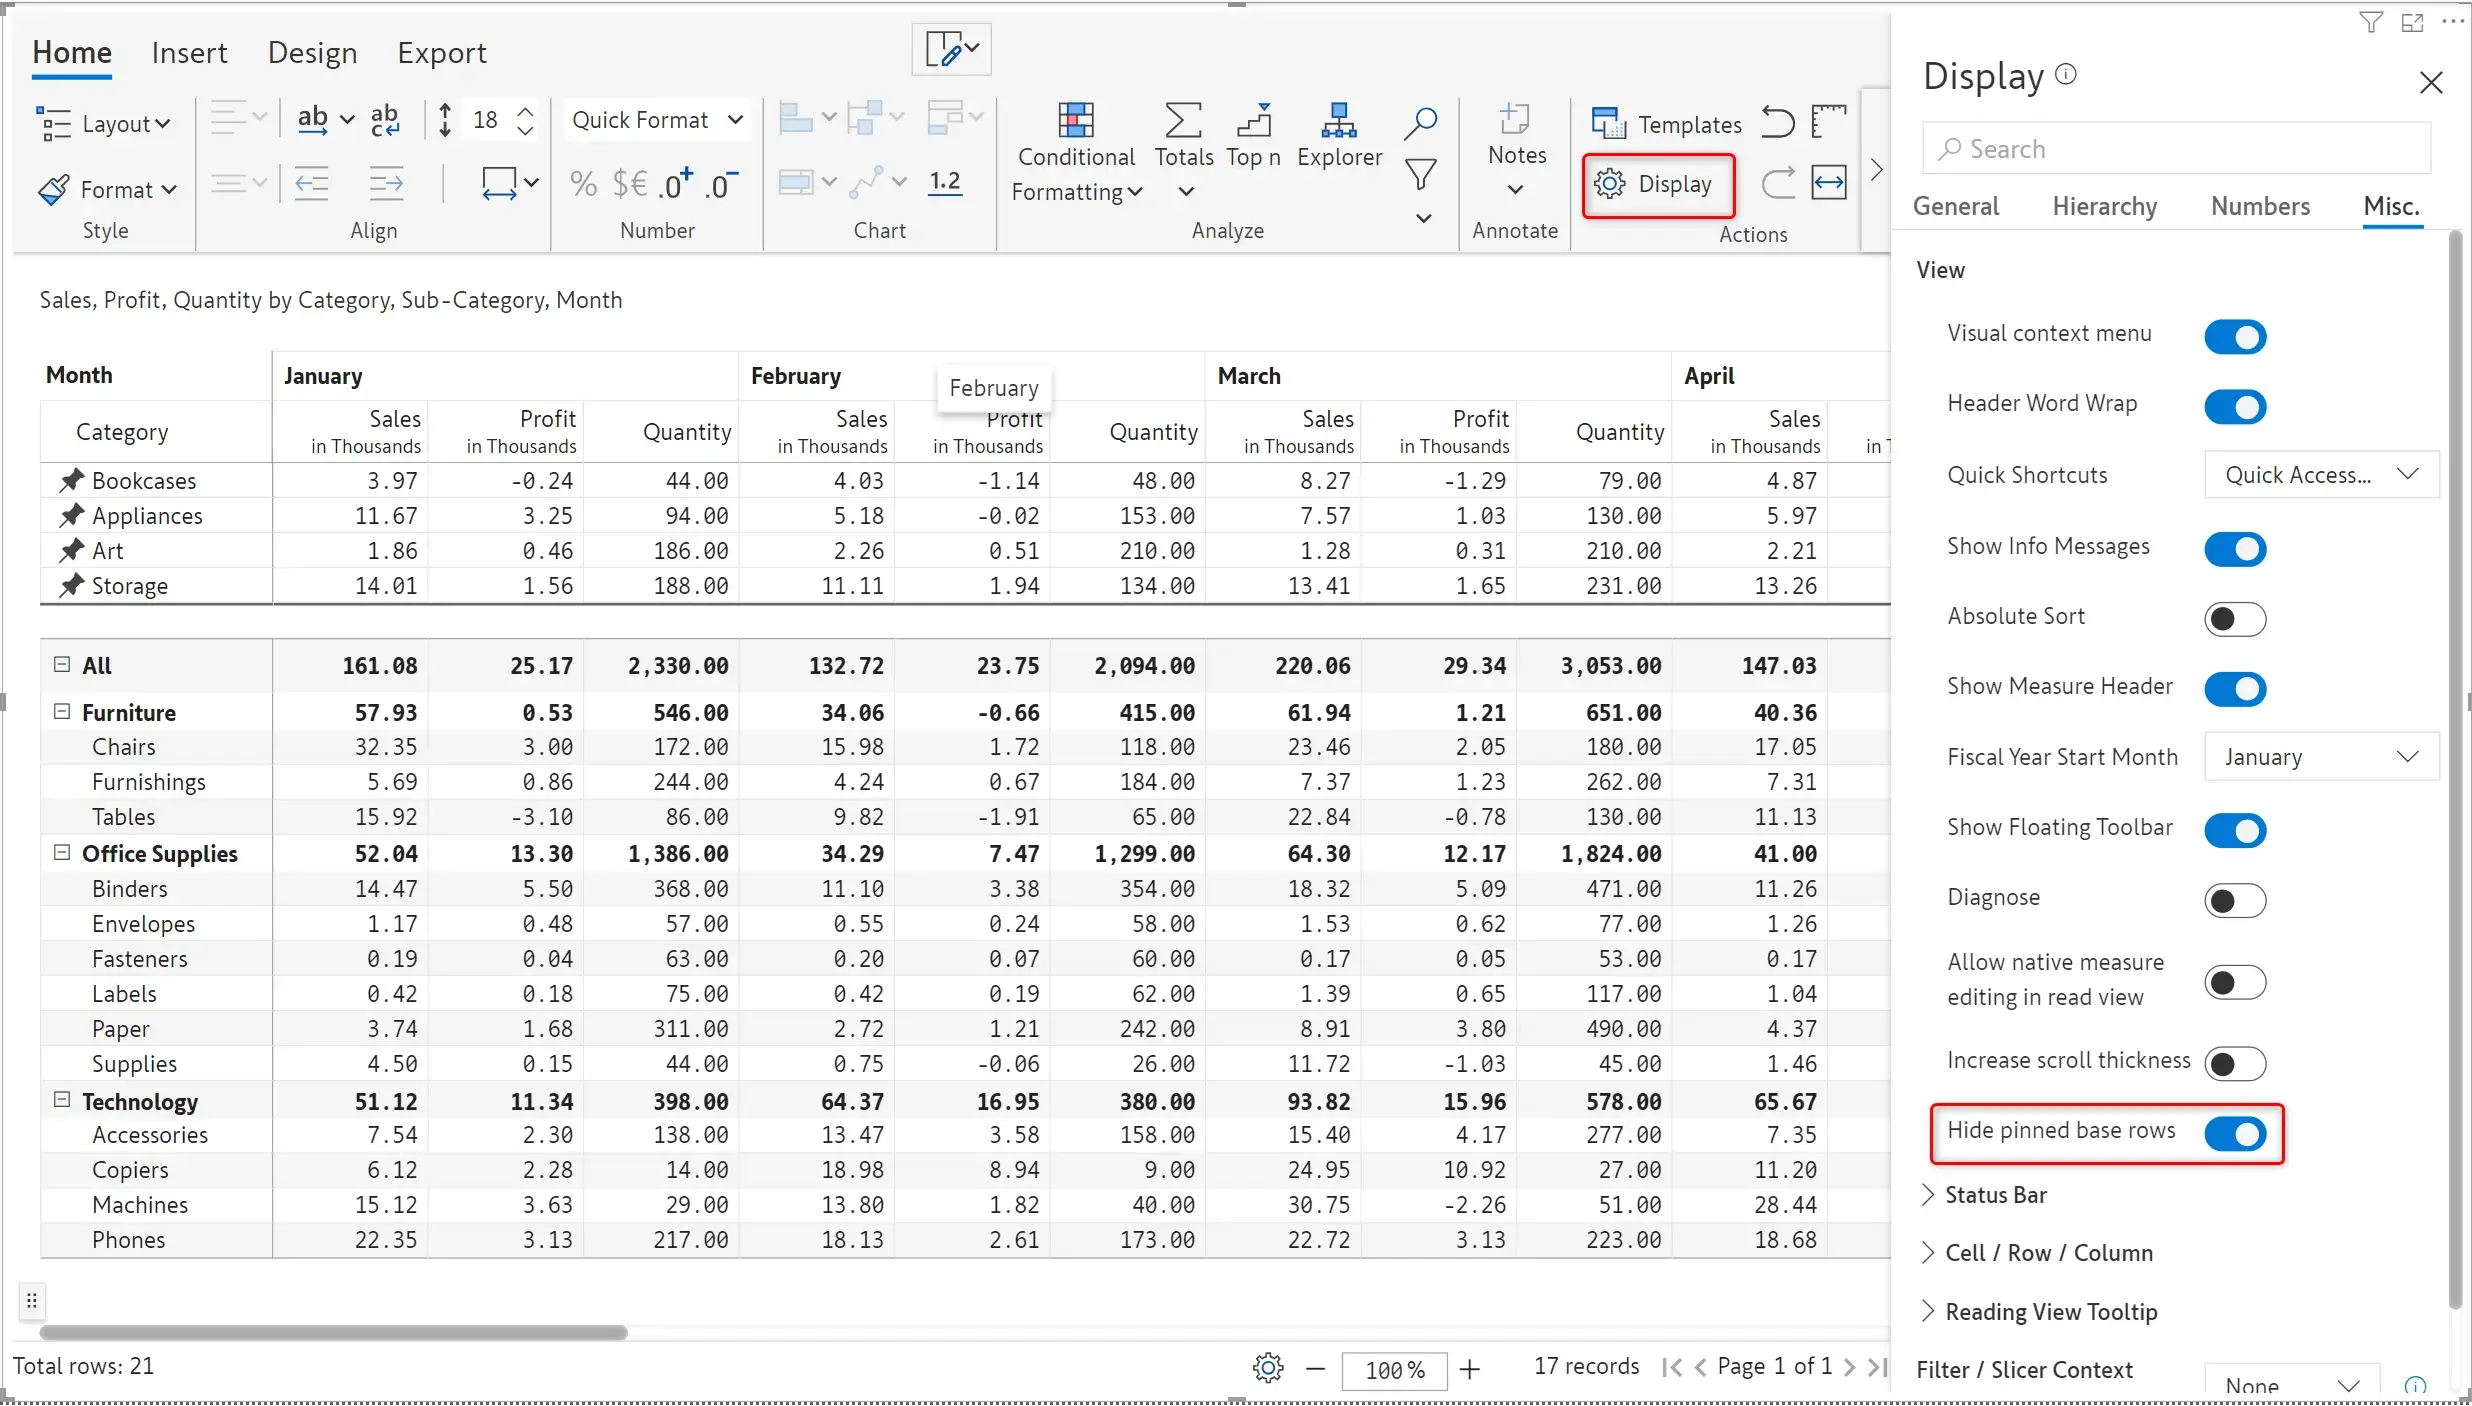
In 2.6, you can enable the Hide pinned base rows option to hide the actual row and retain only the pinned rows.
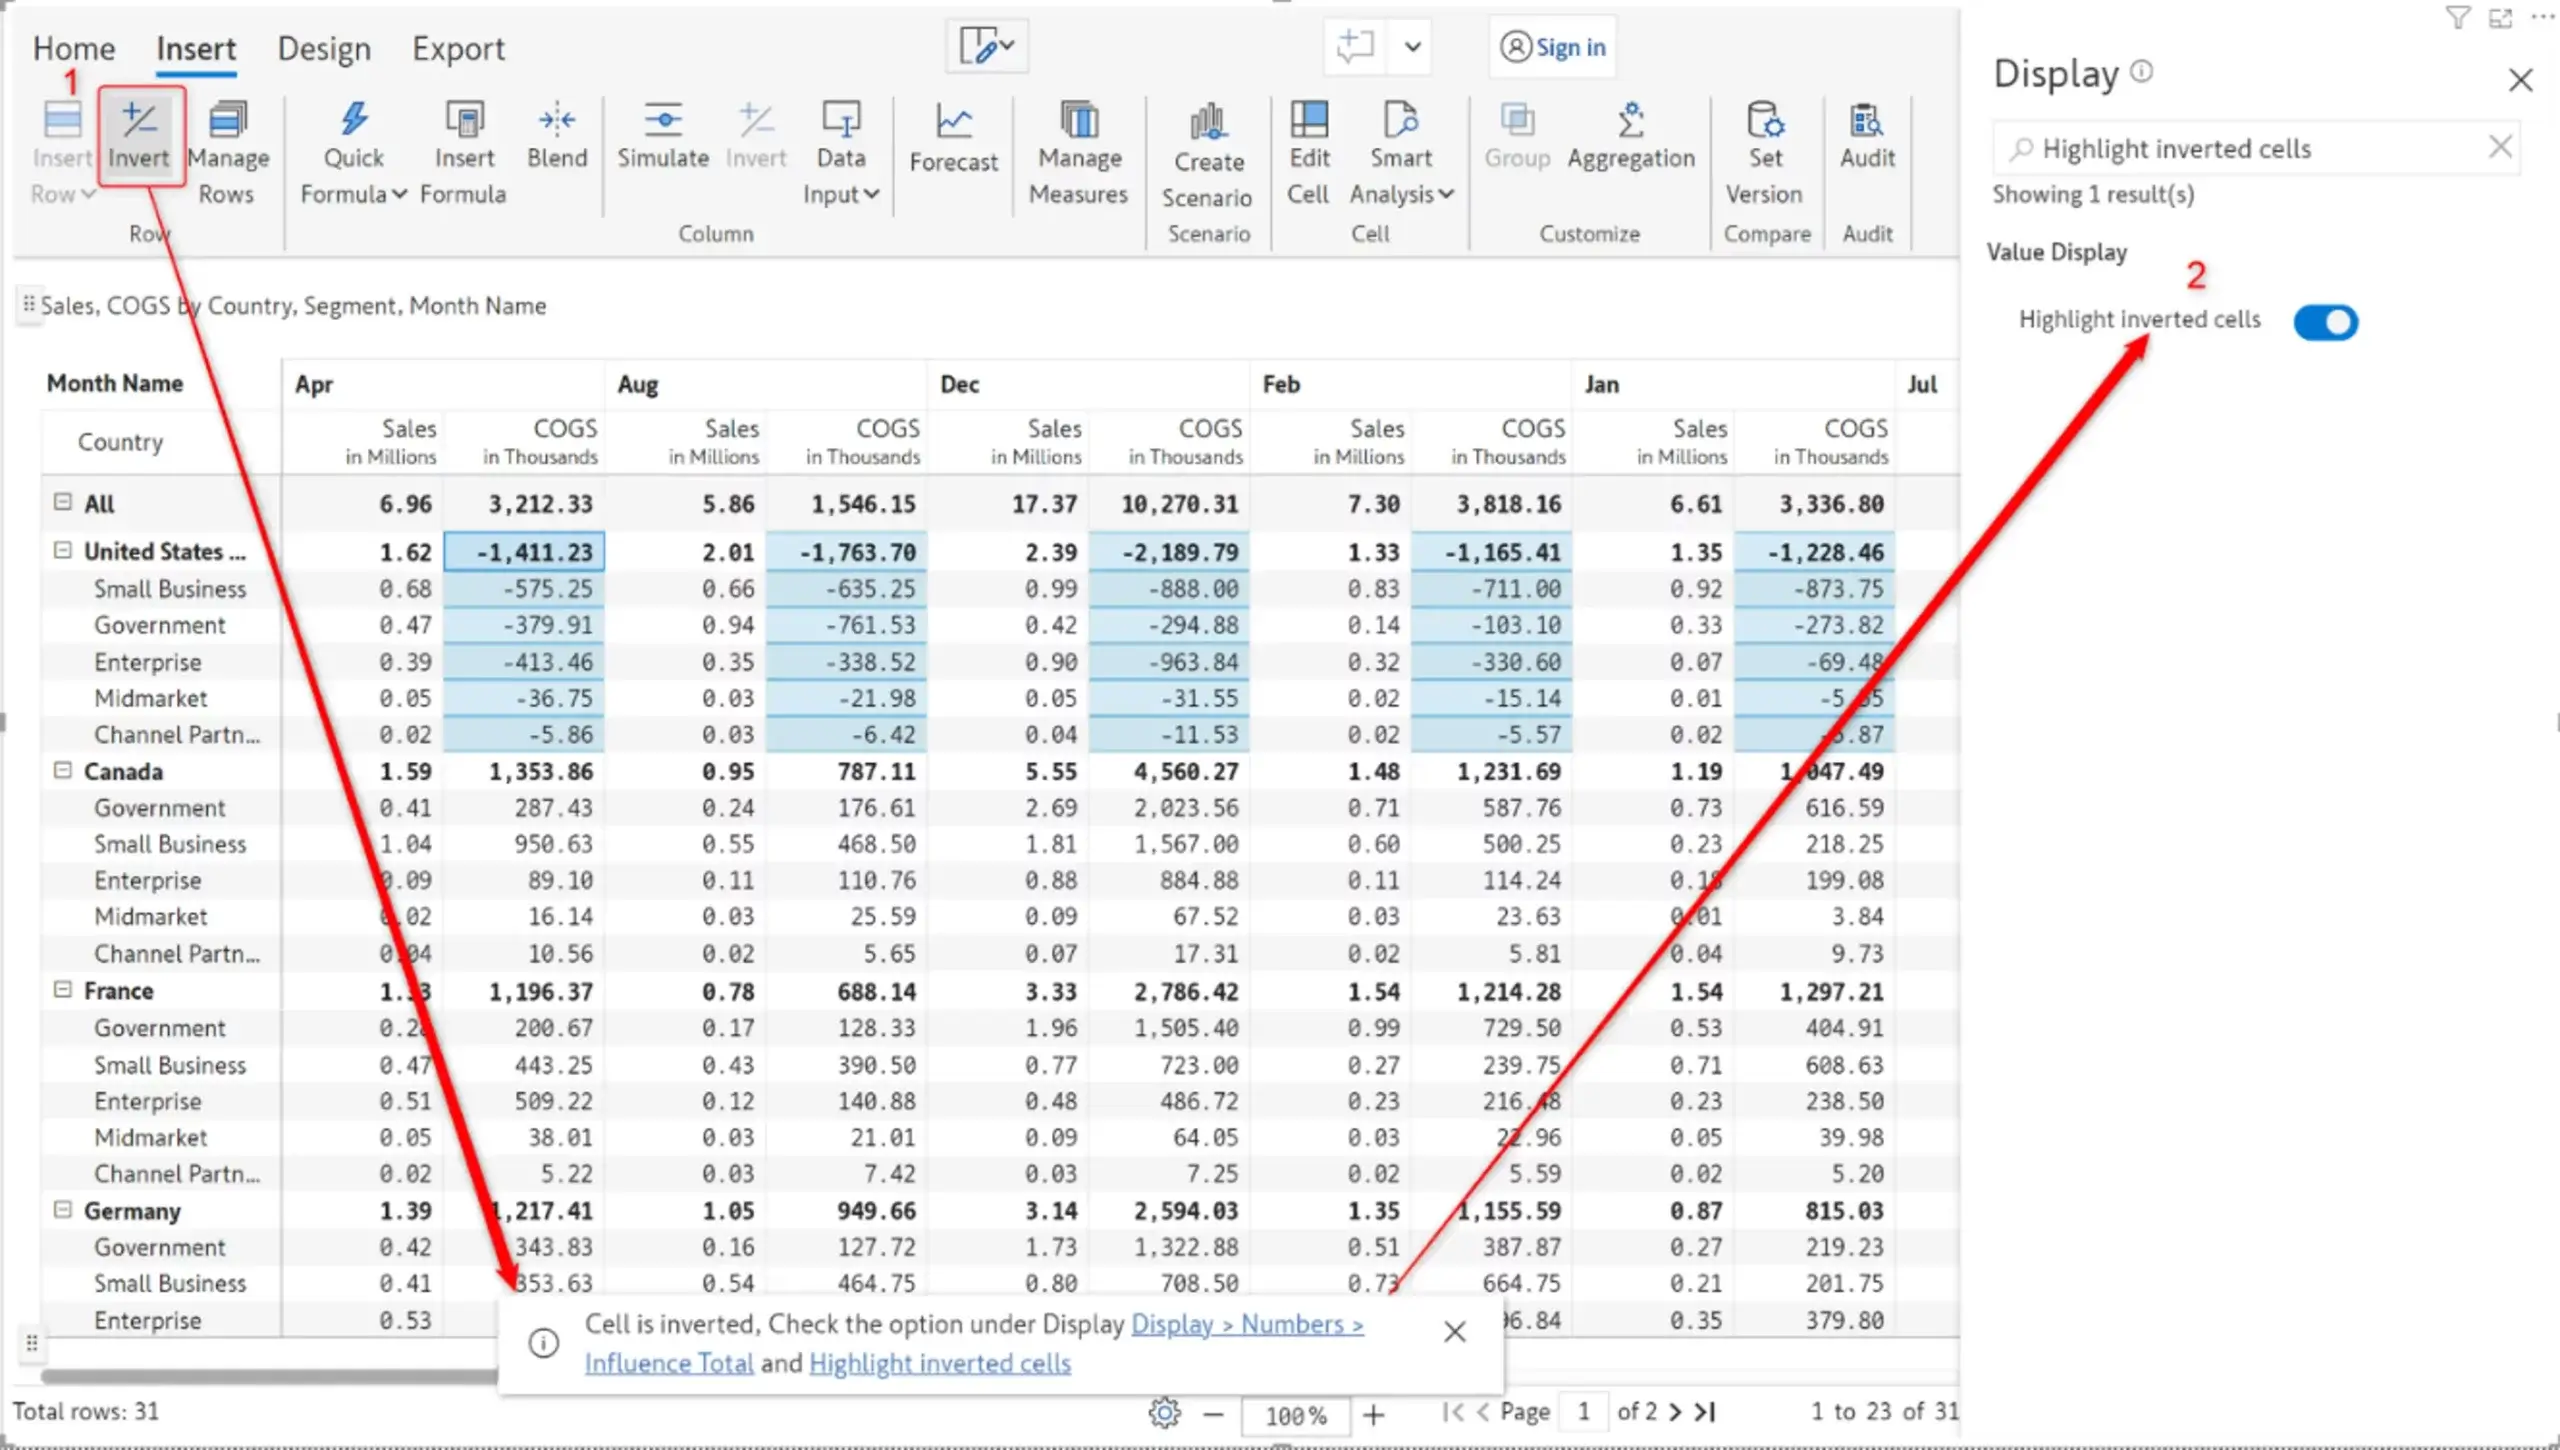
You may have manually inverted the values in your reports, for instance, an expense account. You can now choose to highlight these inverted values, indicating that manual updates have been made to the dataset.
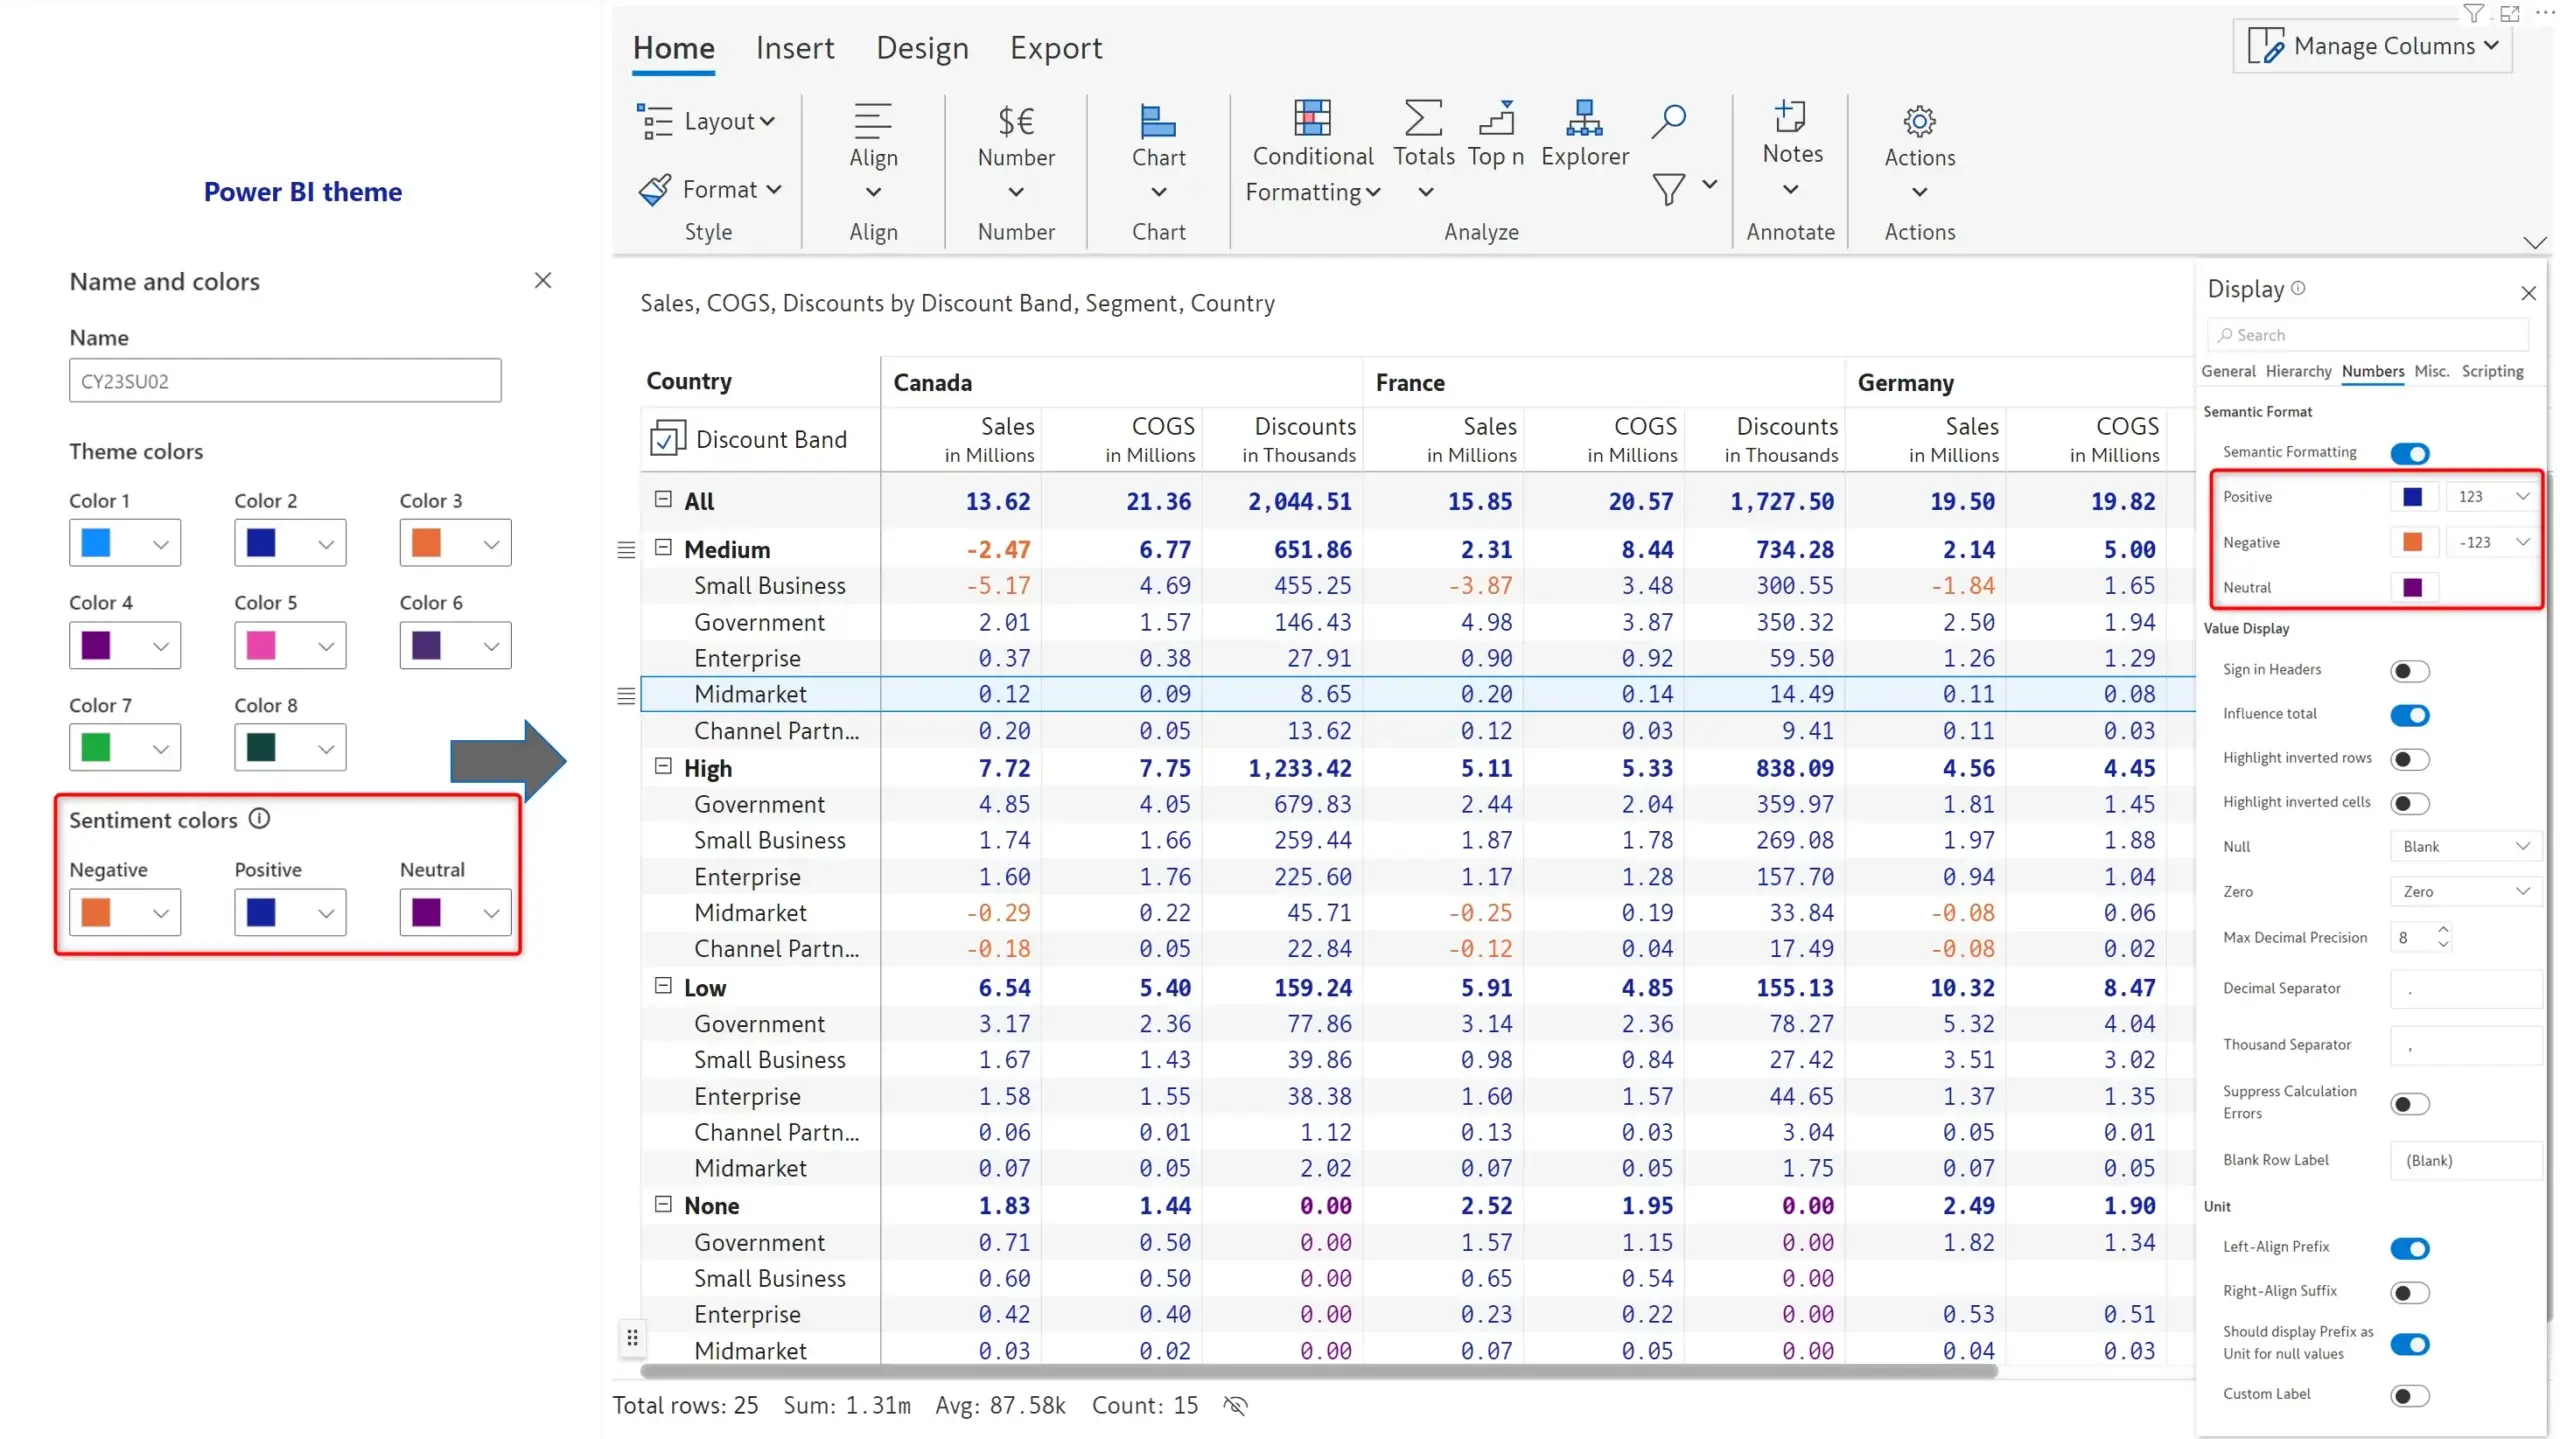
Inforiver 2.6. is designed to detect the Power BI theme and apply the same colour scheme for positive, negative, and neutral values. A ‘neutral’ colour option has also been added to emphasize zero values in your report.
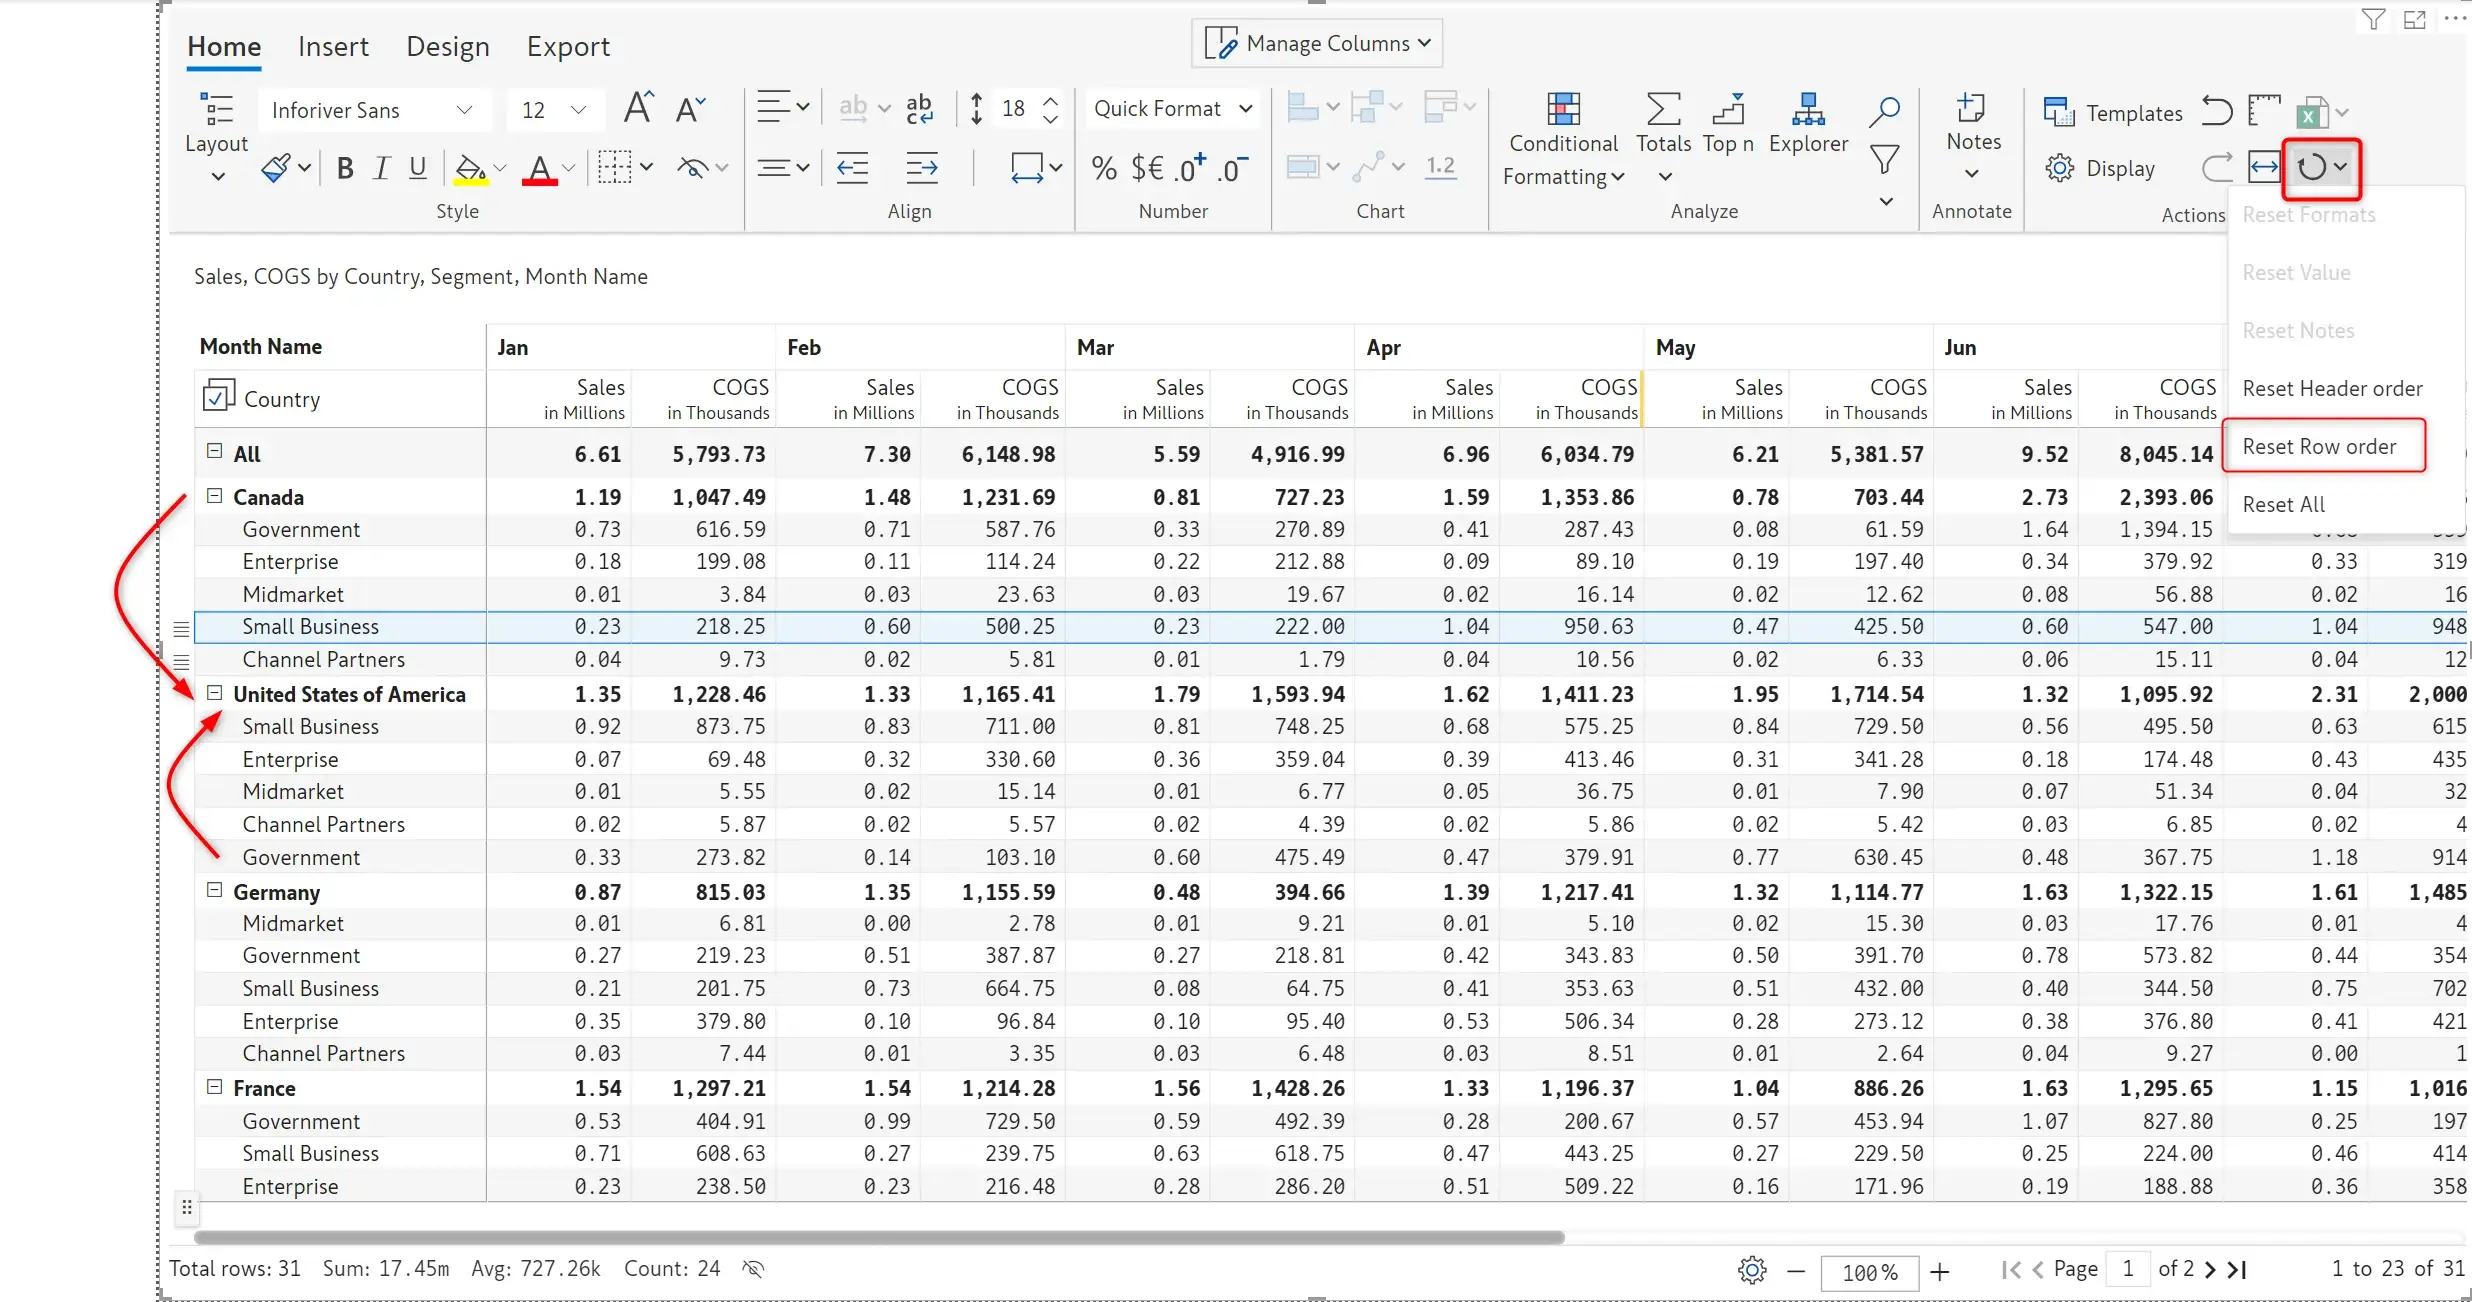
If you have re-ordered the rows in your reports, you can use this option to quickly restore the original order as configured in your Power BI data model. Note that Power BI sort cannot be used if the row order has been modified - you can apply this option if you need to revert to Power BI sorting.
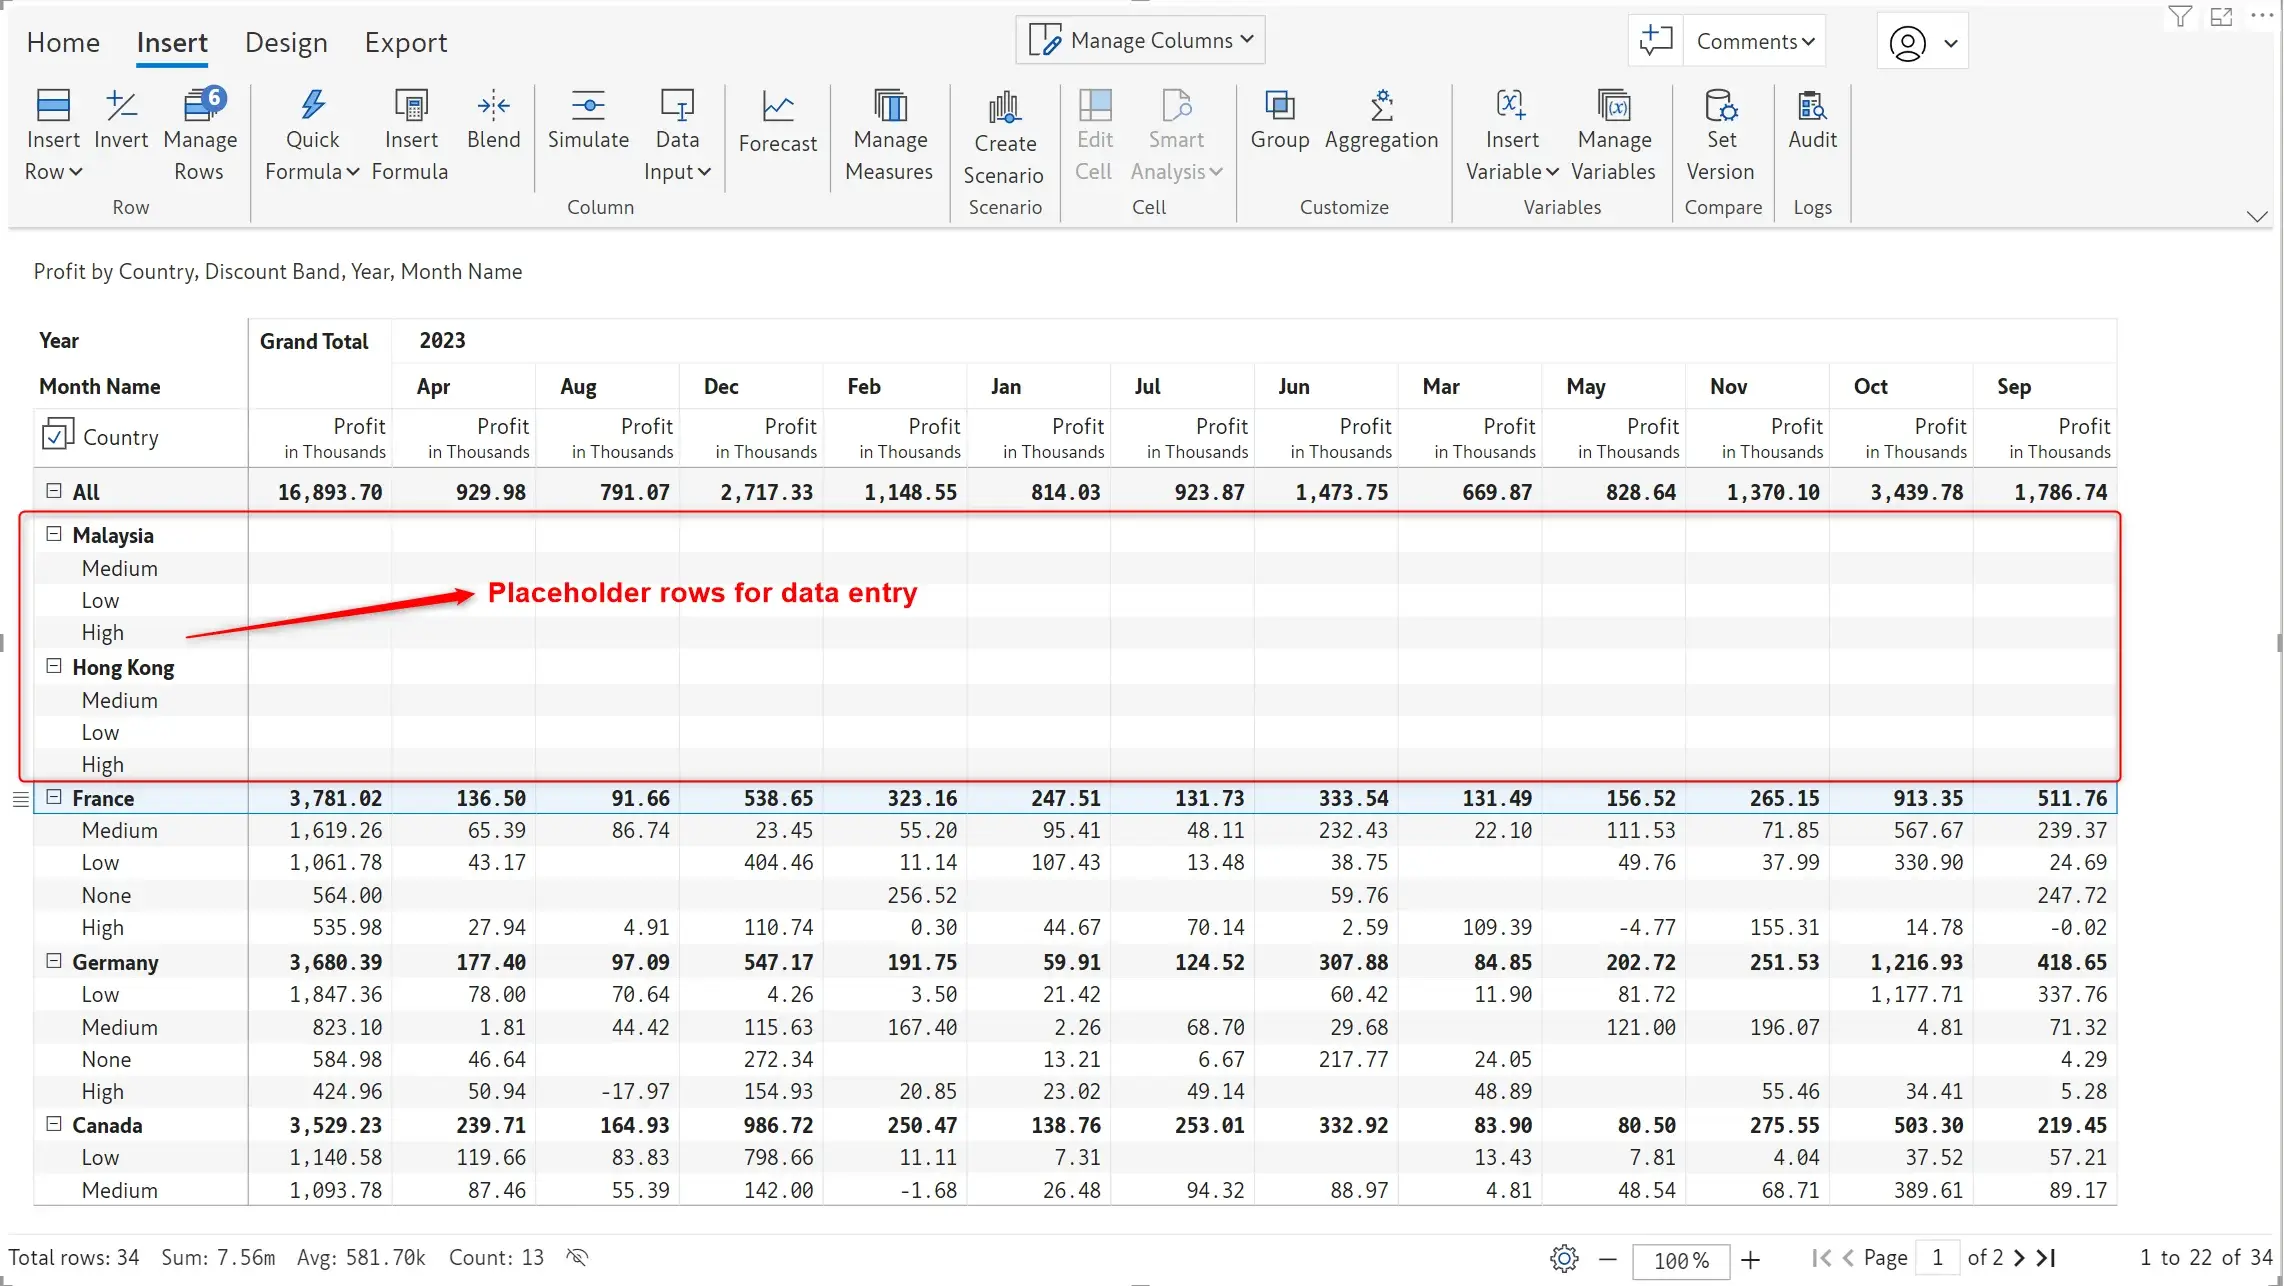
Inforiver has been providing the ability to insert rows where you can enter data manually. But what if you need to enter an entire hierarchy in your table with parents and descendants? Inforiver makes it easier for you so that you can enter an entire hierarchy in one go, rather than repeating the action. Use the ‘Multiple Static Row’ under the ‘Insert Row’ option to create a multi-level custom hierarchy with ease.
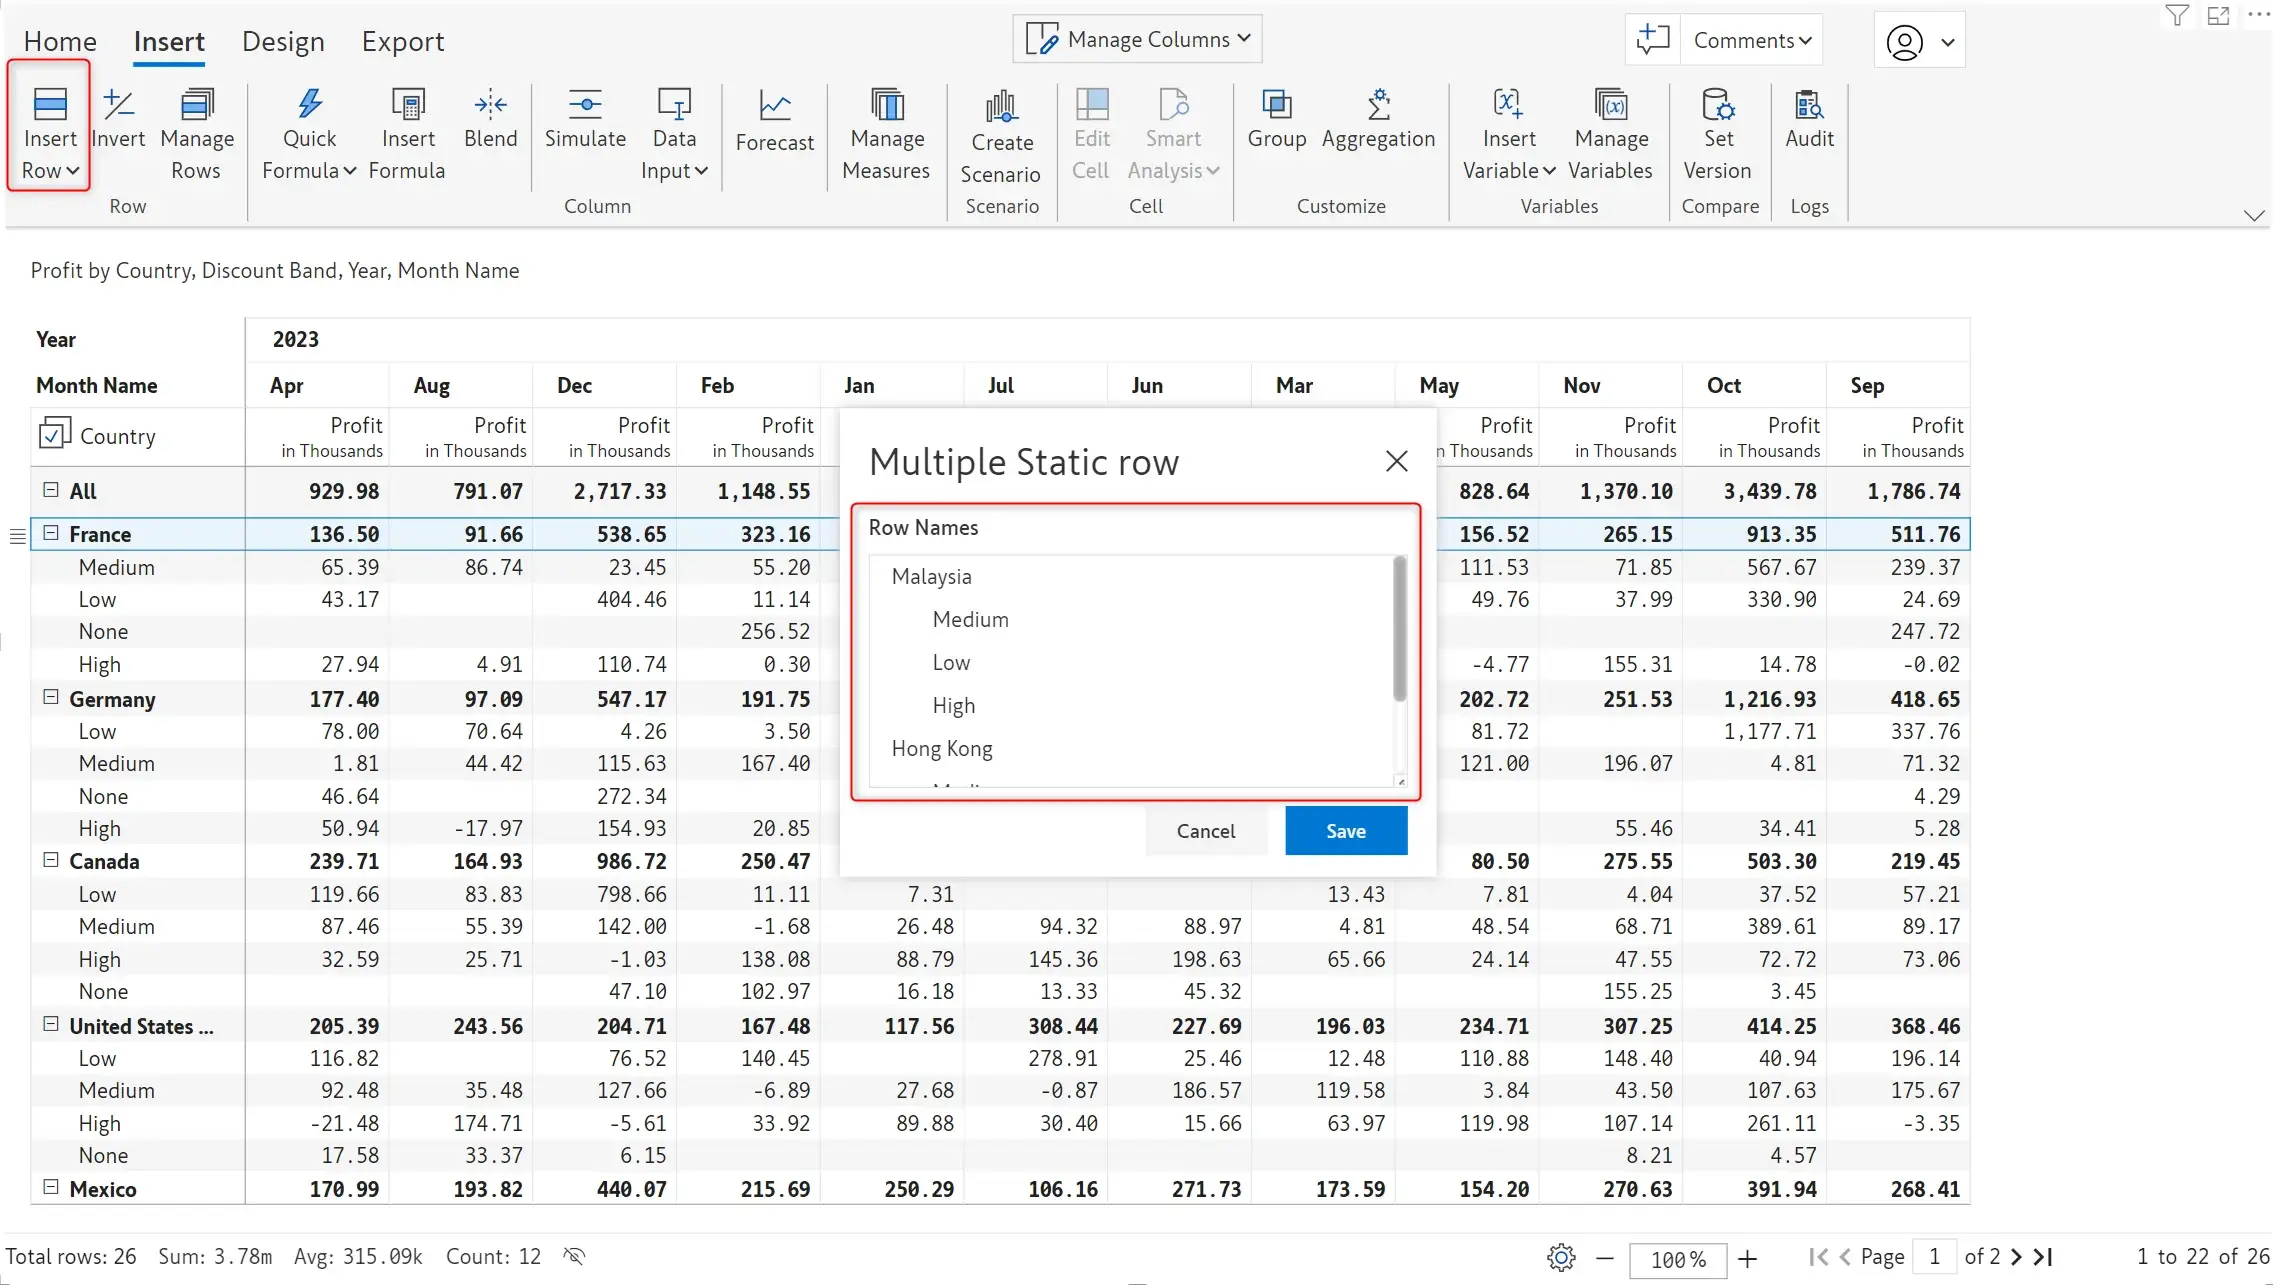
These rows can be subsequently inserted in your matrix after which you can enter data.
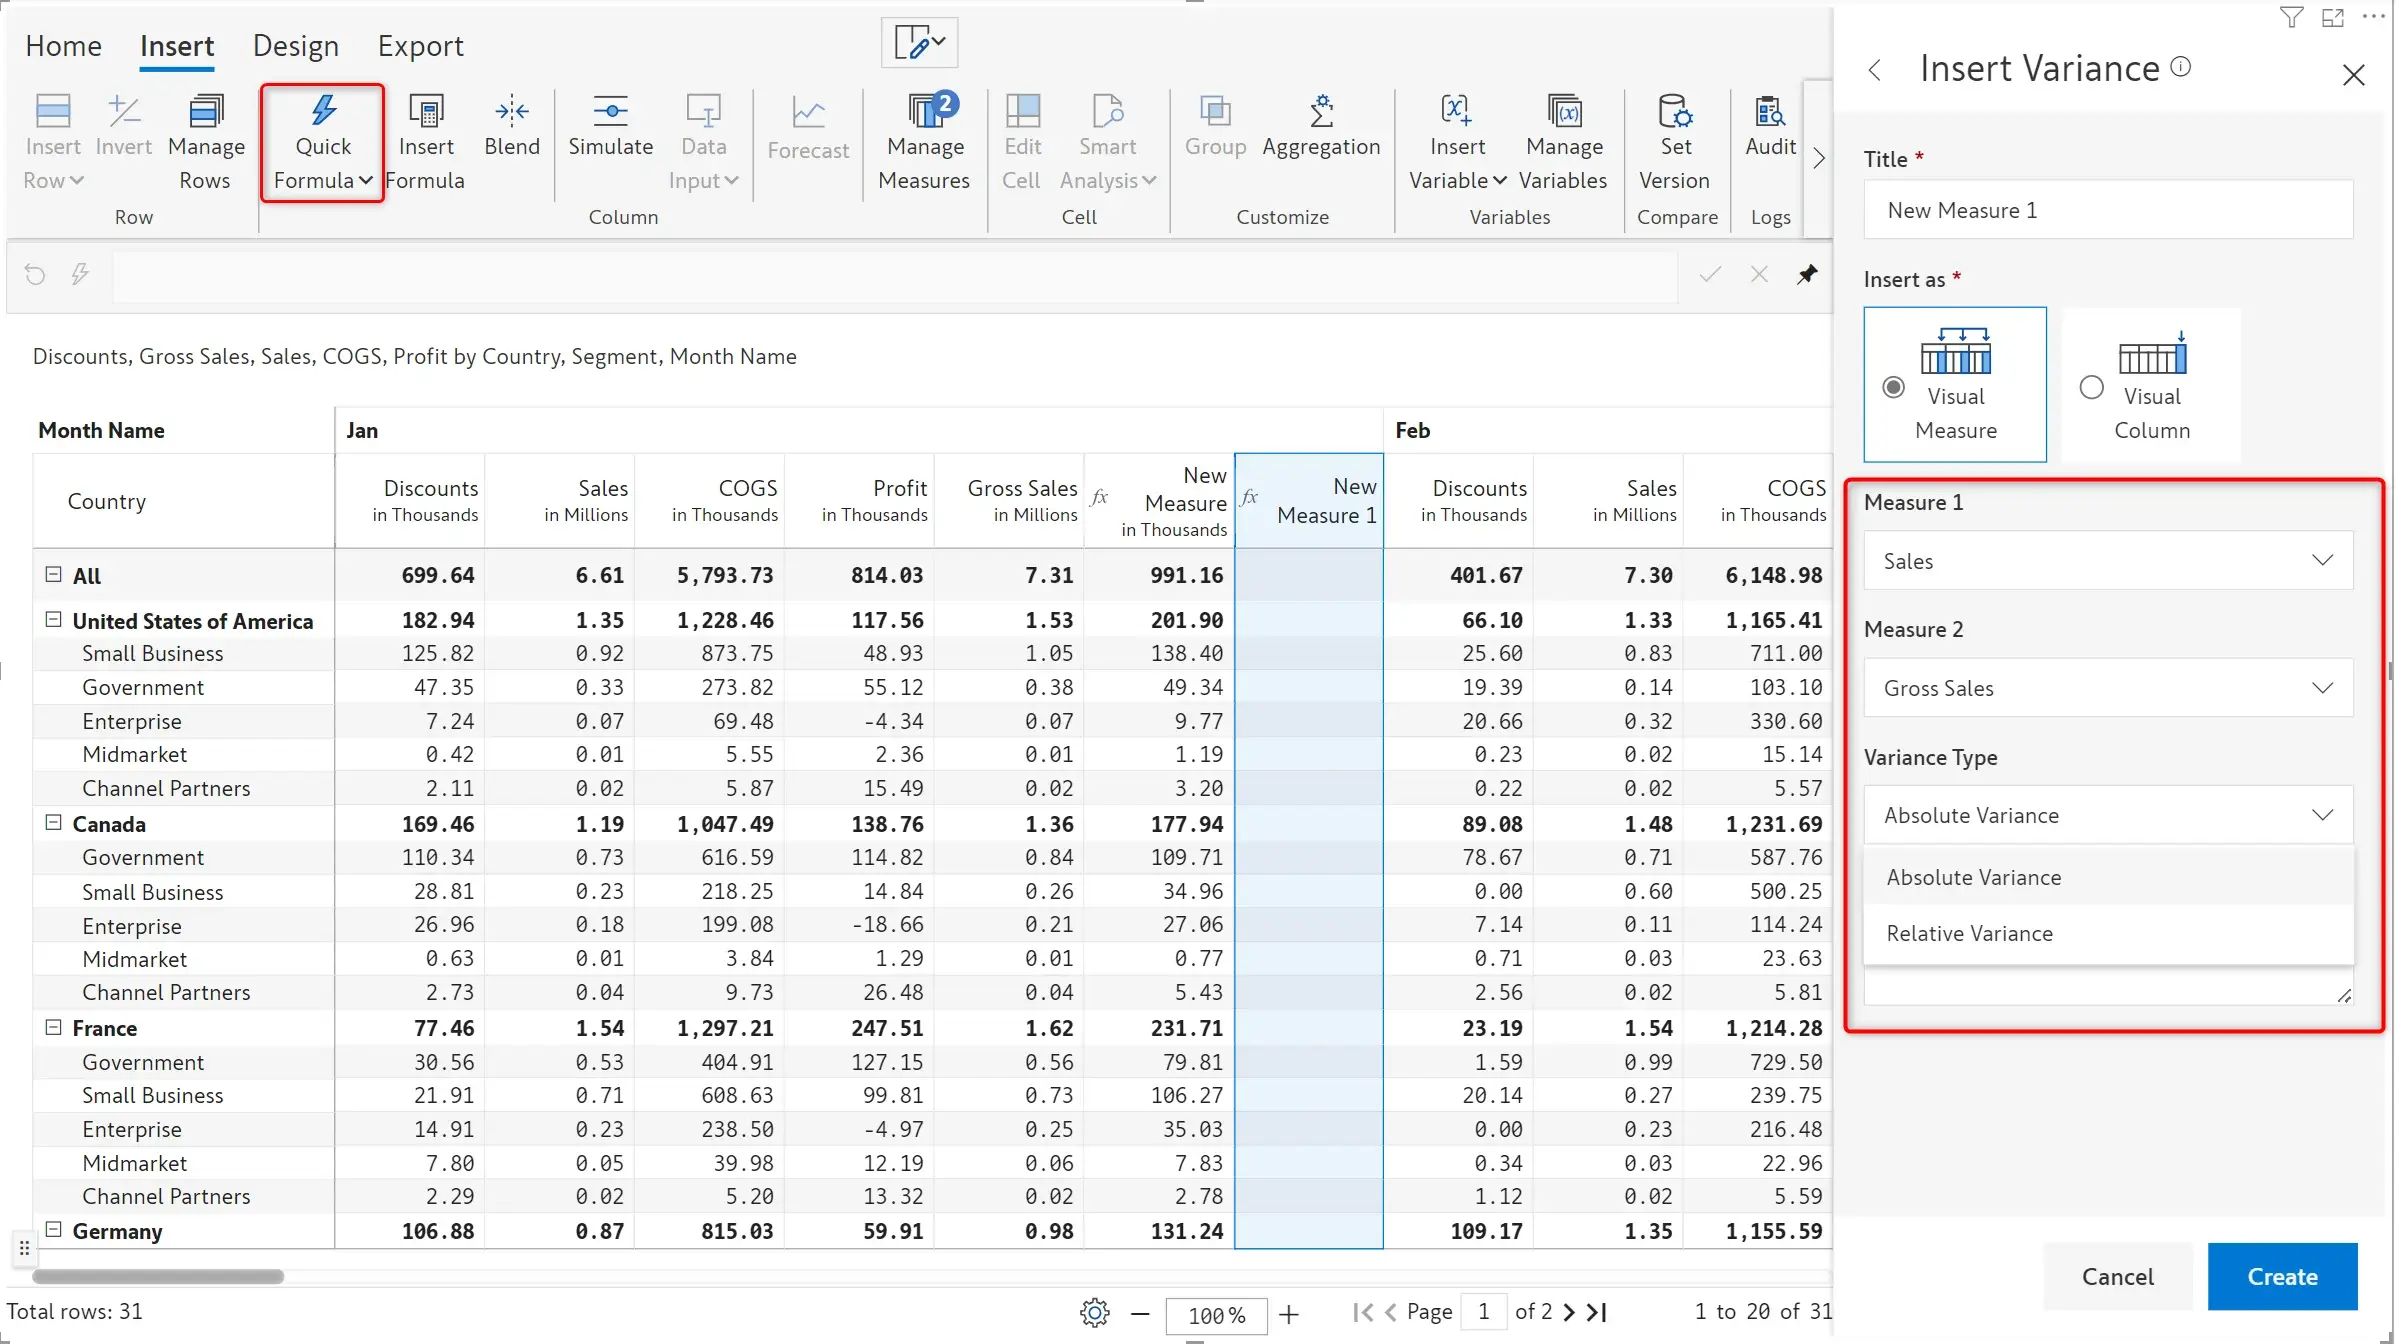
Till now, Inforiver auto-calculated variances between first measure pairs from the AC/PY/PL/FC fields (e.g., Actuals vs Forecast, Forecast vs. Budget, etc). However, to calculate variances between two measures within the same field (e.g., Forecast v1 and v2) or two measures across fields where one of measures is not the ‘first measure’ (e.g., Actuals vs. Forecast v3), you had to create a new formula measure and type in the formula.
With Inforiver 2.6, you can create such variances quickly using the Insert Variance quick formula to effortlessly calculate the variance between any pair of measures (including measures added using a formula) in your report. You can display both the absolute and relative variance.
Inforiver offers additional time-intelligence-based calculation capabilities. Your formulae can now include references to YTD, Quarter period and Last N months. Learn more about time intelligence functions.
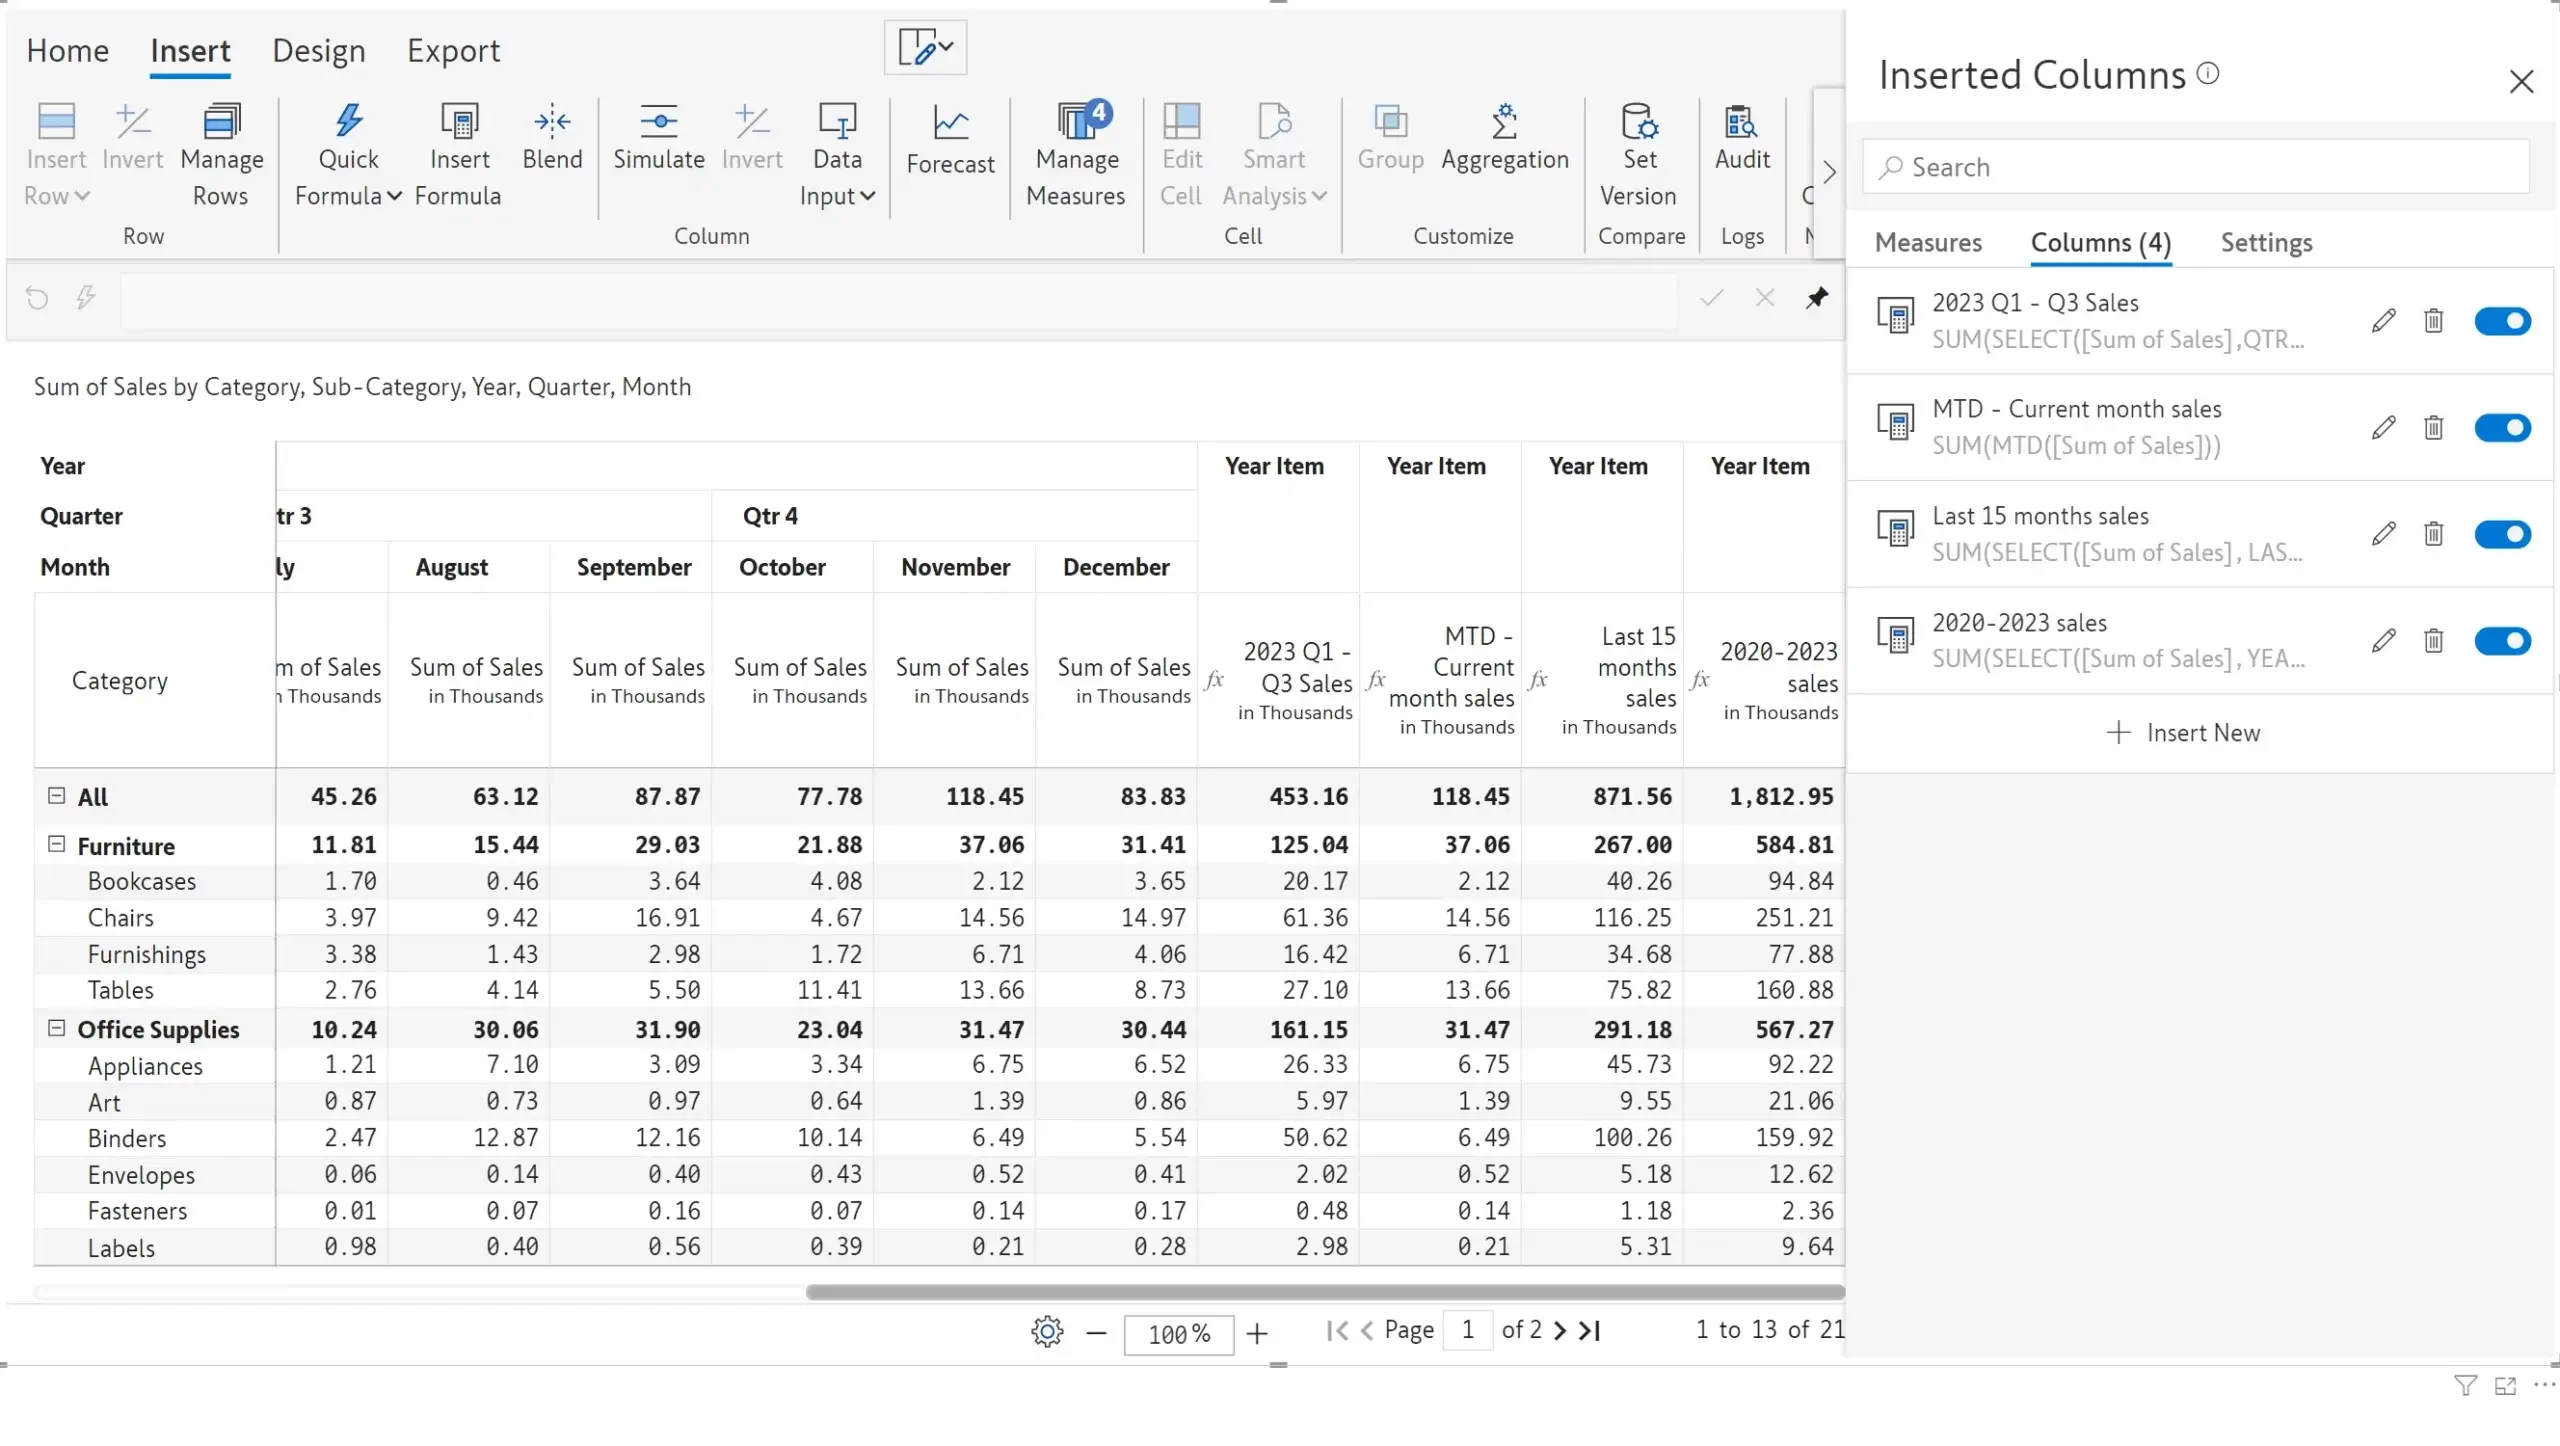
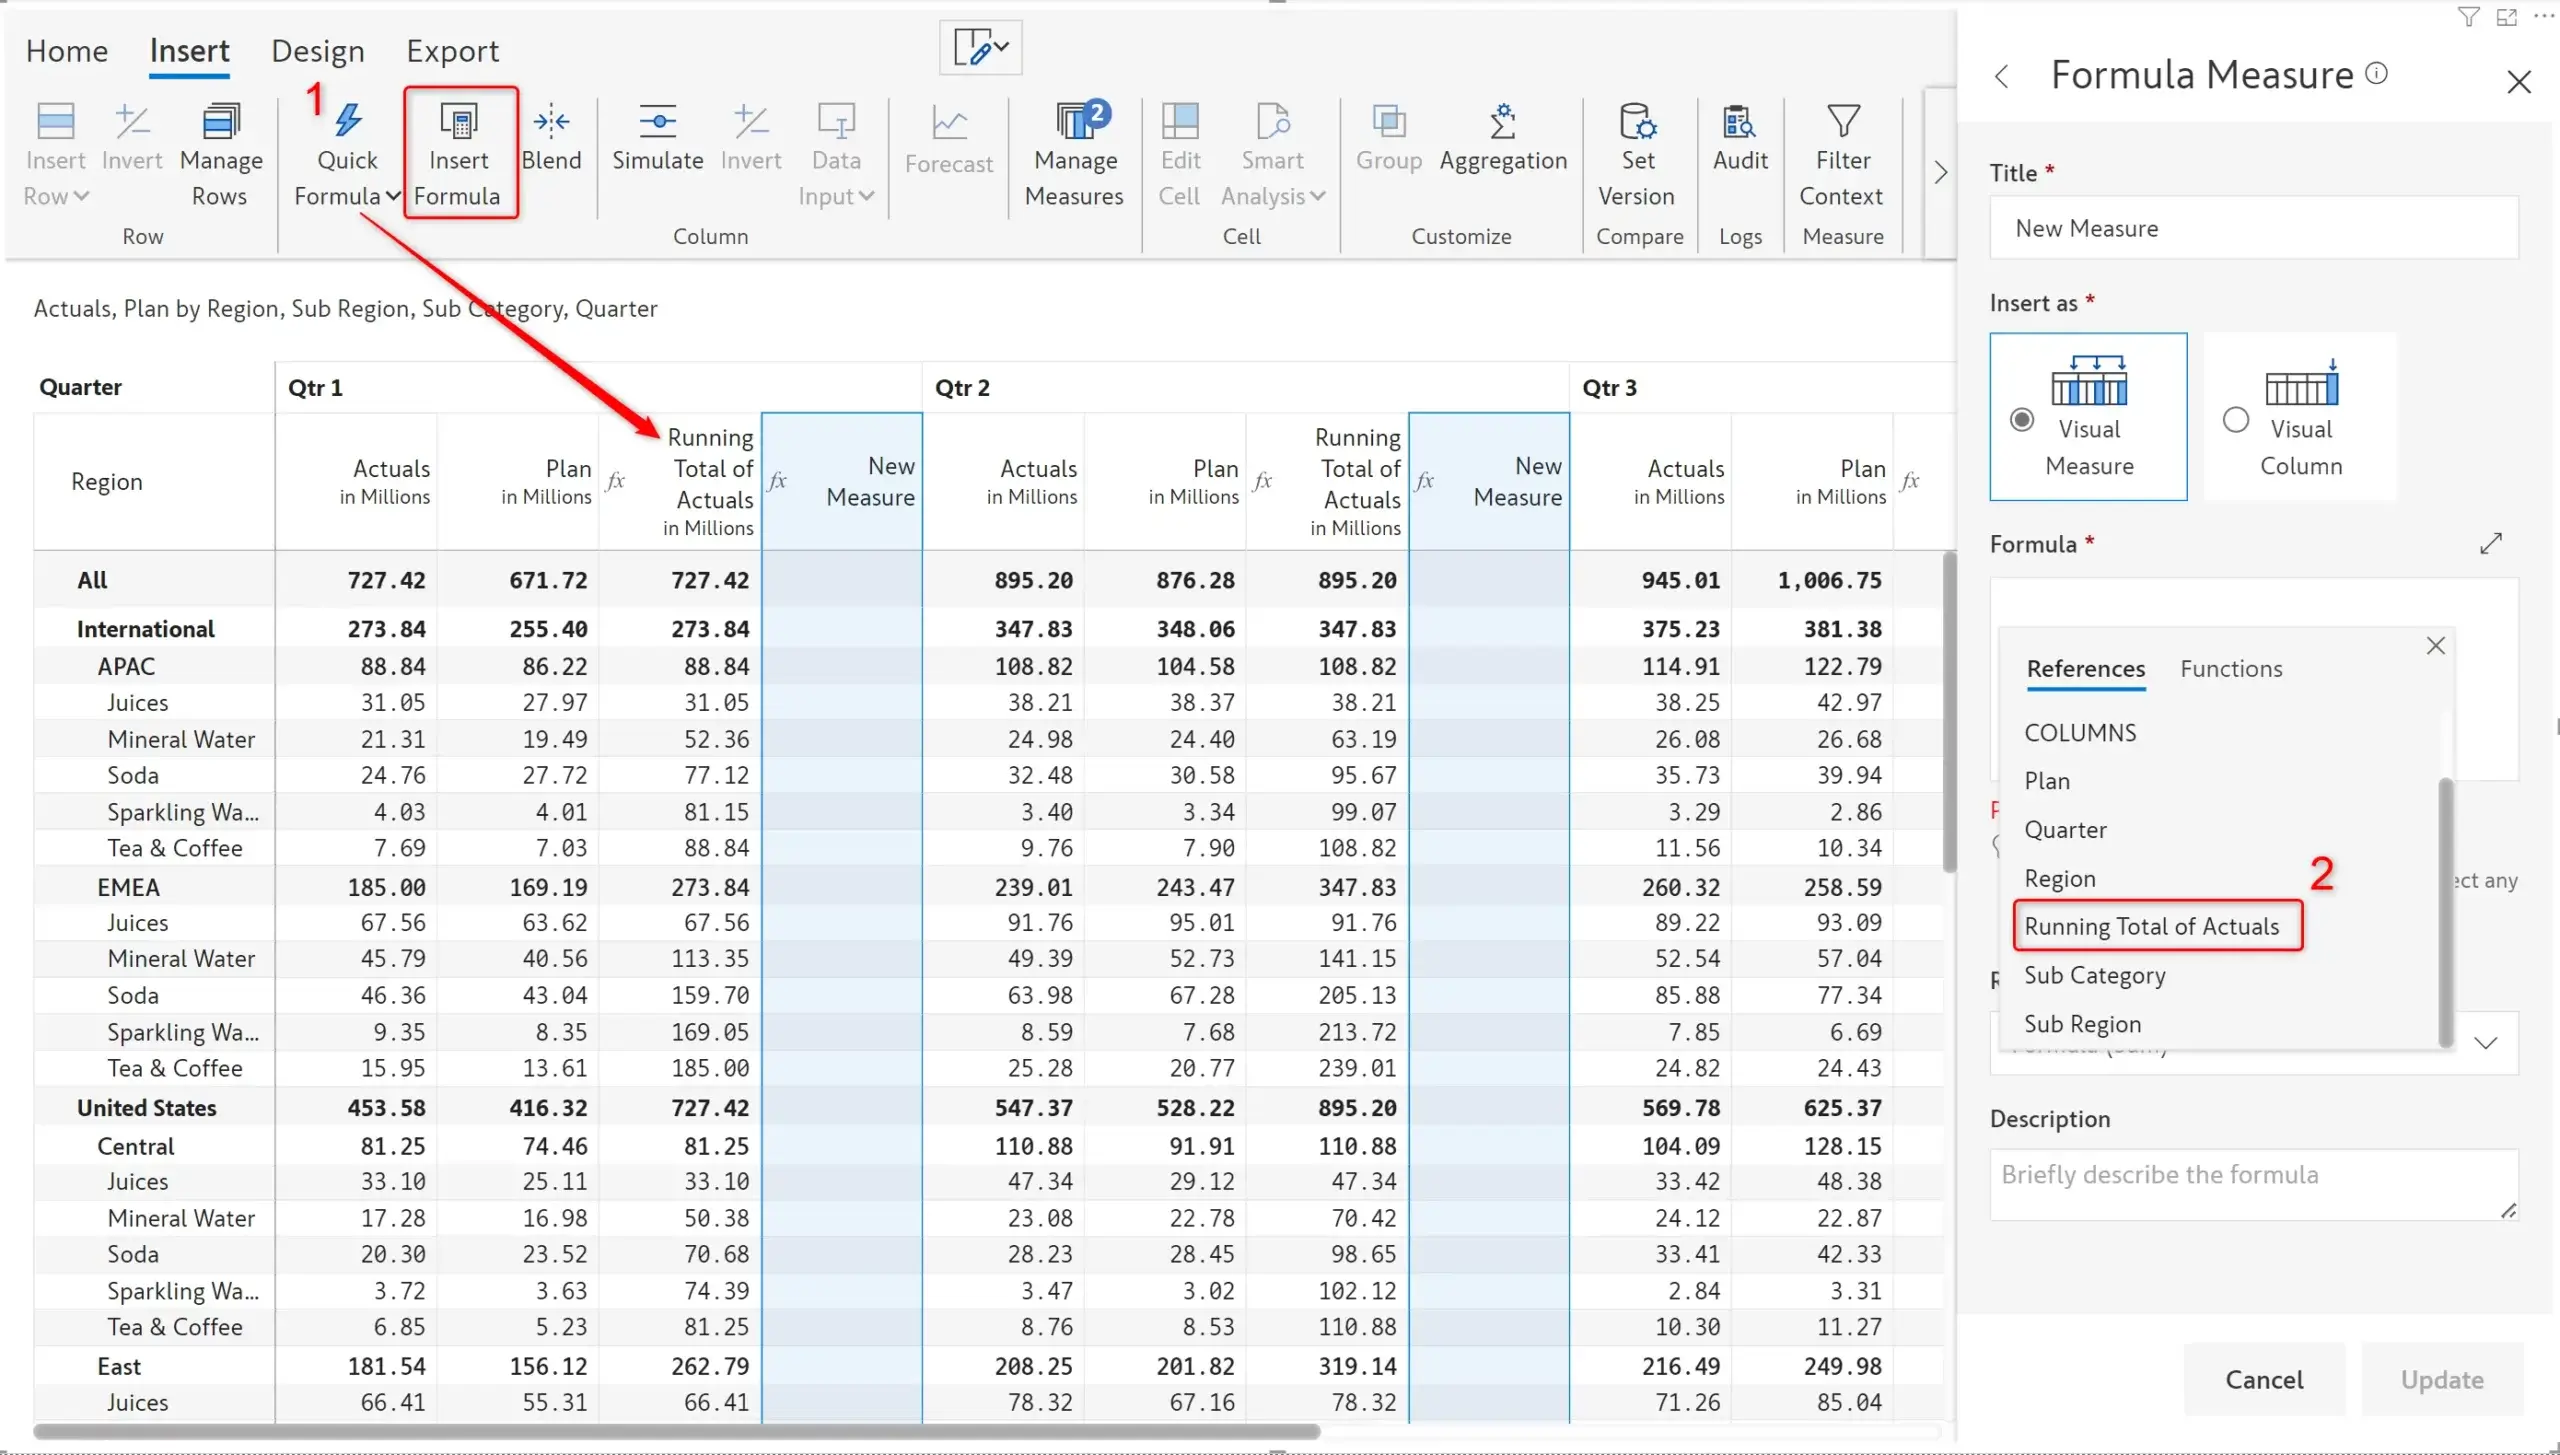
Inforiver now supports references to quick formula measures while writing a custom formula.
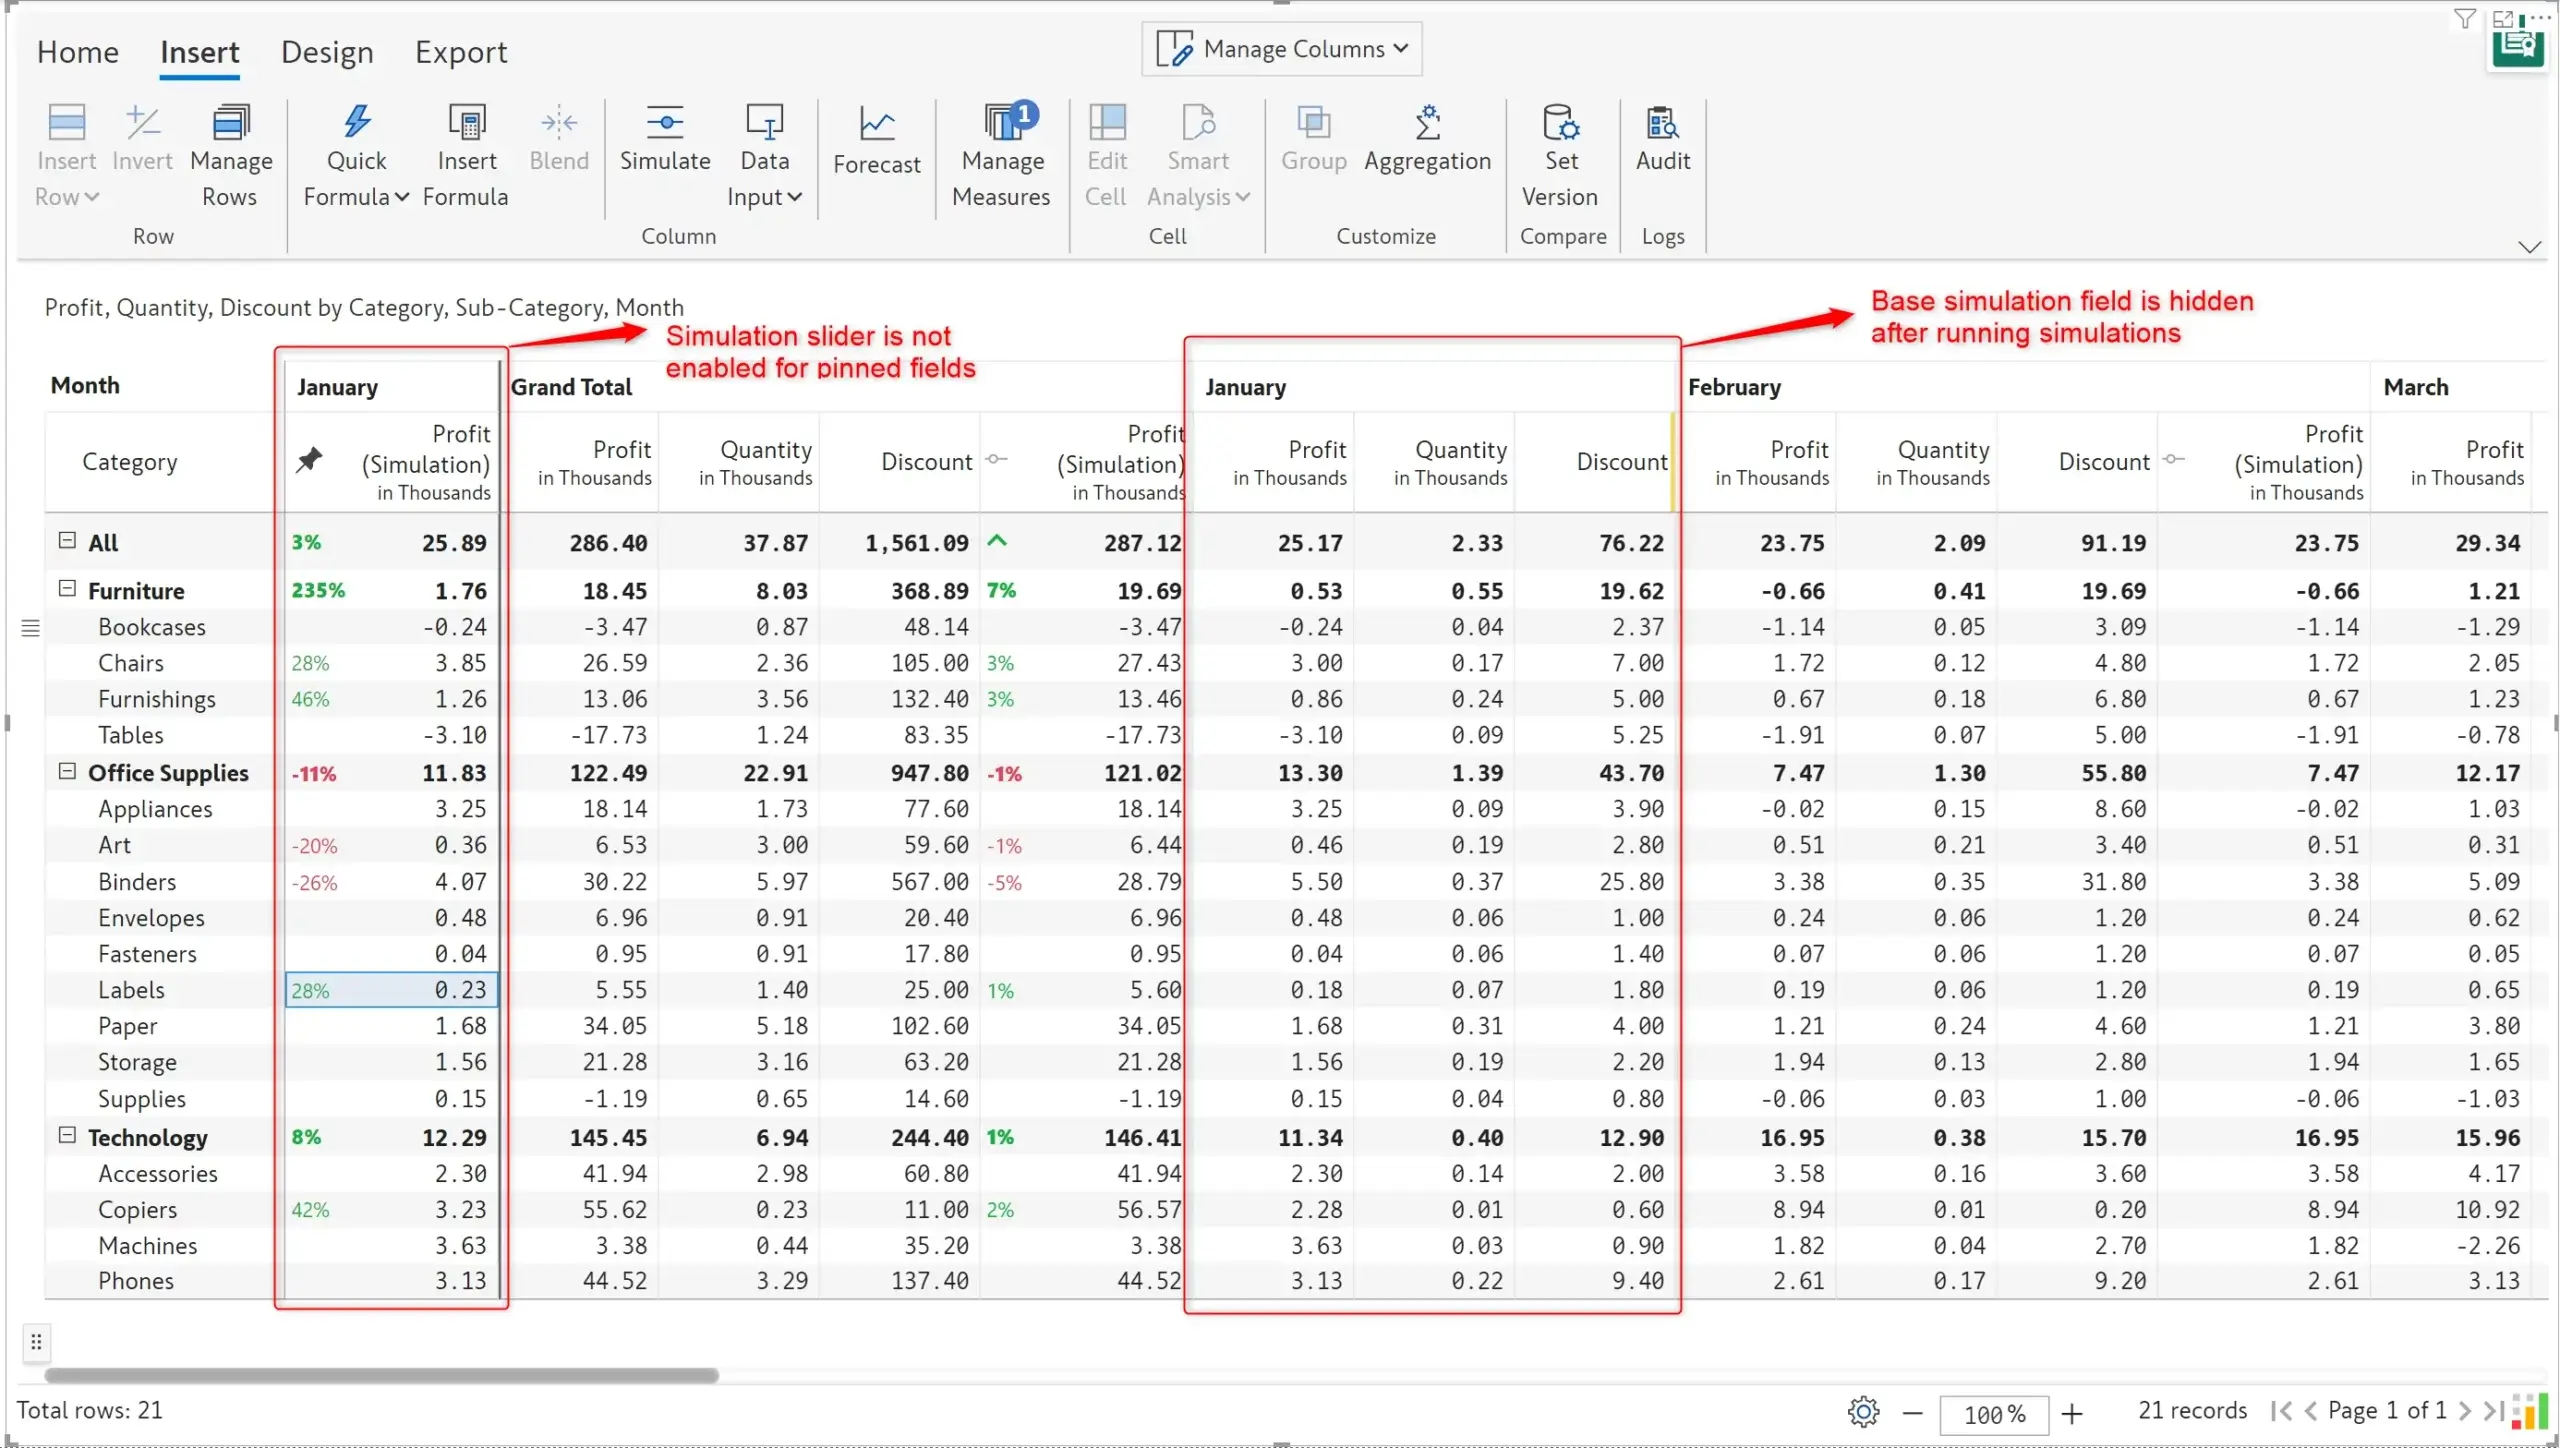
Inforiver offers the ability to pin key fields to the beginning of your report, eliminating the need to scroll. You can now run simulations directly on pinned columns, even if you have chosen to hide the base column.
Previously, you could only run simulations on the base column. If the base column is hidden, simulations would be displayed in the pinned column, but you would not be able to run any new simulations.
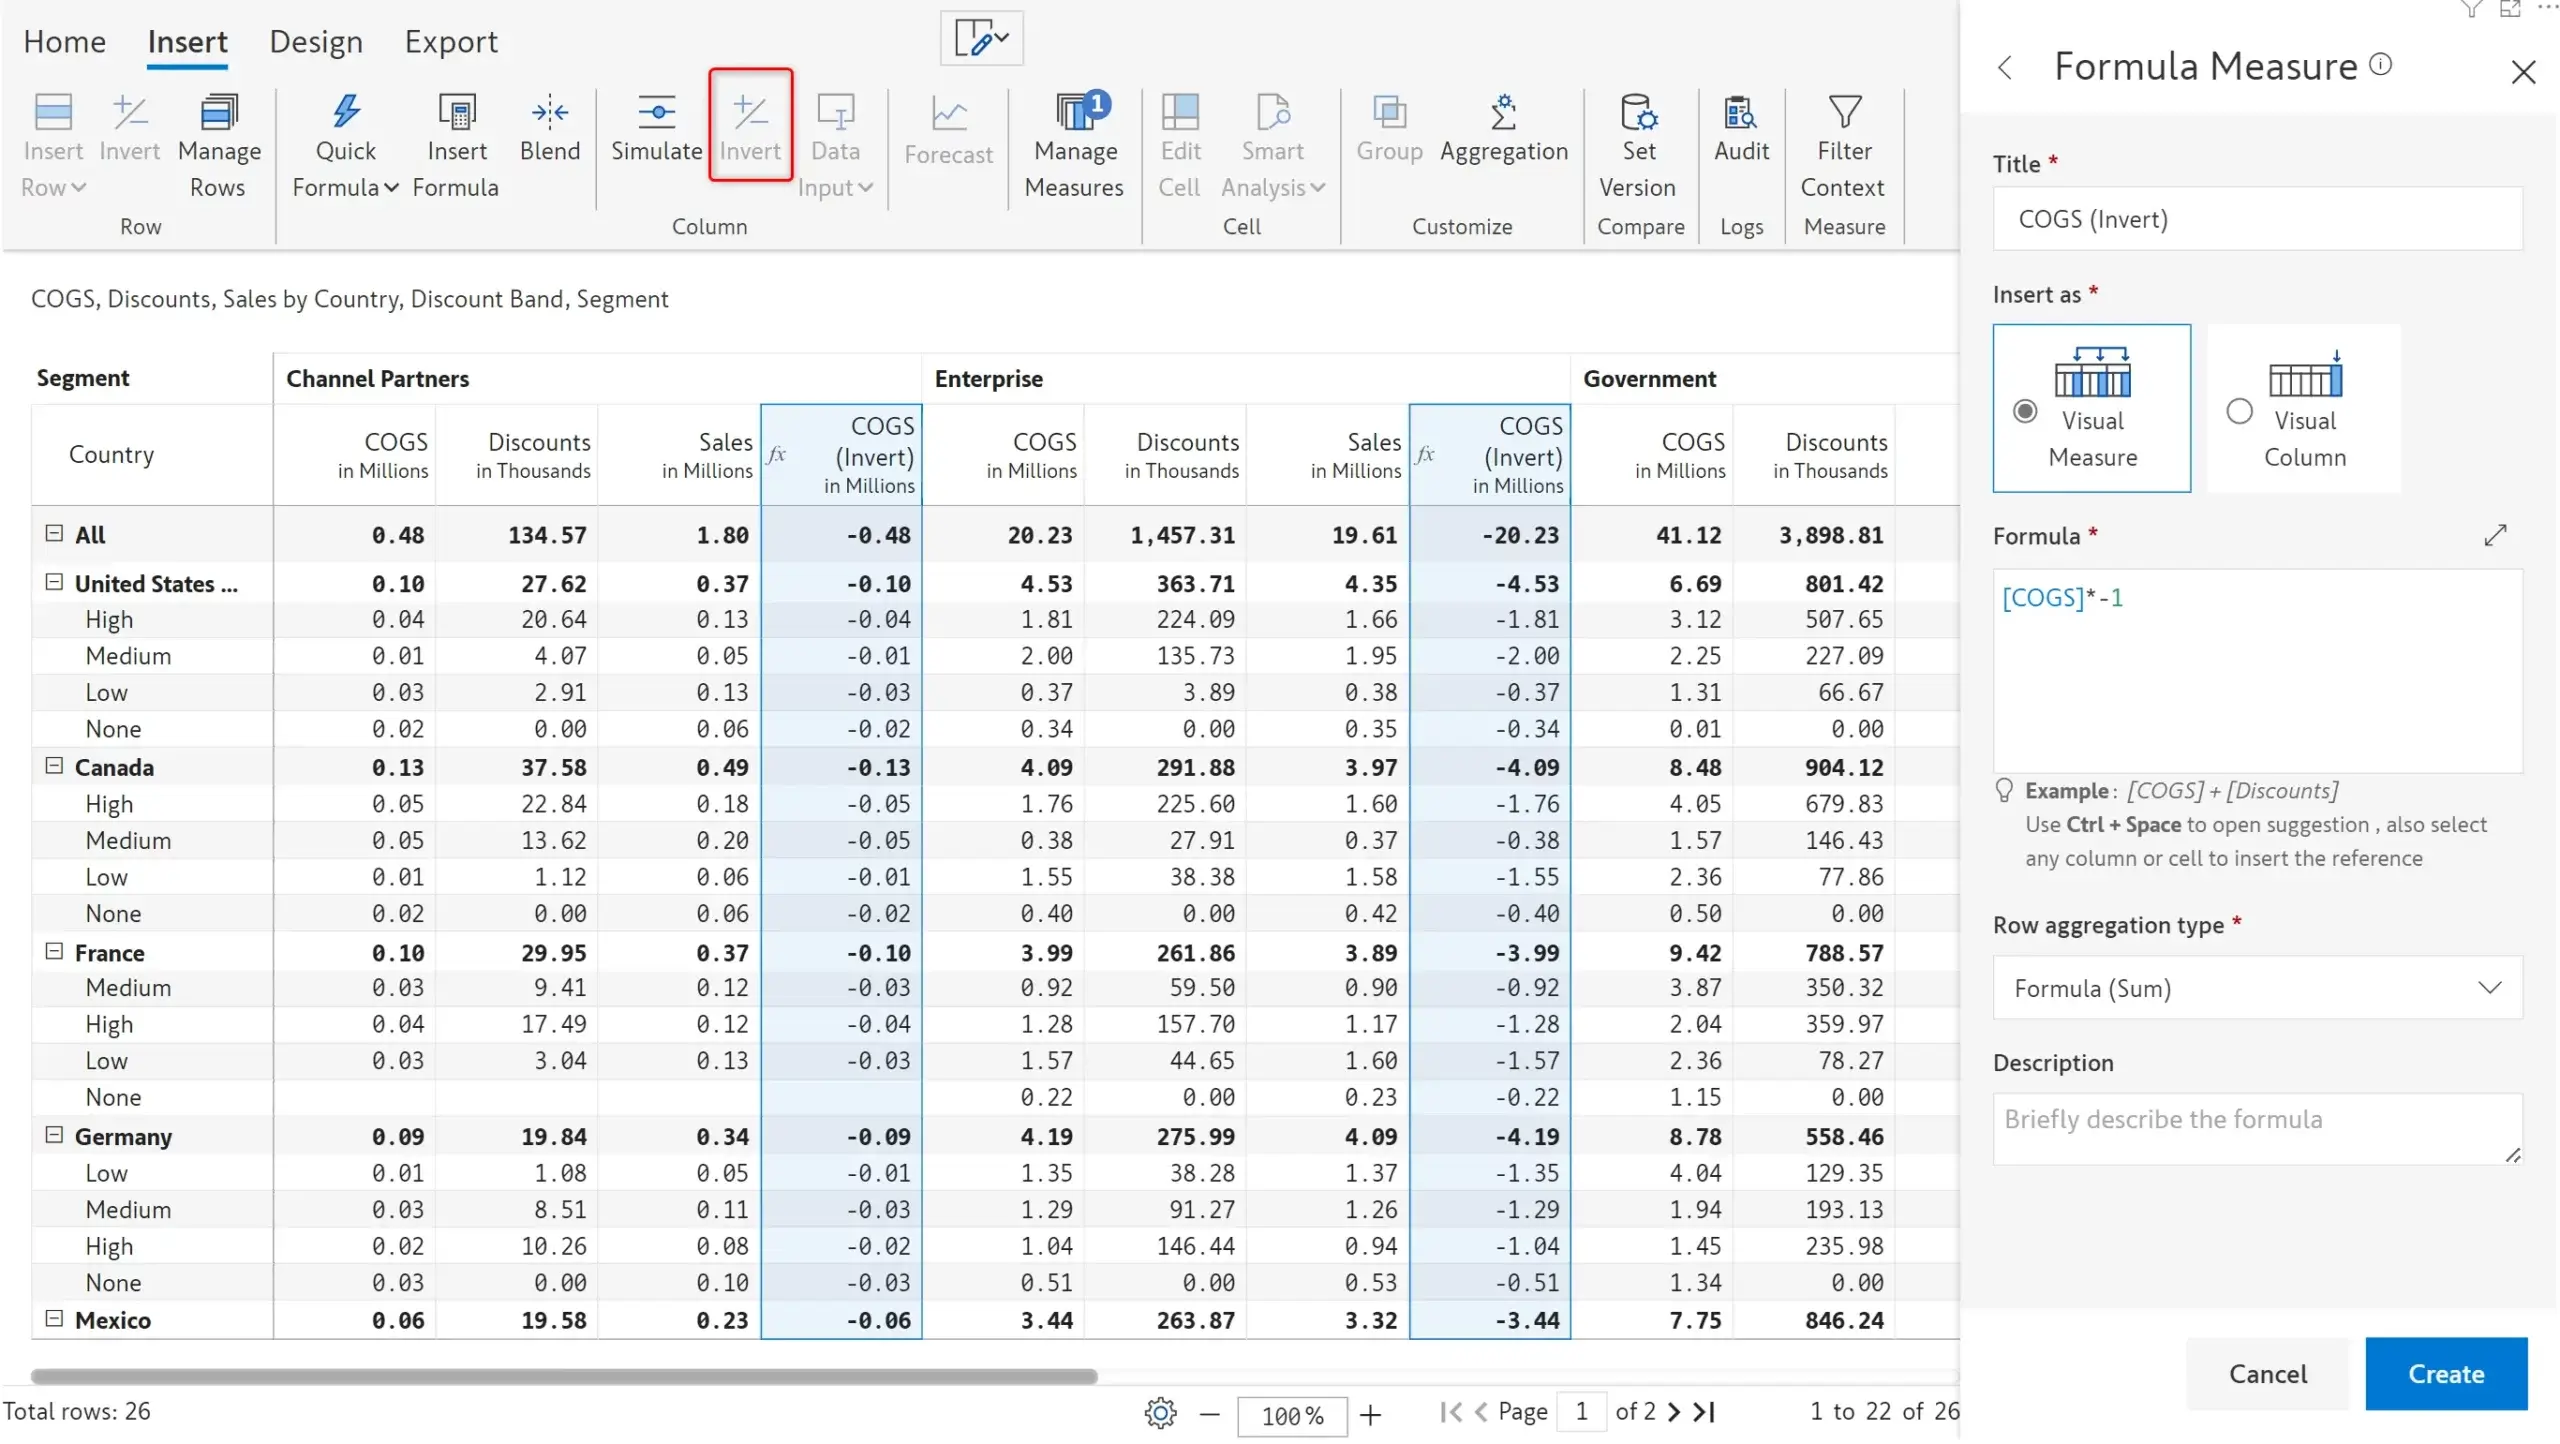
You can leverage the invert column button to rapidly multiply an entire column by -1, E.g., if you have an expenses measure that needs to be inverted, you can apply the calculation in a single click.
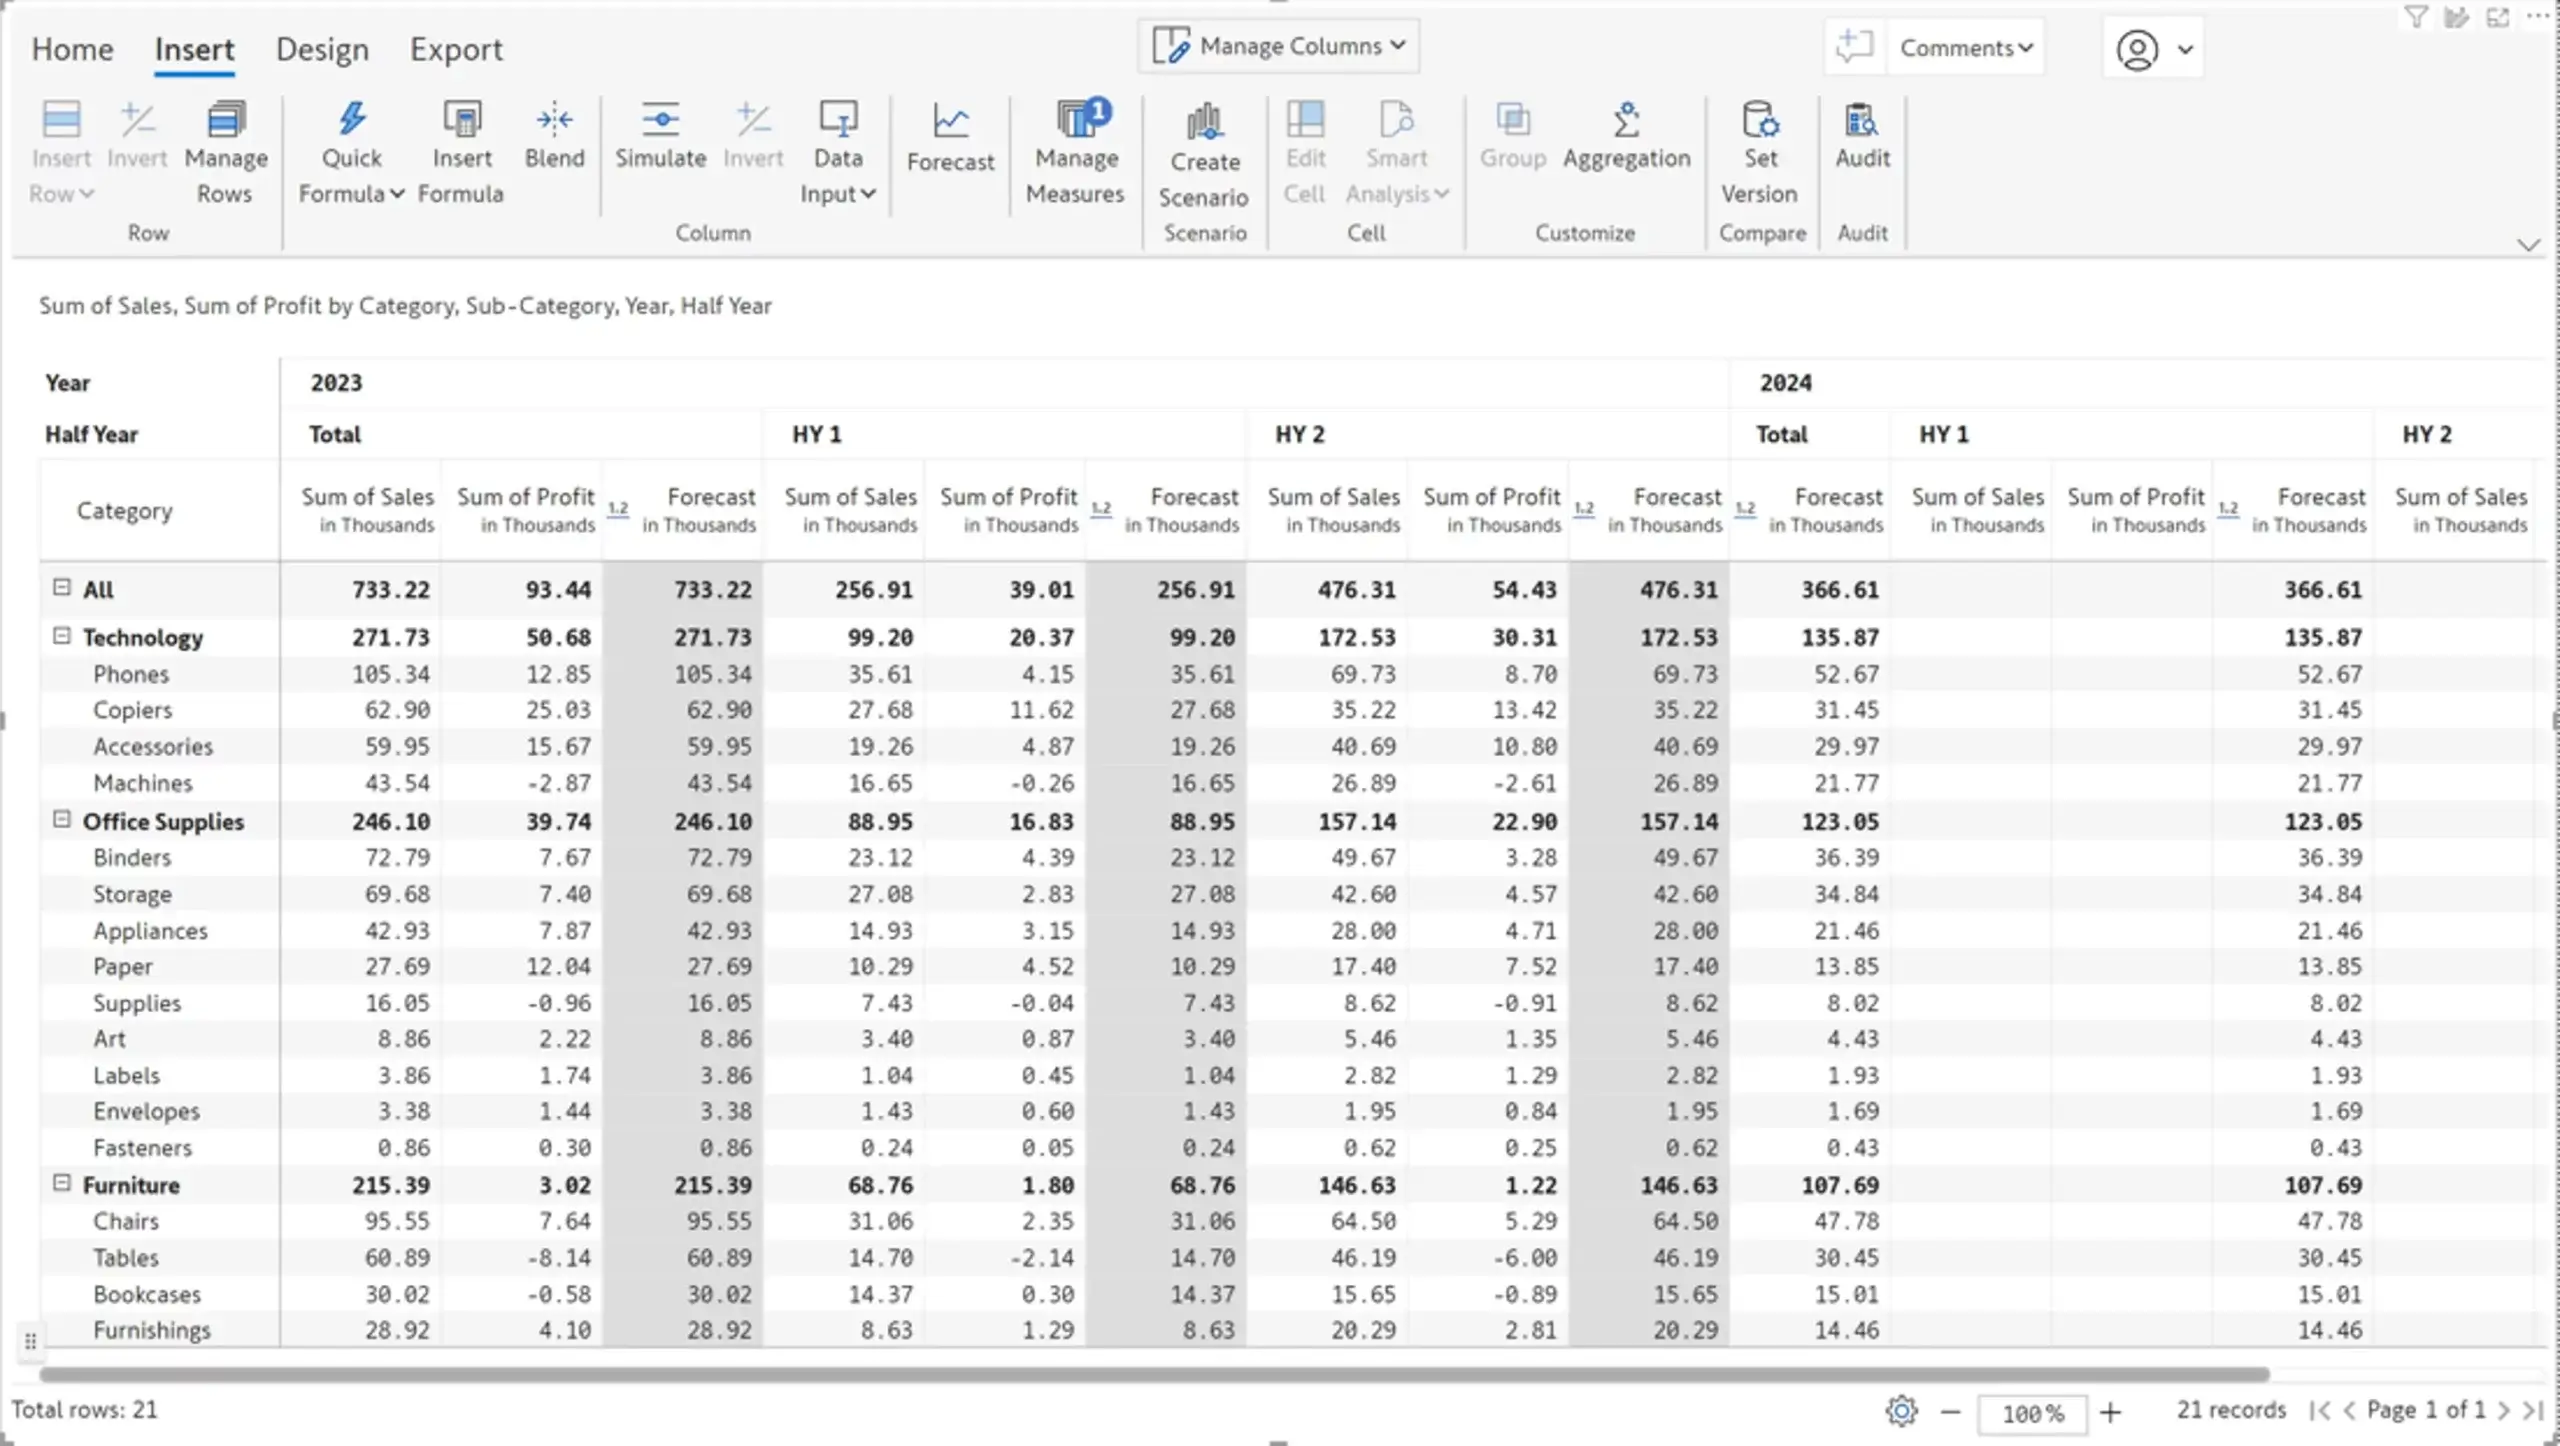
Half-yearly projections are commonly used in financial reporting – Inforiver's time intelligence engine can now detect half-year formats against which you can enter your forecasts. Time extensions for the half-year date format are also supported.
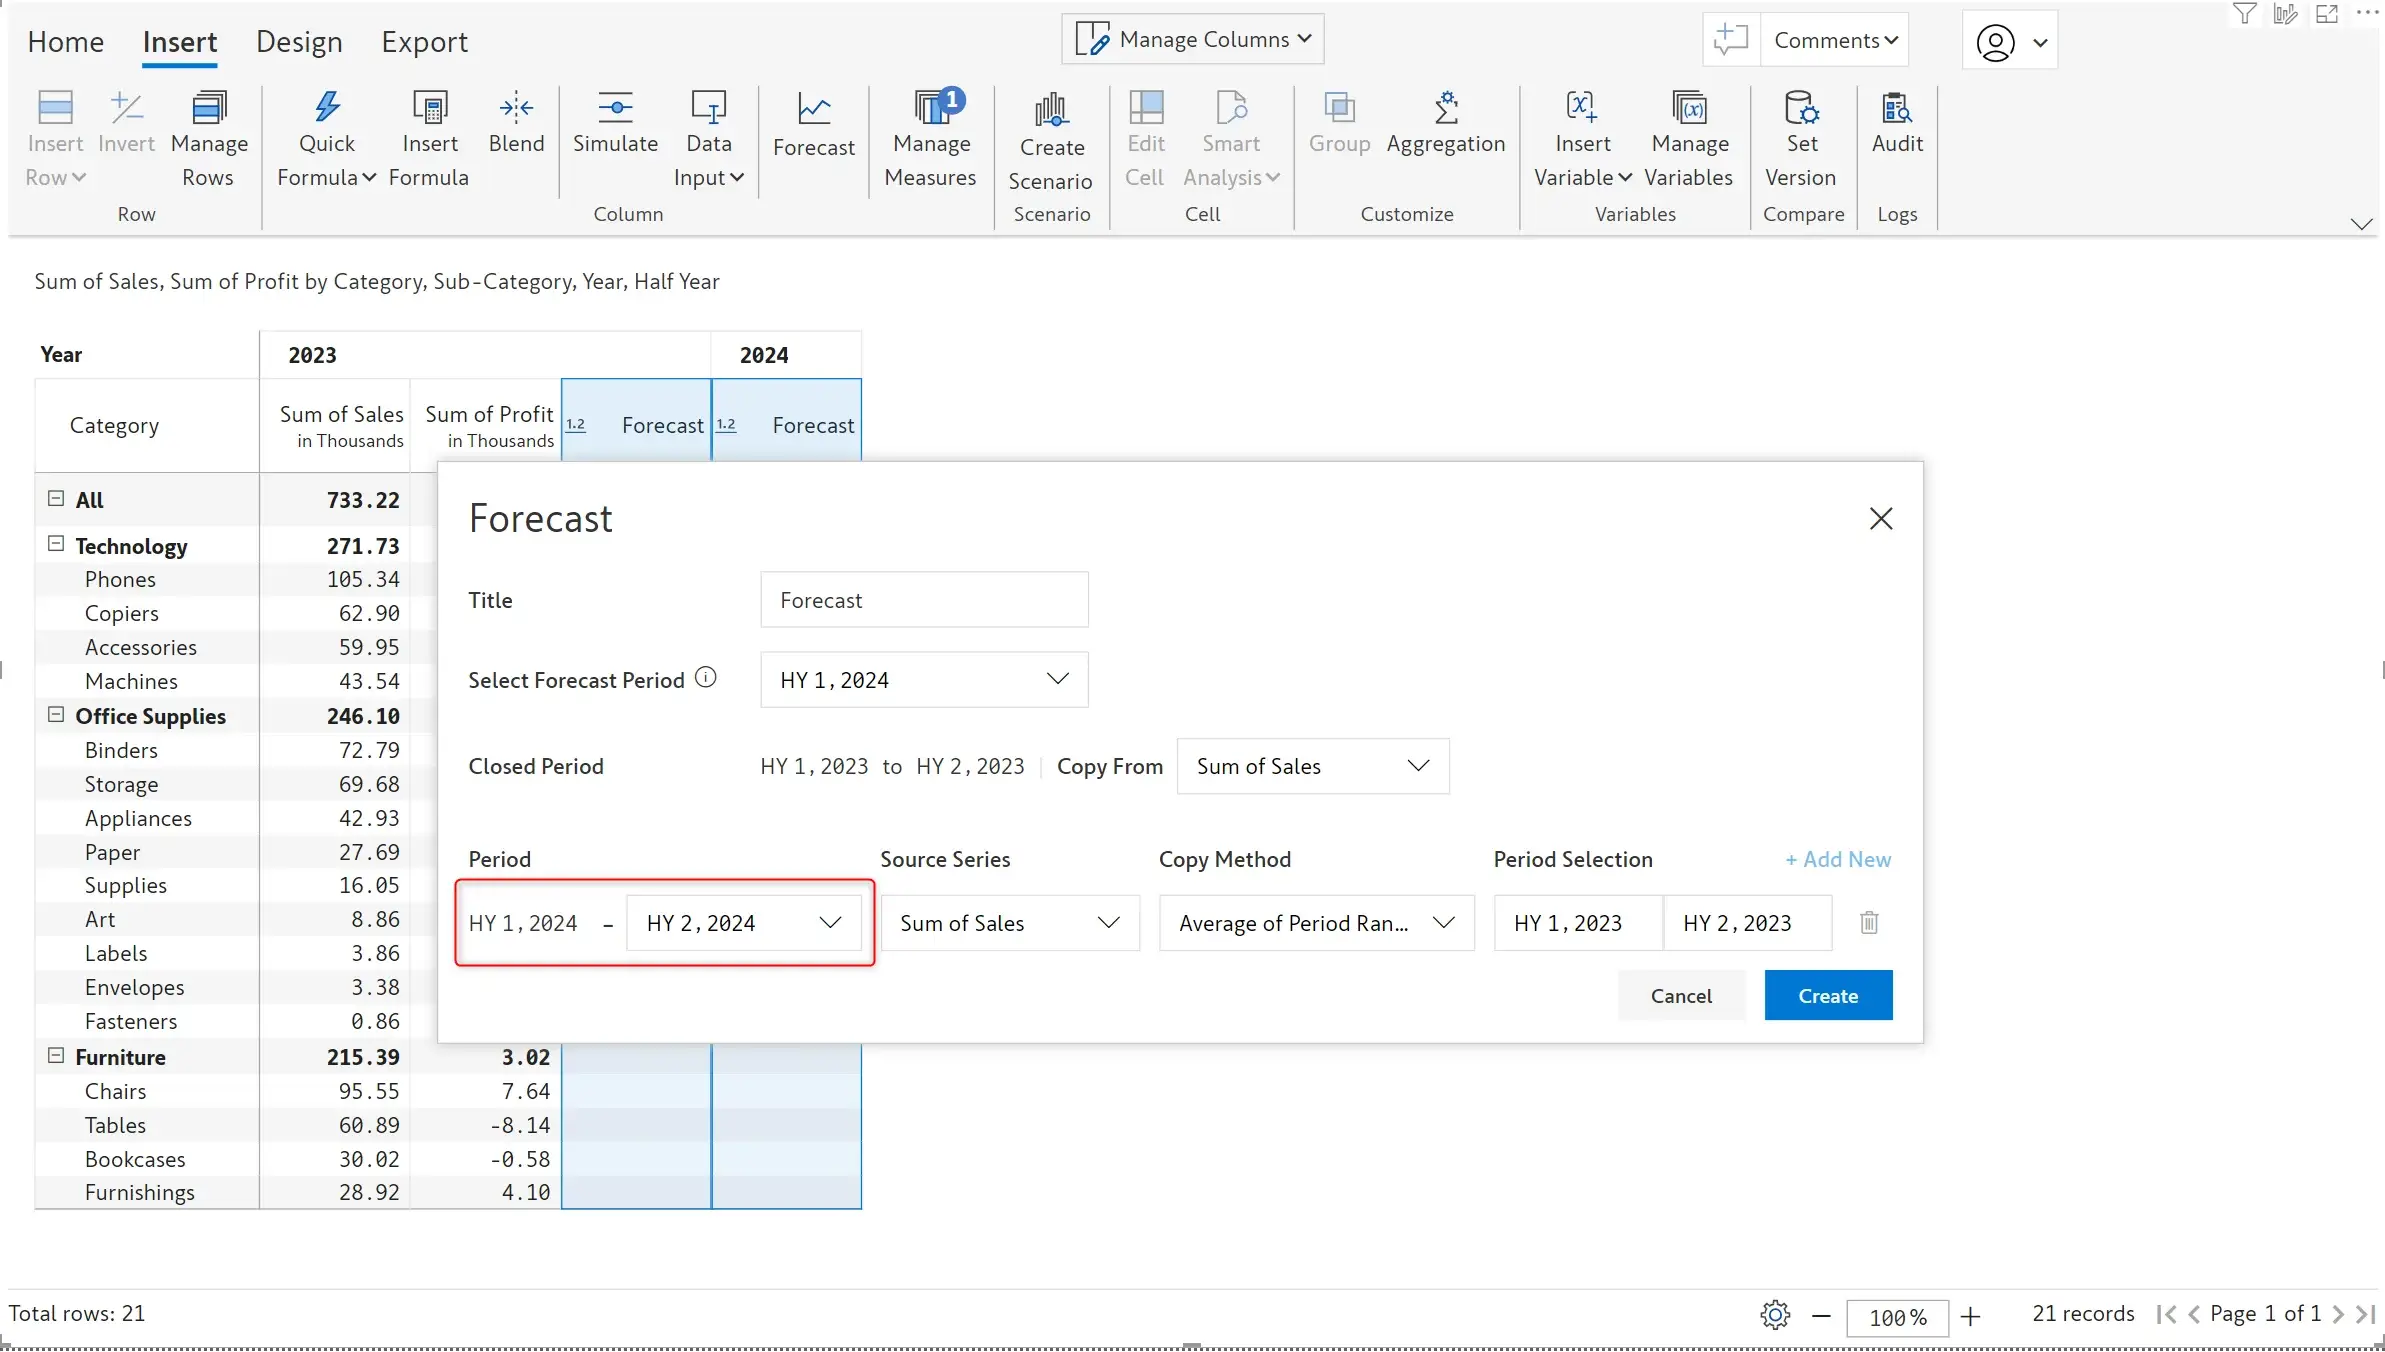
The image below shows the half-yearly forecast created in Inforiver.
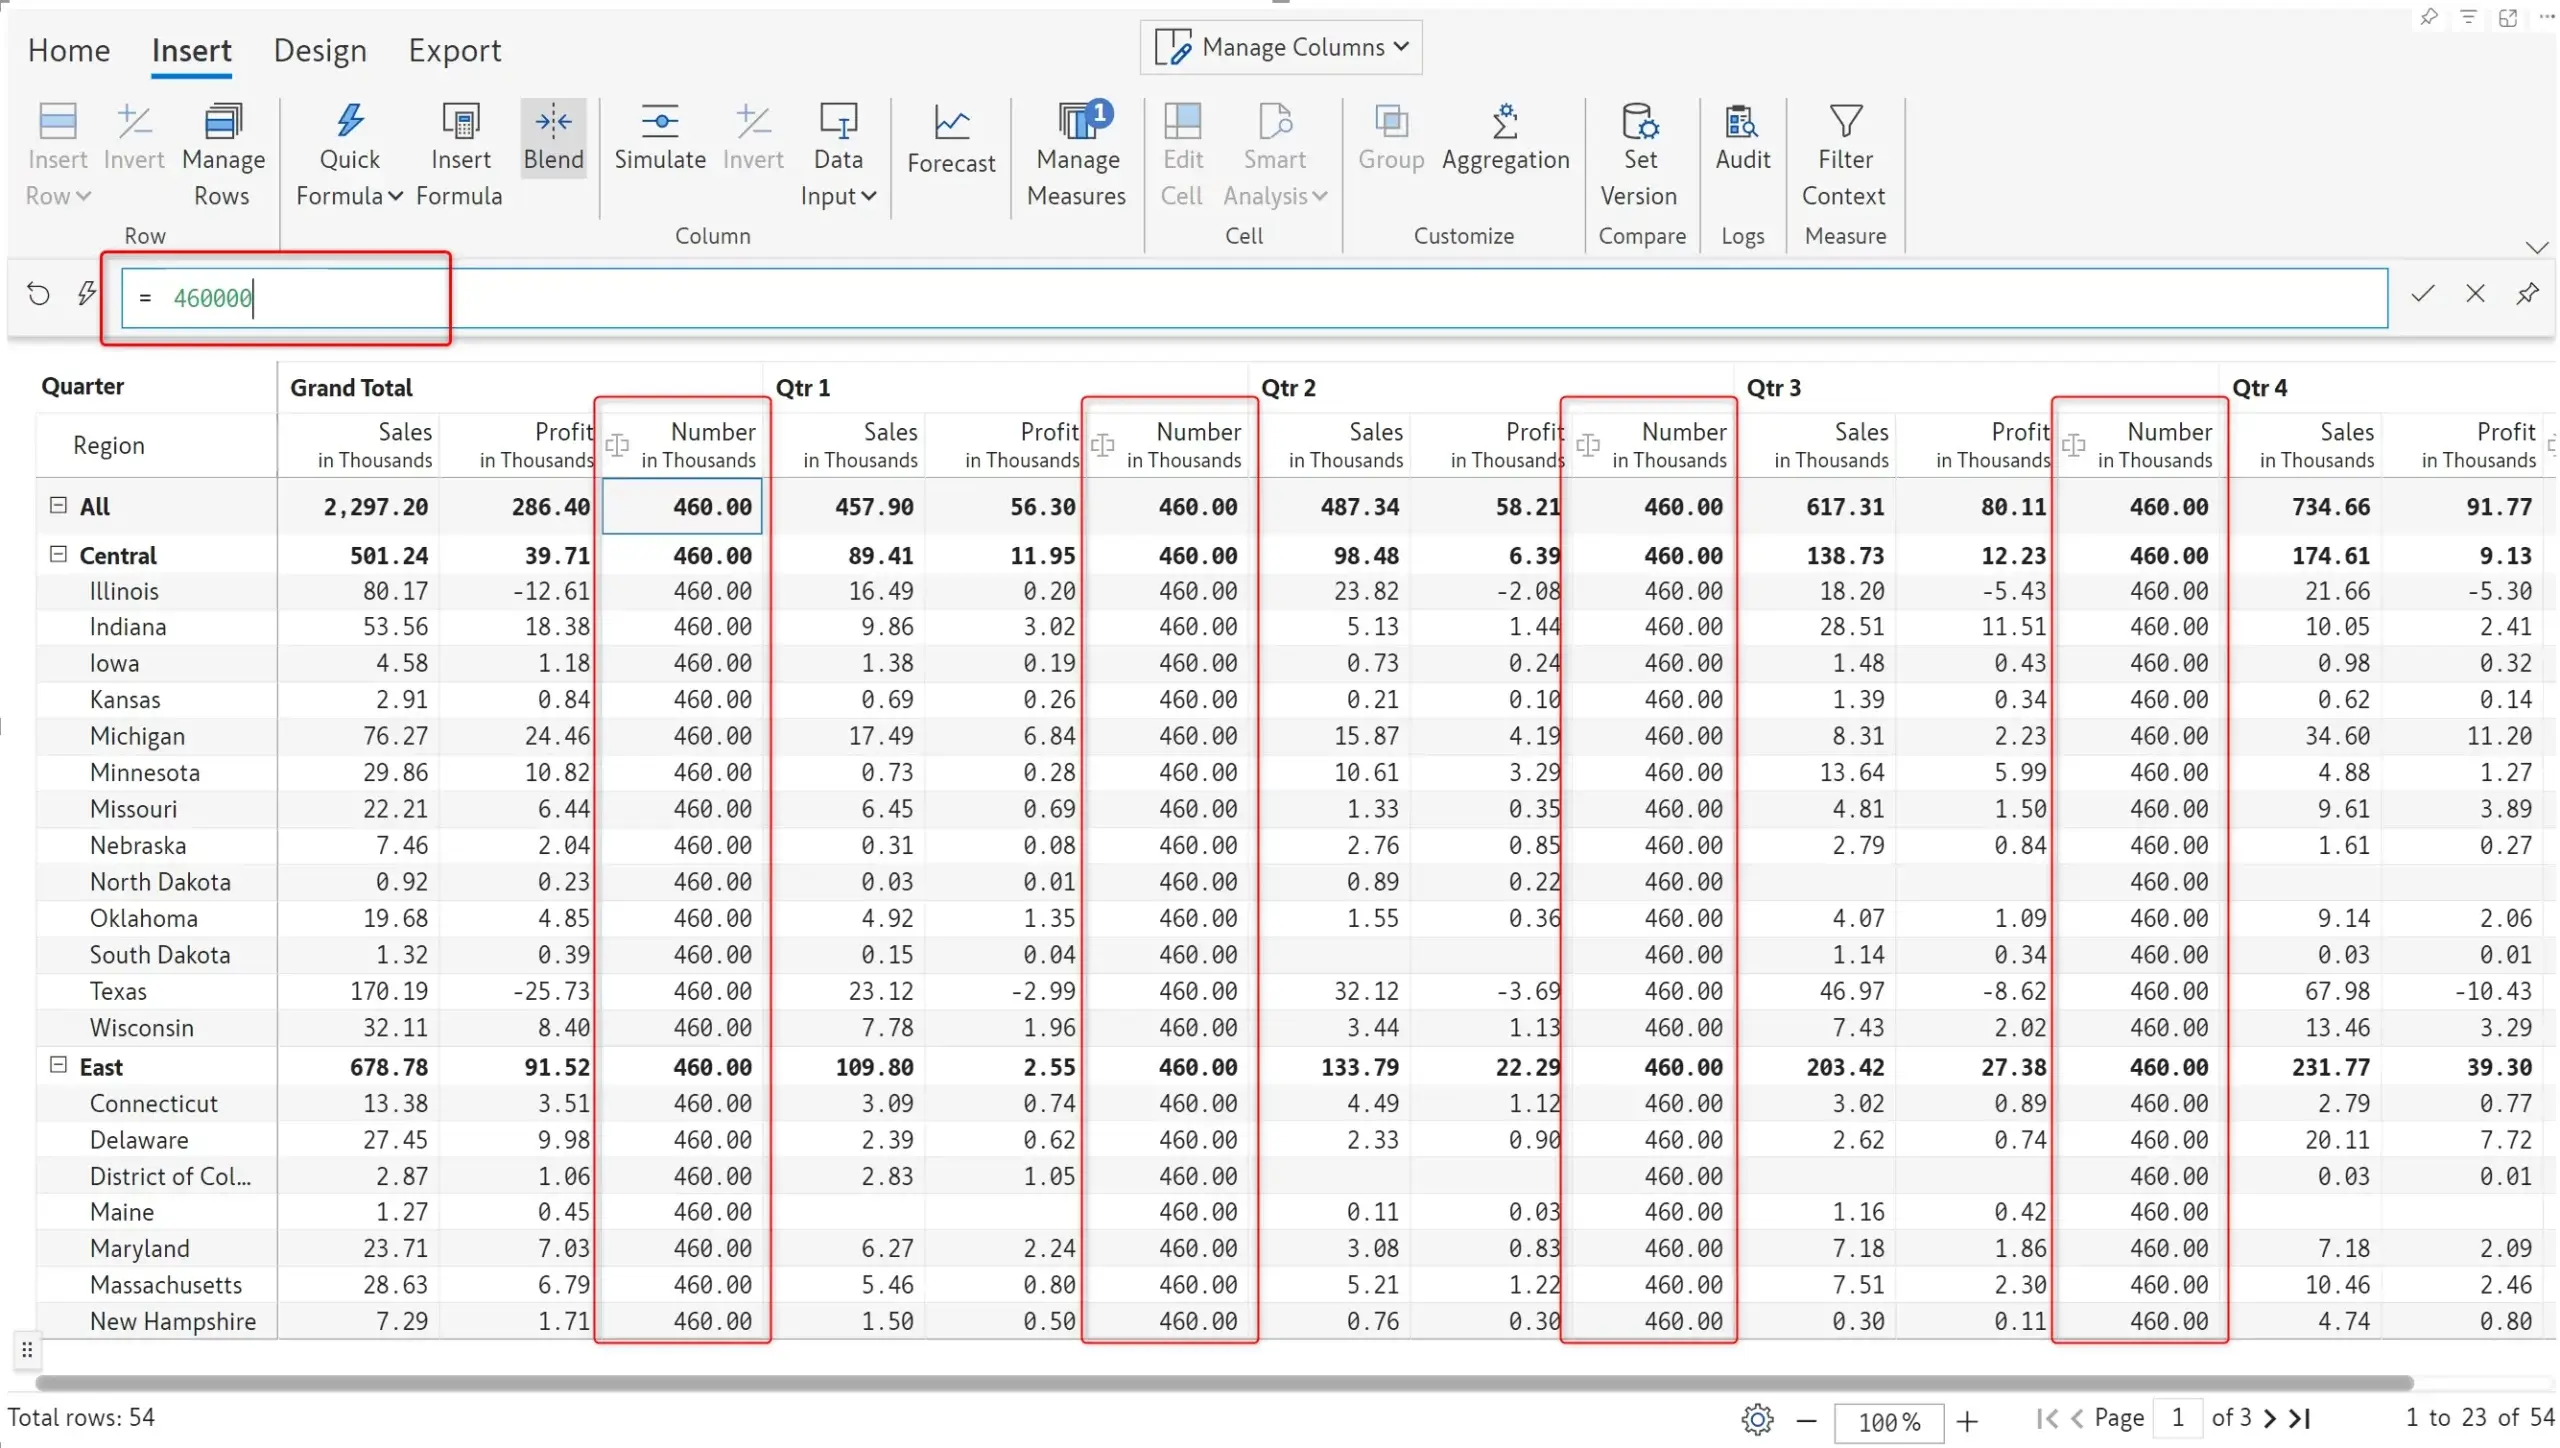
When you need to override the data in multiple cells with the same value, for instance set a target revenue, Inforiver 2.6 enables you to efficiently update your data. Select the cells and update the value in any cell, the updated value will get cascaded to all the selected cells.
6.1. Row Aggregation – Average
Inforiver offers you the flexibility to set the row aggregation type for the total and sub-total rows.
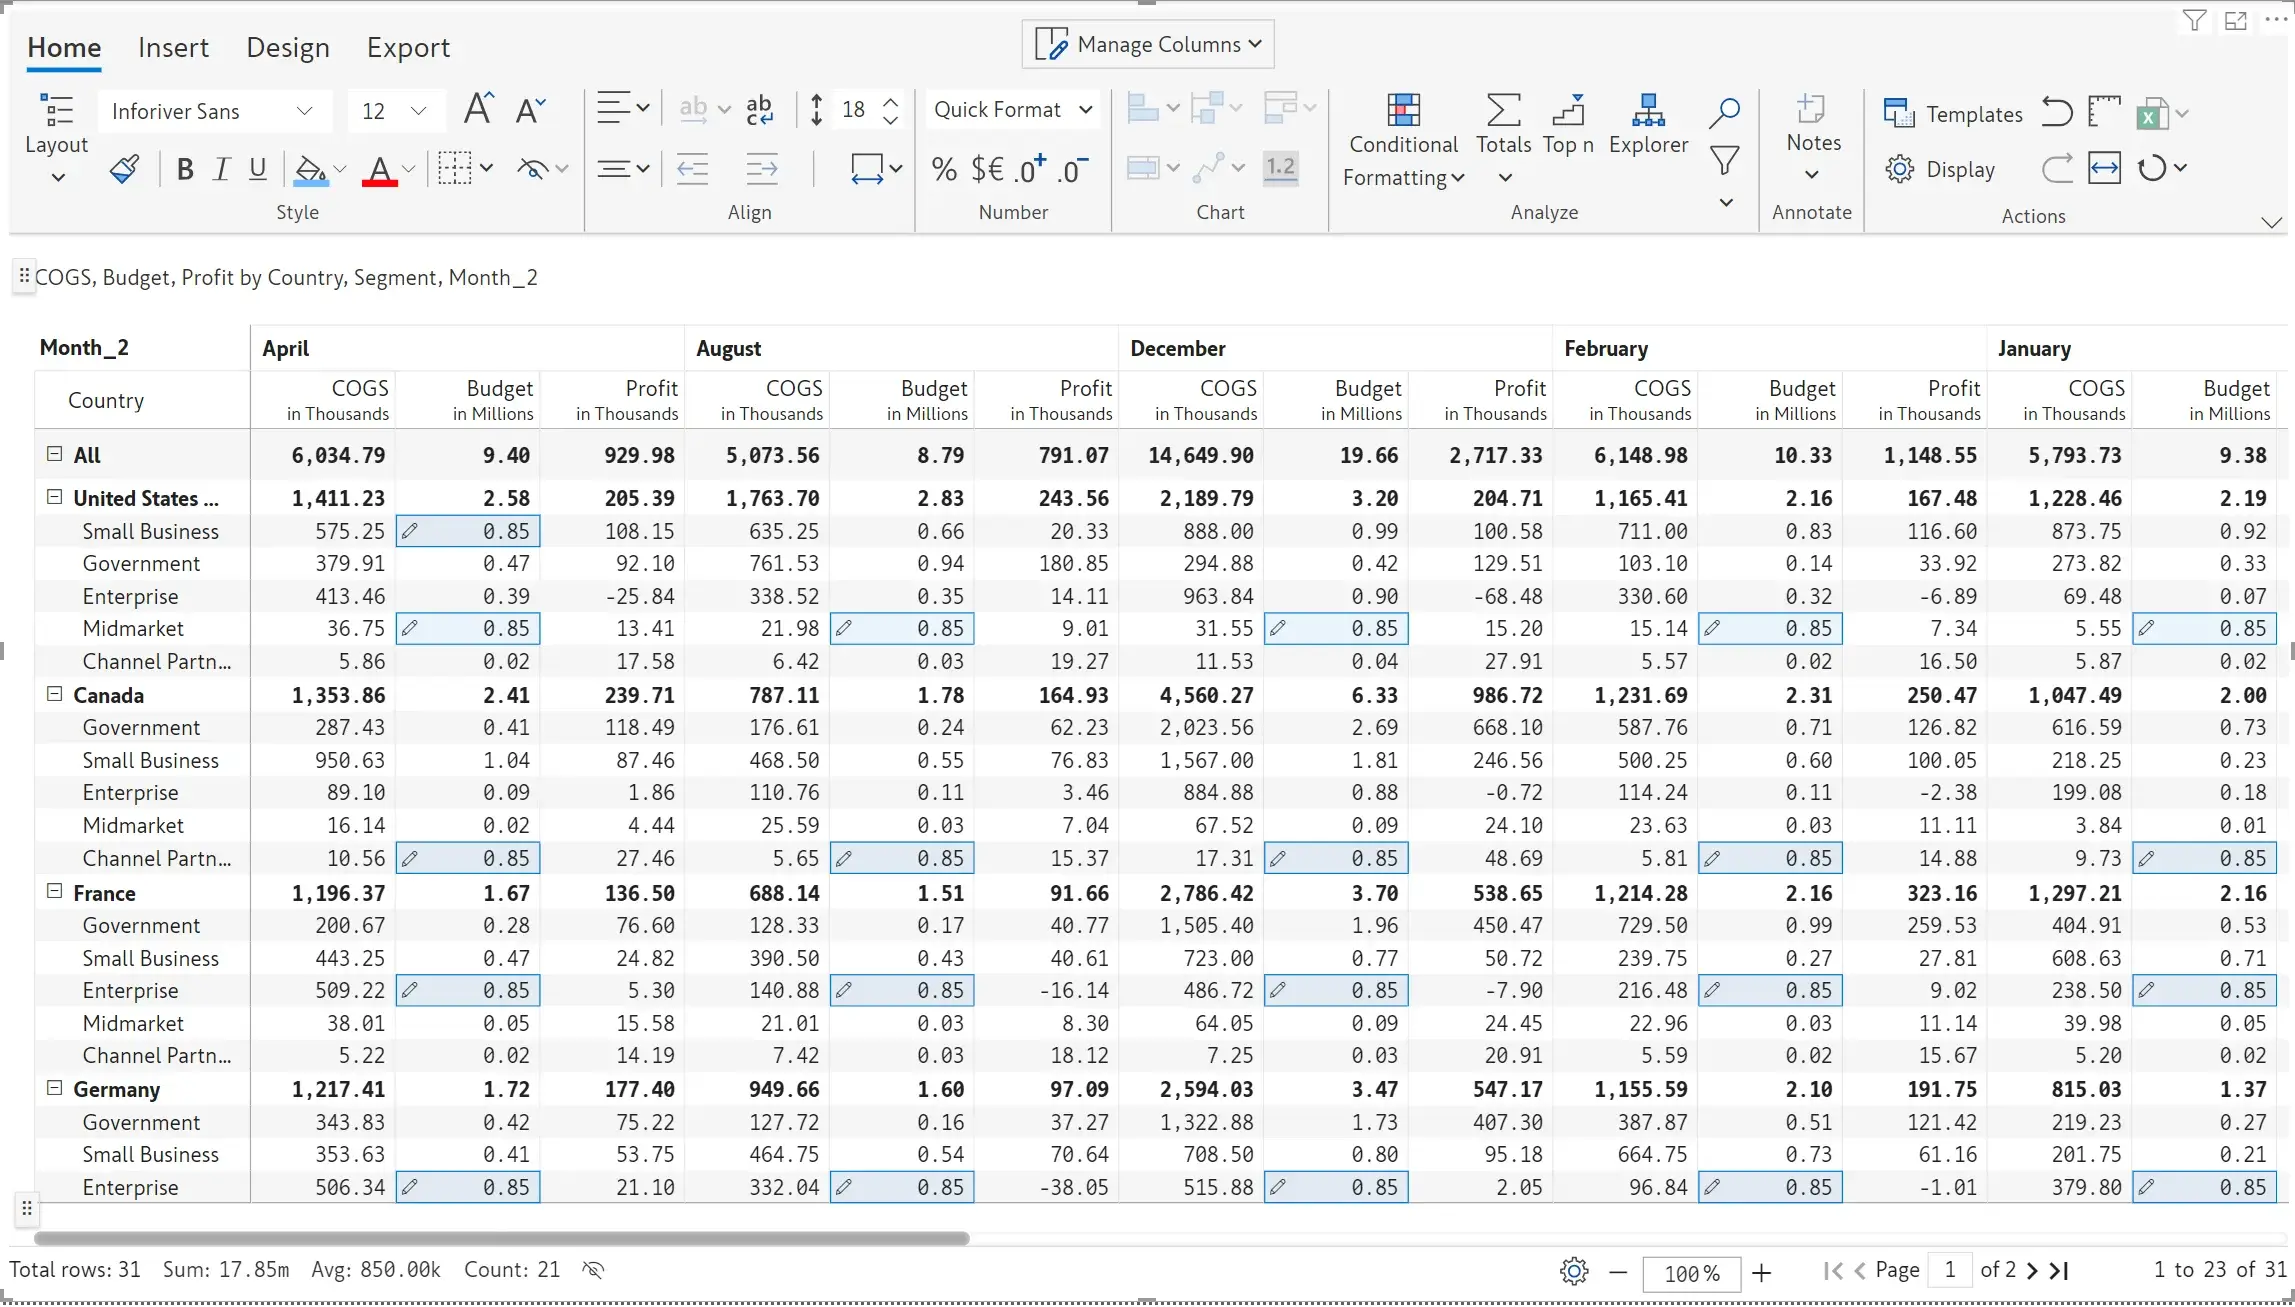
For numeric data input fields with row aggregation type set to ‘Average’, you can assign a value at grand total level and it will be automatically replicated in the child nodes (instead of being distributed) - saving you the effort required to manually enter values for each cell. For instance, you can easily assign a budget and it will be uniformly assigned to all intermediate and leaf nodes.
Inforiver has built-in context aware commenting i.e., any comments and notes that you add will be updated dynamically based on external filters or slicers.
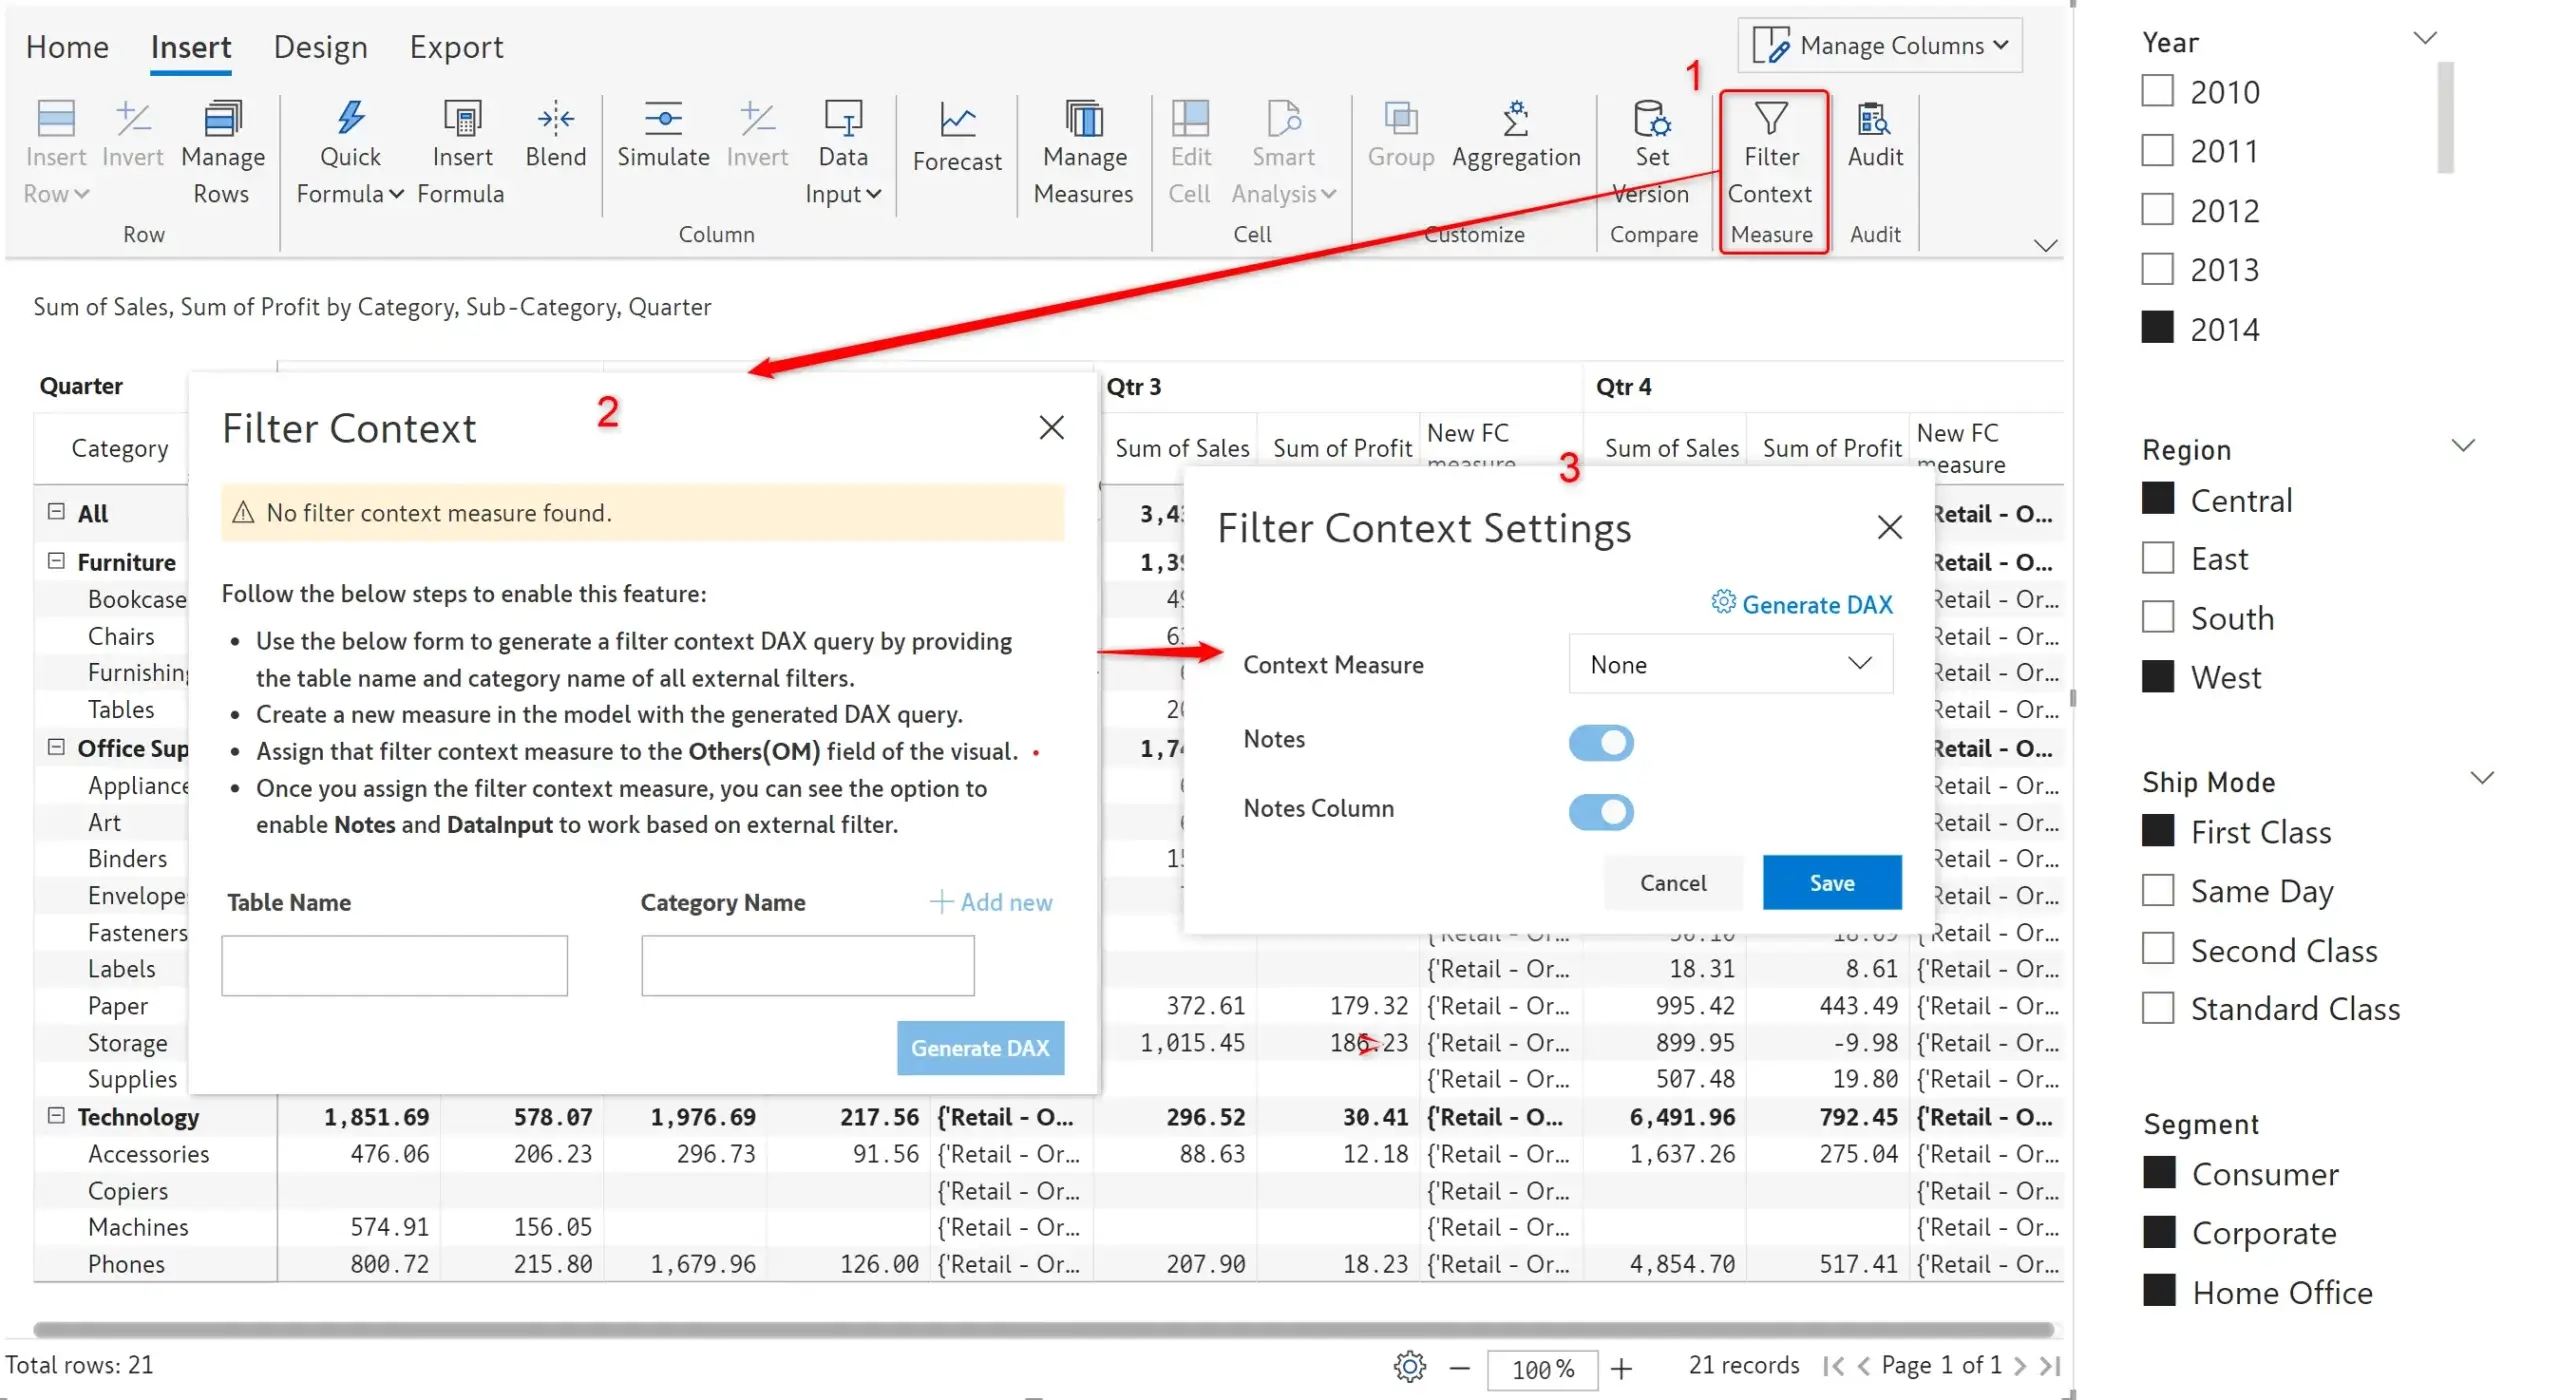
Inforiver’s filter context feature has been retrofitted with an easily accessible, and user-friendly UI. With 2.6., Data input fields in your reports will also be responsive to external filters when filter context is enabled.
In 2.6., slicer selections will be reflected in header presets as well, if your report has been configured for filter context.
In Inforiver 2.6., you can create layouts with the header positioned at the left or right of the report. The position of the footer will be aligned to the header.
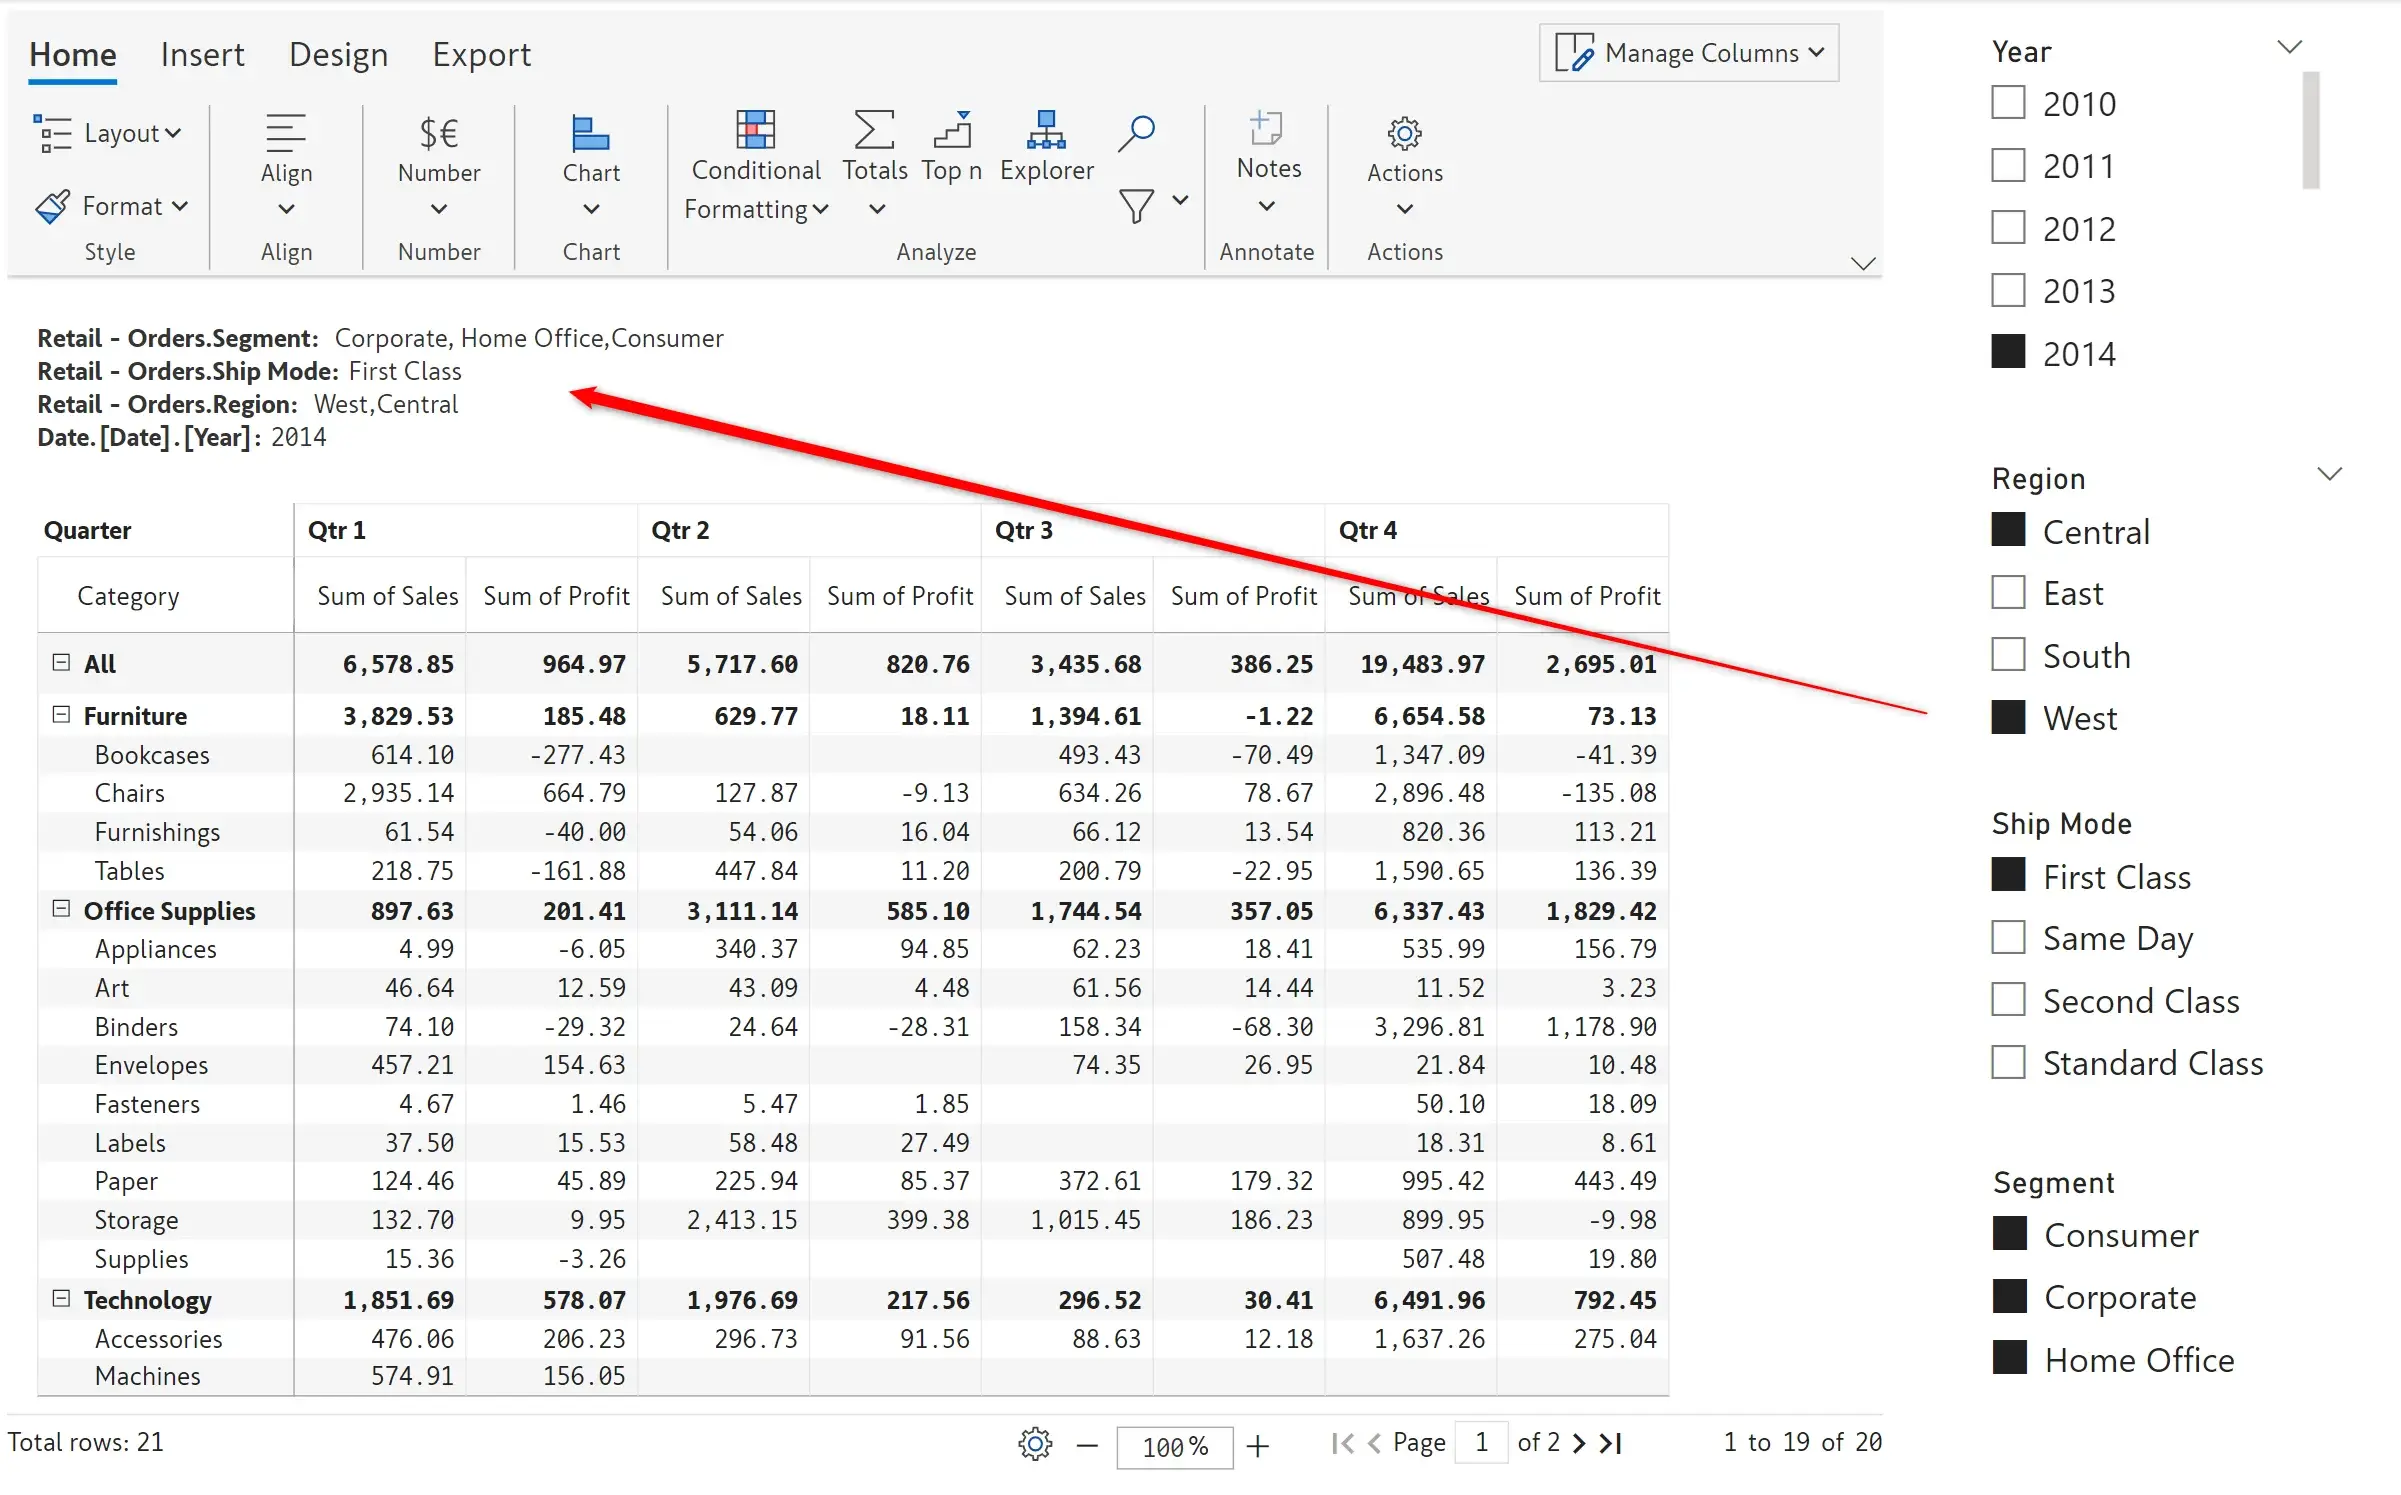
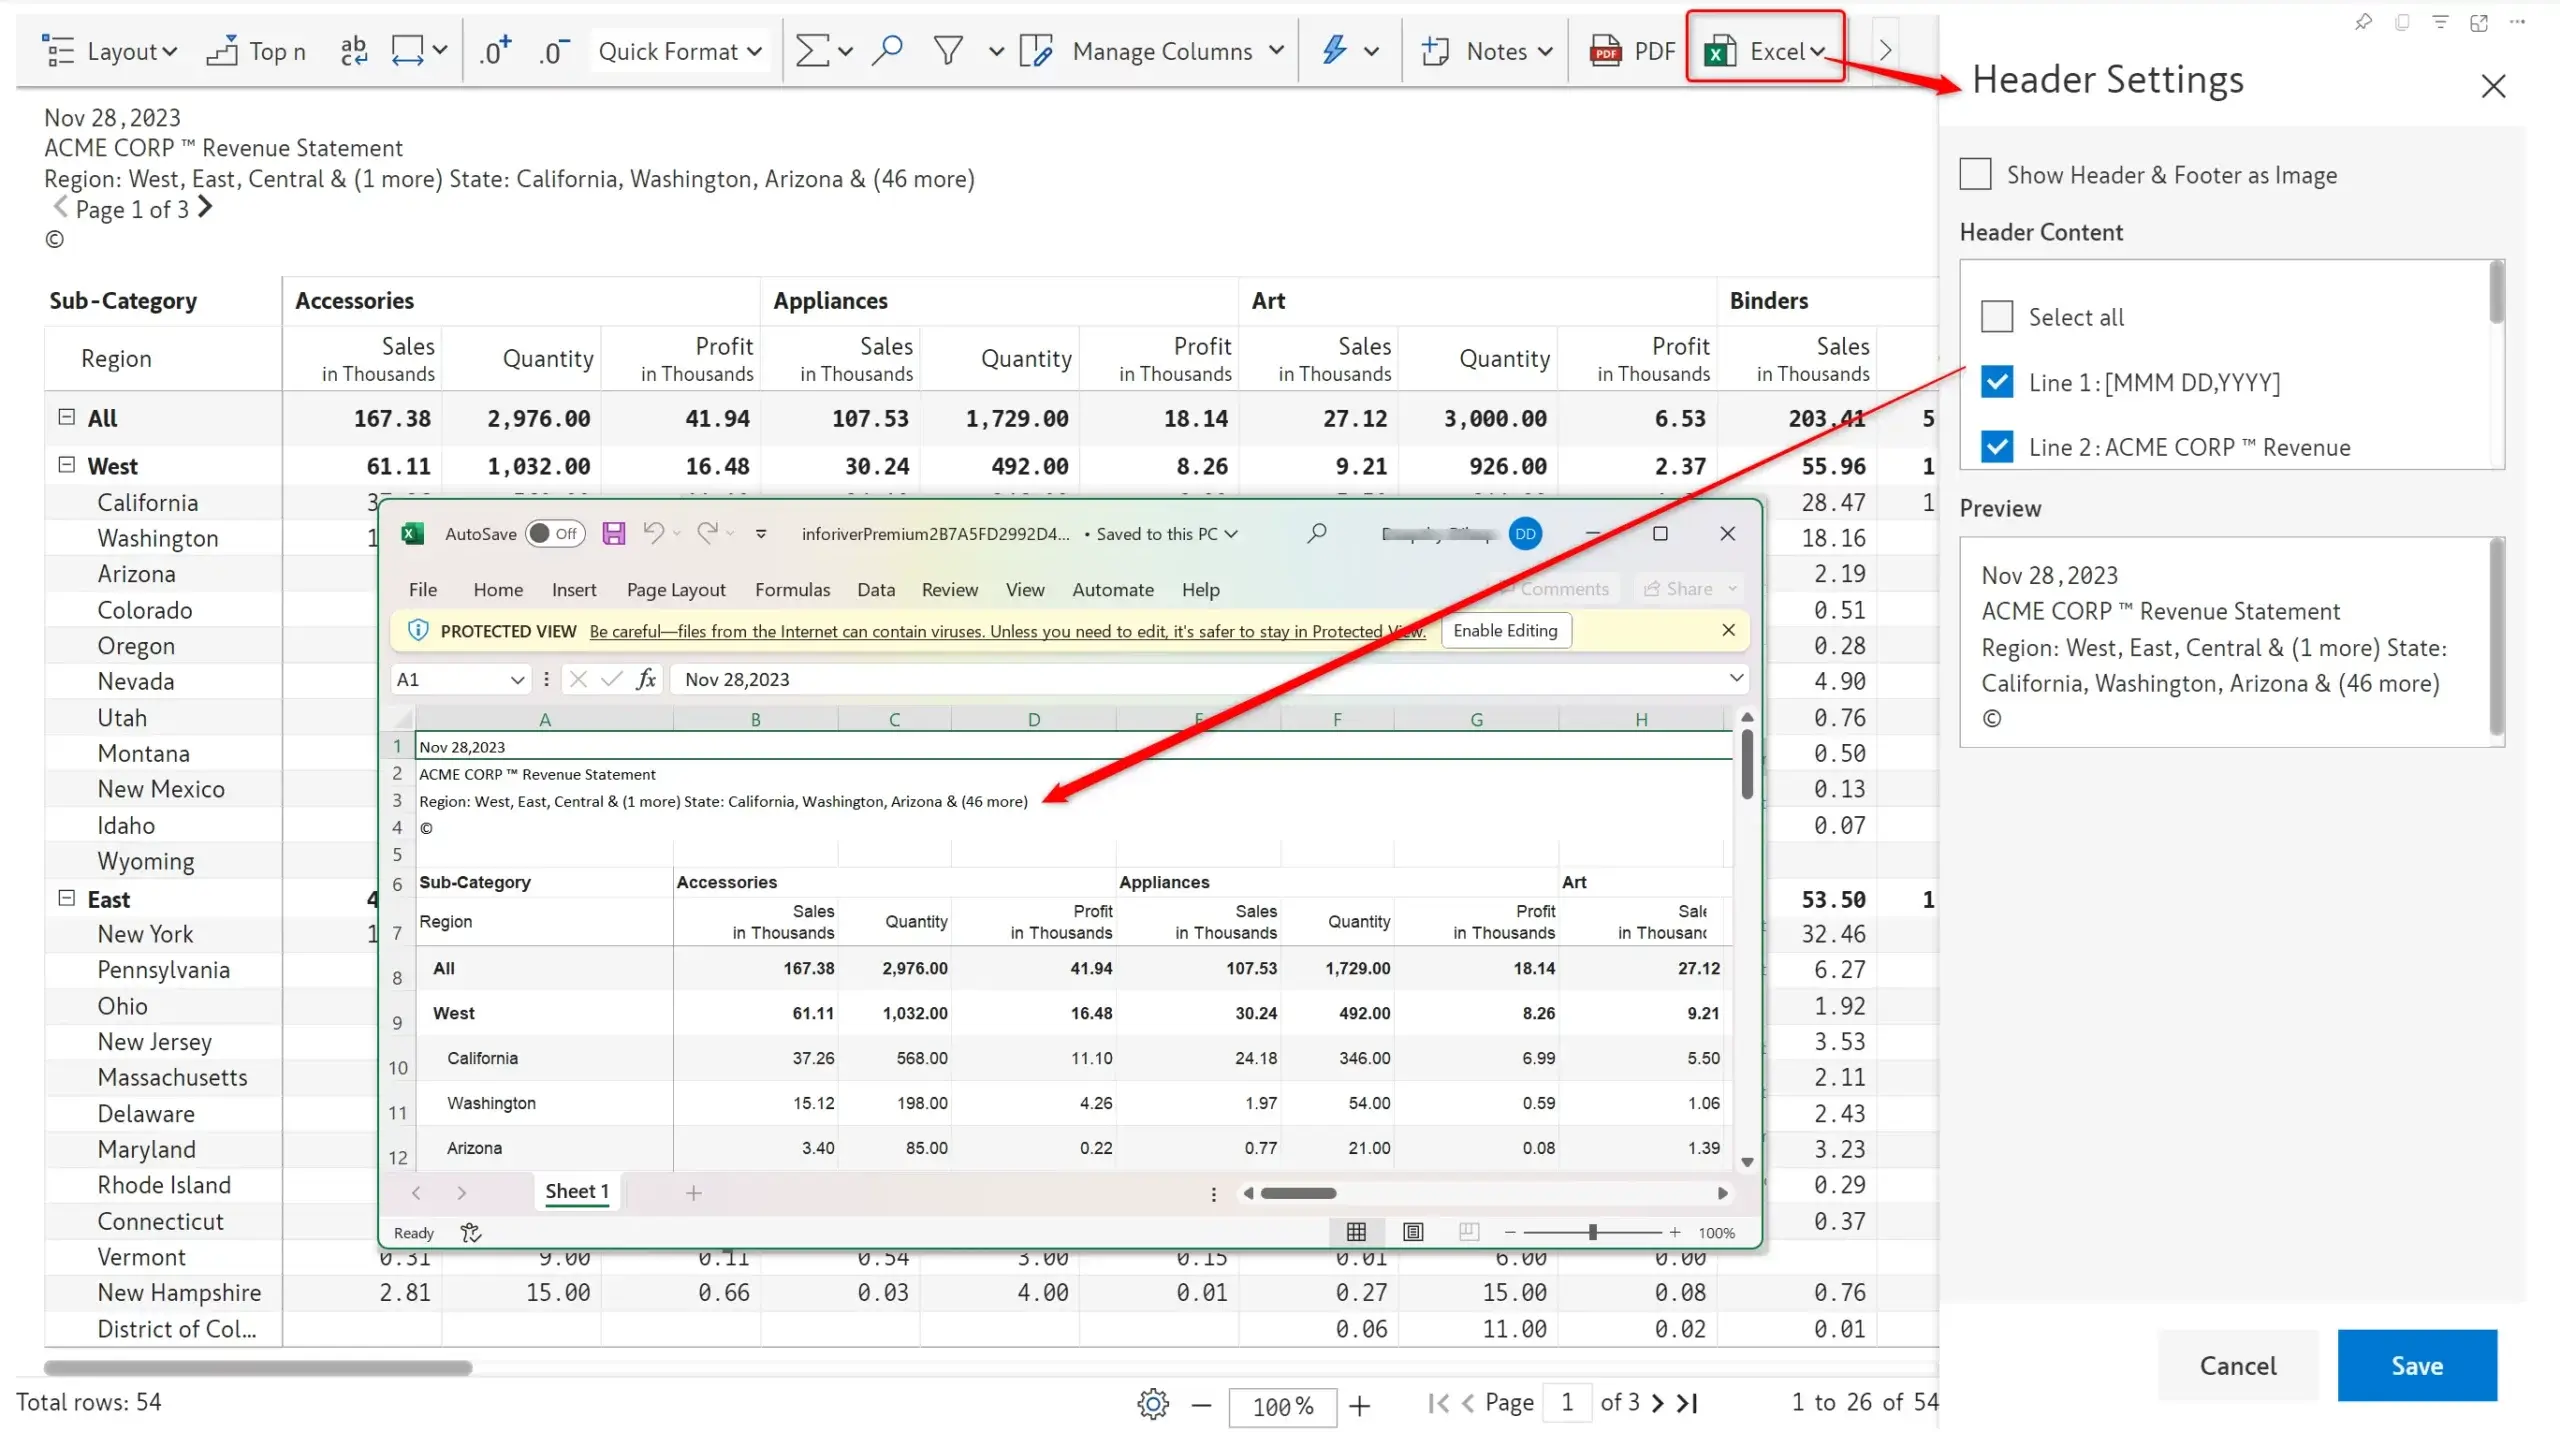
The latest 2.6. release provides extended support for exporting header elements such as dates and symbols. From the new header settings UI, you can quickly select the lines of the header which you want exported to an excel file.
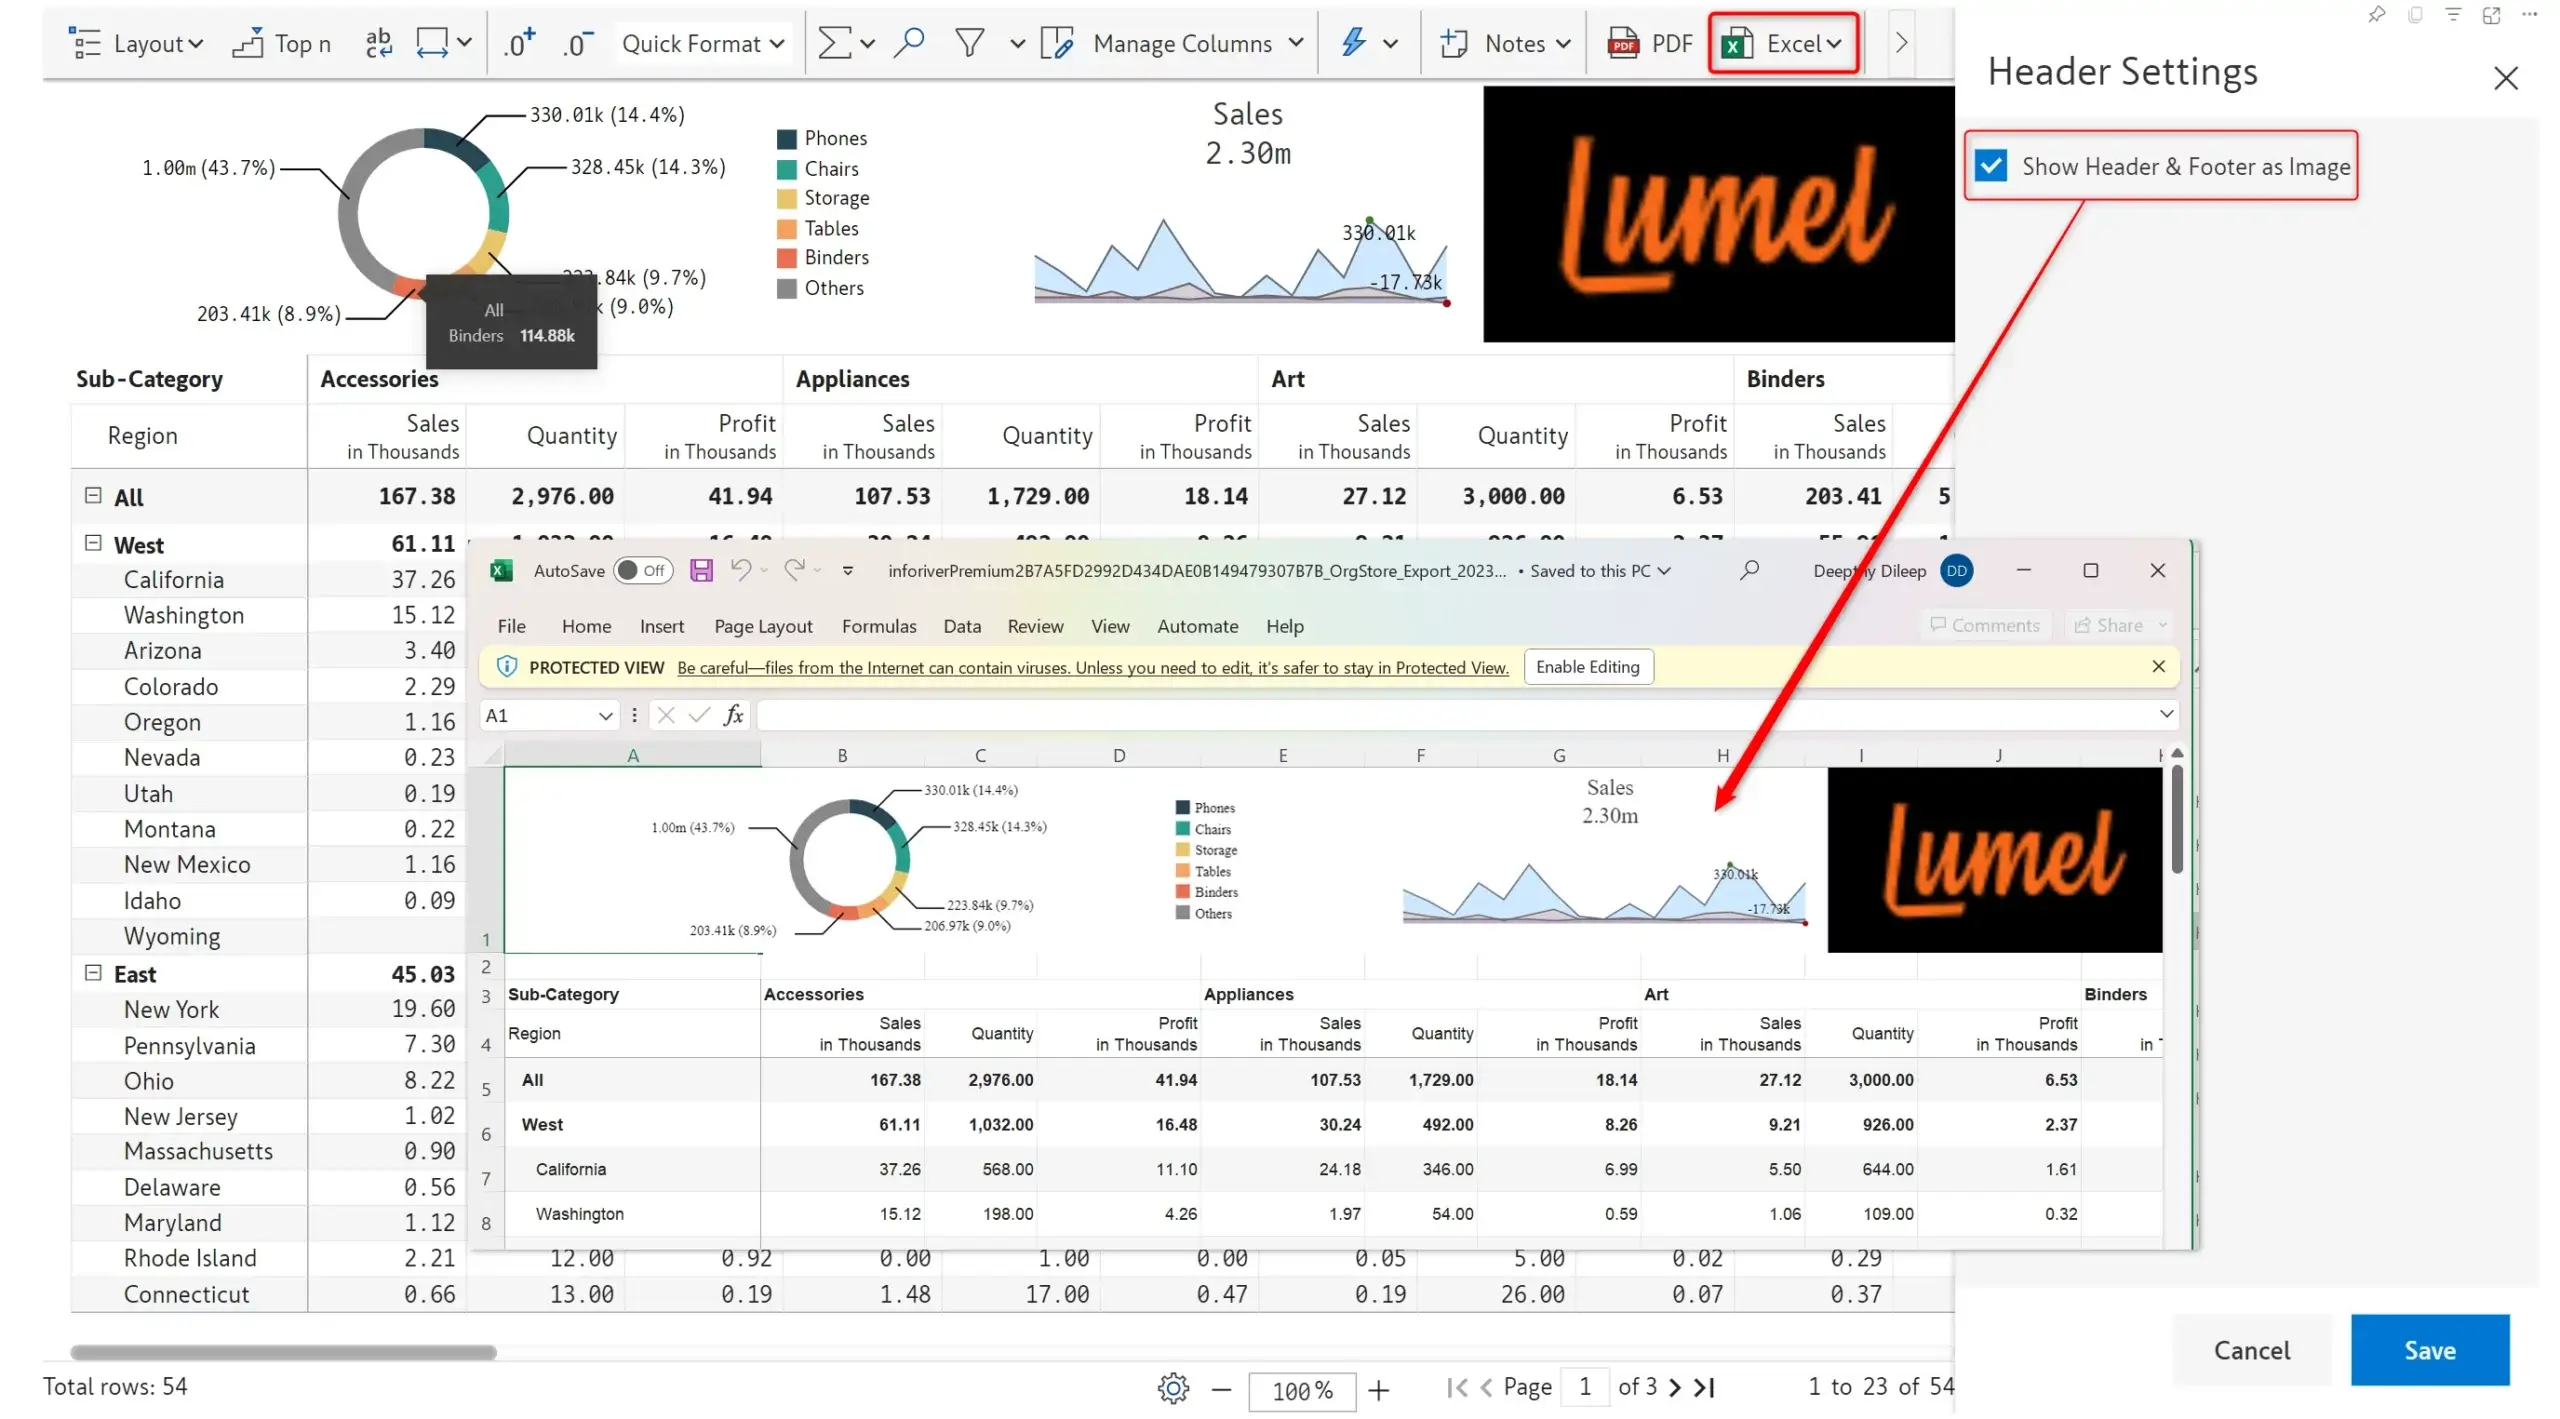
If your reports use charts or images in the header and footer, Inforiver enables you to export them as an image to an excel file.
We would love to hear your ideas for Inforiver – be it a cool new feature or an improvement on existing features. Visit the Inforiver Community to share your ideas, vote on other submissions, and interact with other users.

Inforiver helps enterprises consolidate planning, reporting & analytics on a single platform (Power BI). The no-code, self-service award-winning platform has been recognized as the industry’s best and is adopted by many Fortune 100 firms.
Inforiver is a product of Lumel, the #1 Power BI AppSource Partner. The firm serves over 3,000 customers worldwide through its portfolio of products offered under the brands Inforiver, EDITable, ValQ, and xViz.