Upcoming webinar on 'Inforiver Charts : The fastest way to deliver stories in Power BI', Aug 29th , Monday, 10.30 AM CST. Register Now
Upcoming webinar on 'Inforiver Charts : The fastest way to deliver stories in Power BI', Aug 29th , Monday, 10.30 AM CST. Register Now
The latest release of Inforiver Writeback Matrix offers even more of the best planning, reporting, and writeback solutions within Power BI with enterprise-grade collaborative features.
This release brings significant updates such as the role-based access control, data input rules, high-performance mode, and much more. We have also added several other enhancements based on your feedback—specifically to the audit log, comment panel, and scheduler to enhance your overall experience.
Here are the highlights:
1. Introducing user roles and permissions
2. Input rules for data input and forecast measures
3. Data streaming to Inforiver Analytics+
4. Optimized performance for large datasets
5.1. Faster writeback up to 30 million records
5.3. Support for EDITable data source
Please refer to our release notes for complete and comprehensive list of updates and enhancements.
User management in Inforiver is now even more secure and streamlined with our new, role-based access control policies. In this release, we have introduced additional user roles with clearly defined access permissions.
Admins can assign roles to users (or Active Directory groups) to specify what they can or cannot do with their Inforiver reports. For instance, an ‘input user’ can create data input entries, forecasts, scenarios, etc., while only an ‘input admin’ can change the related settings.
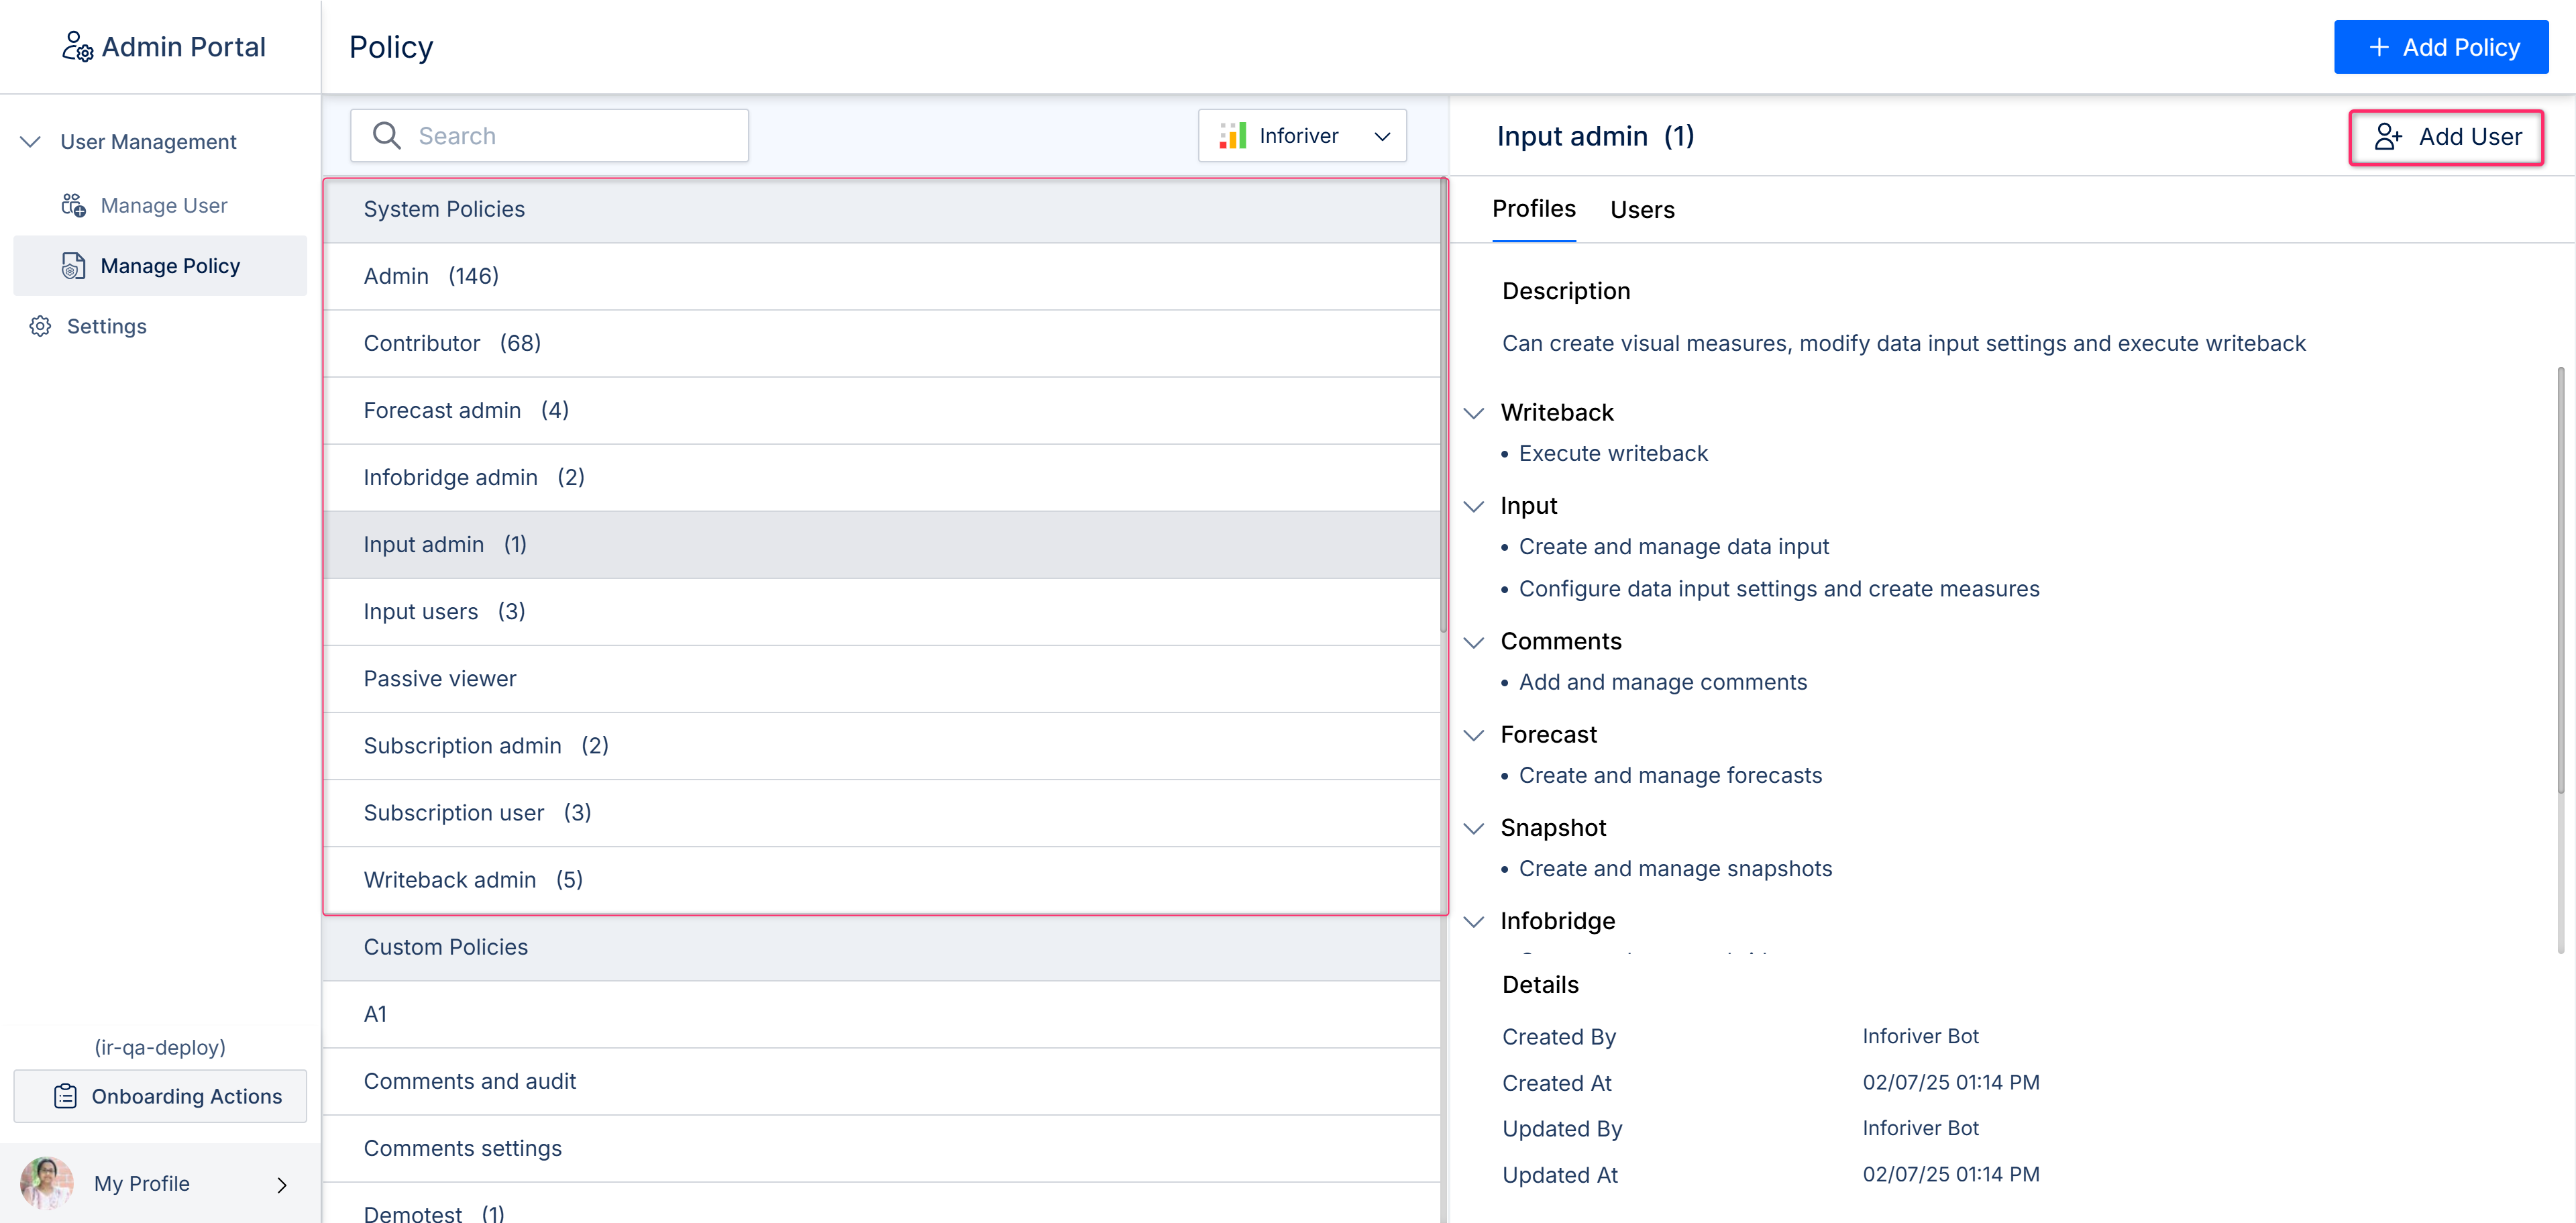
Here is a summary of default roles and their associated permissions:
| Roles | Permissions |
|---|---|
| Admin | Complete control within the product |
| Contributor | Member users have been migrated to this policy |
| Passive Viewer | View-only access to reports |
| Input Admin | Can create visual measures, modify data input settings and execute writeback |
| Input User | Can create data input entries, add comments, create bridge and execute writeback |
| Writeback Admin | Complete control over writeback settings |
| Forecast Admin | Can create forecast, bridge, input data entry and execute writeback |
| Subscription Admin | Create and manage subscriptions at tenant level |
| Subscription User | Create and manage report subscriptions |
| Infobridge Admin | Can create and manage bridge folders, enter data input and execute writeback |
Note: Existing admins and members have been moved to the ‘Admin’ and ‘Contributor’ roles, respectively. Admins retain their permissions for user management, general and writeback settings, while contributors can access all report-level settings.
In addition to the default roles, workspace admins can create custom roles and policies on a granular level, ensuring enhanced data governance and security.
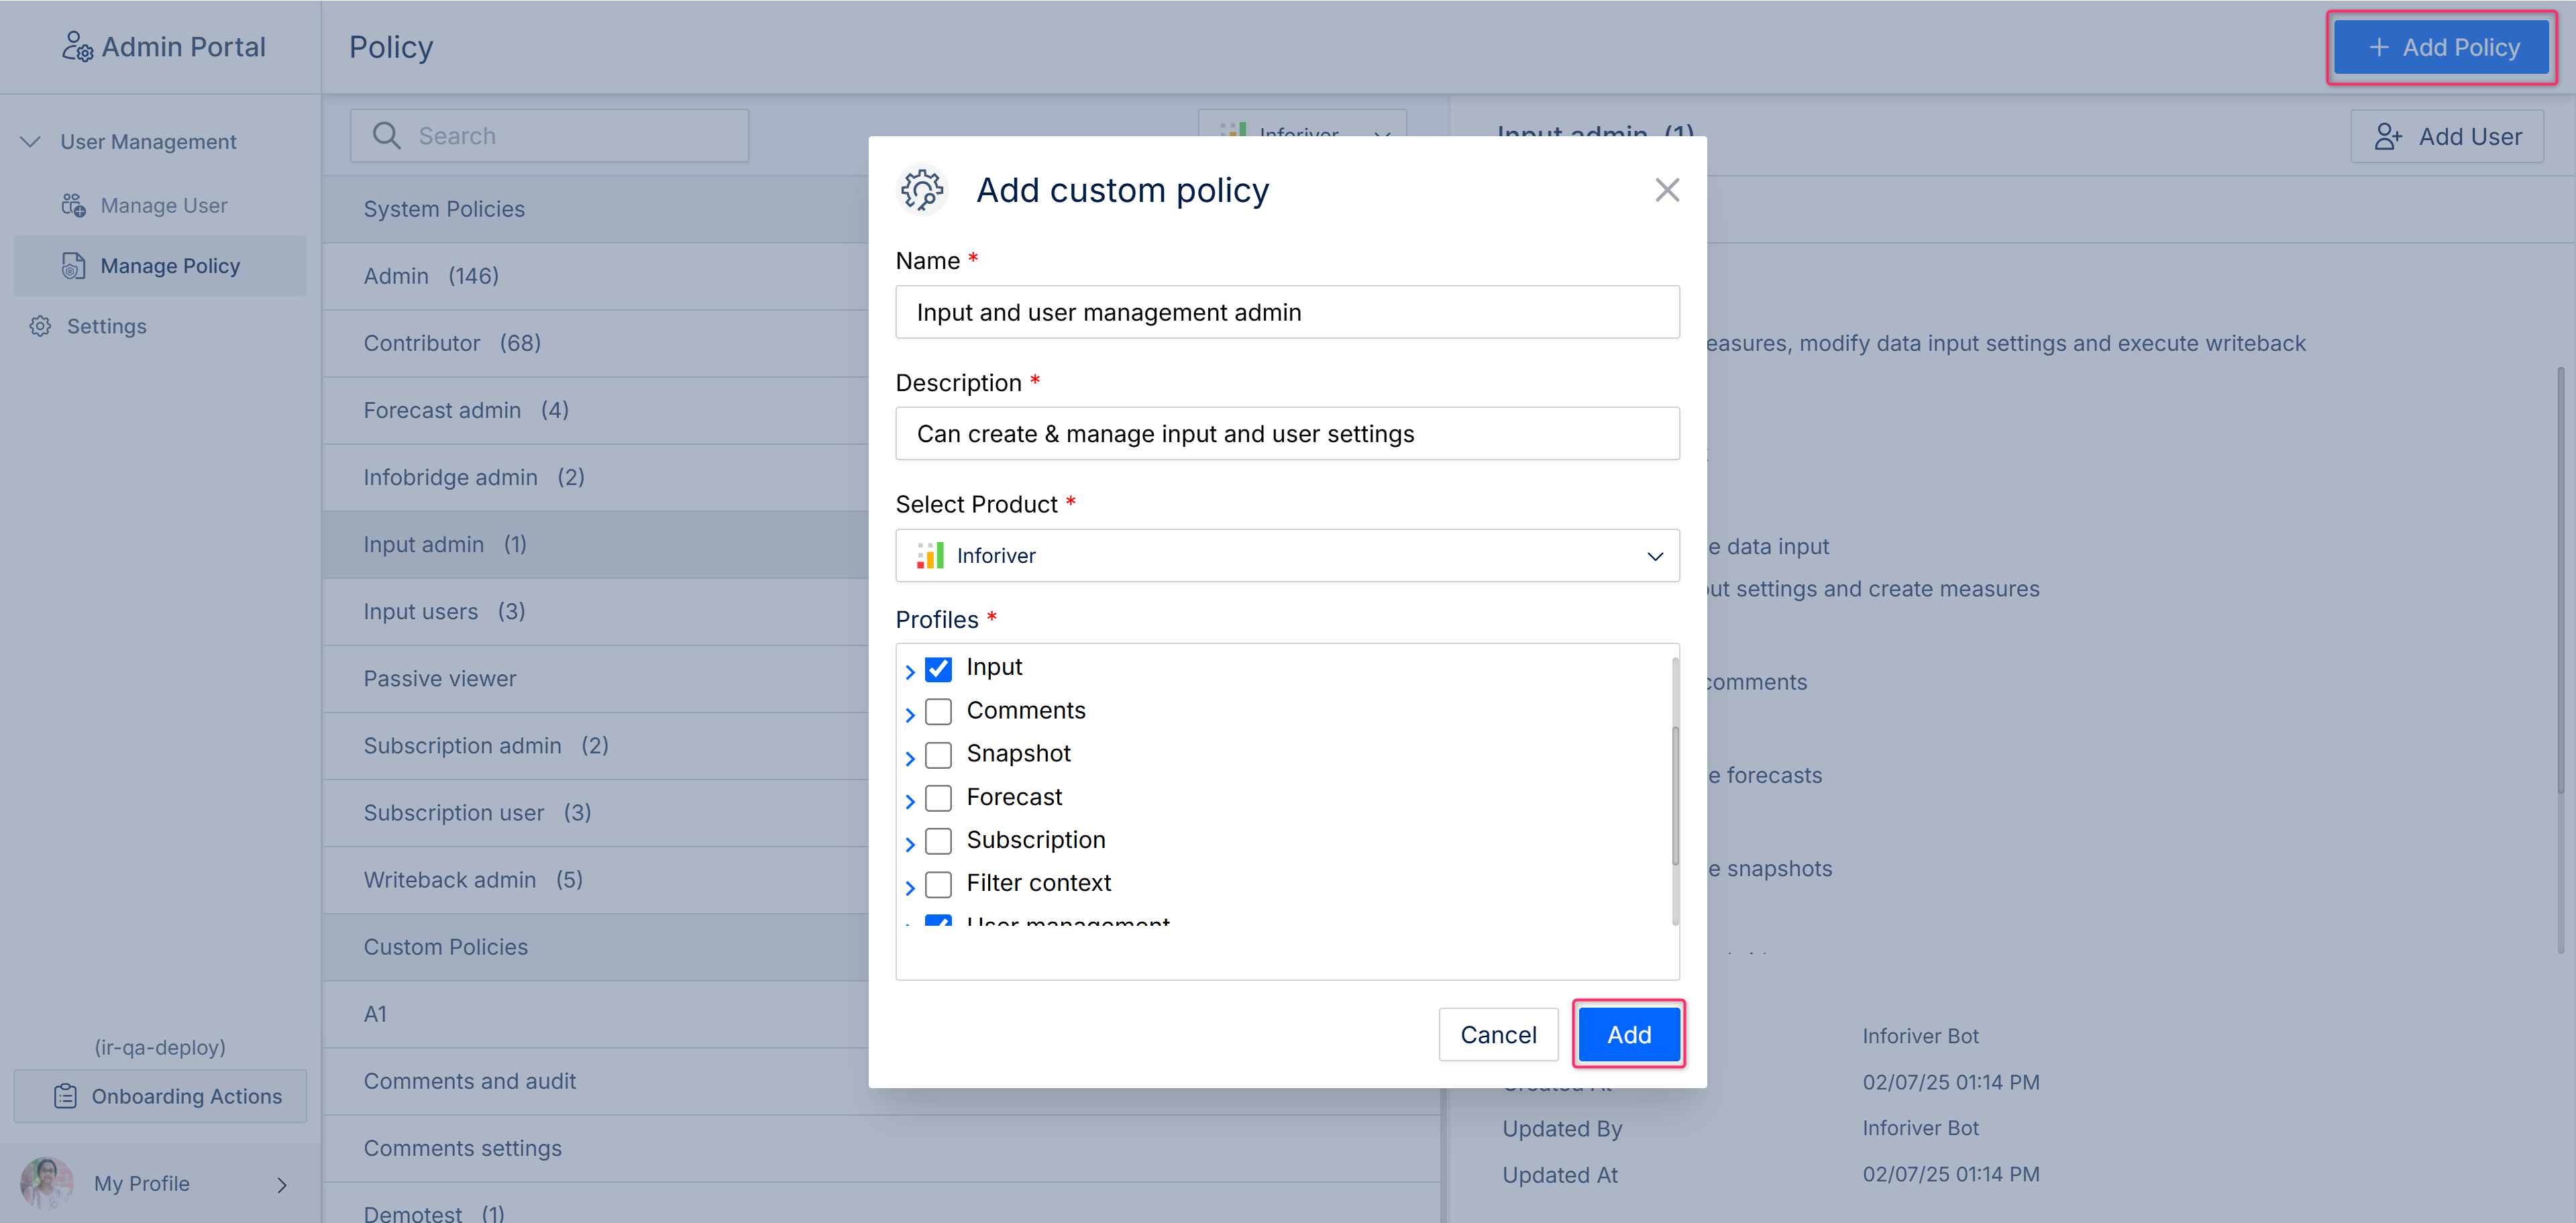
To know more about the complete list of permissions for each user role, please refer to our product documentation.
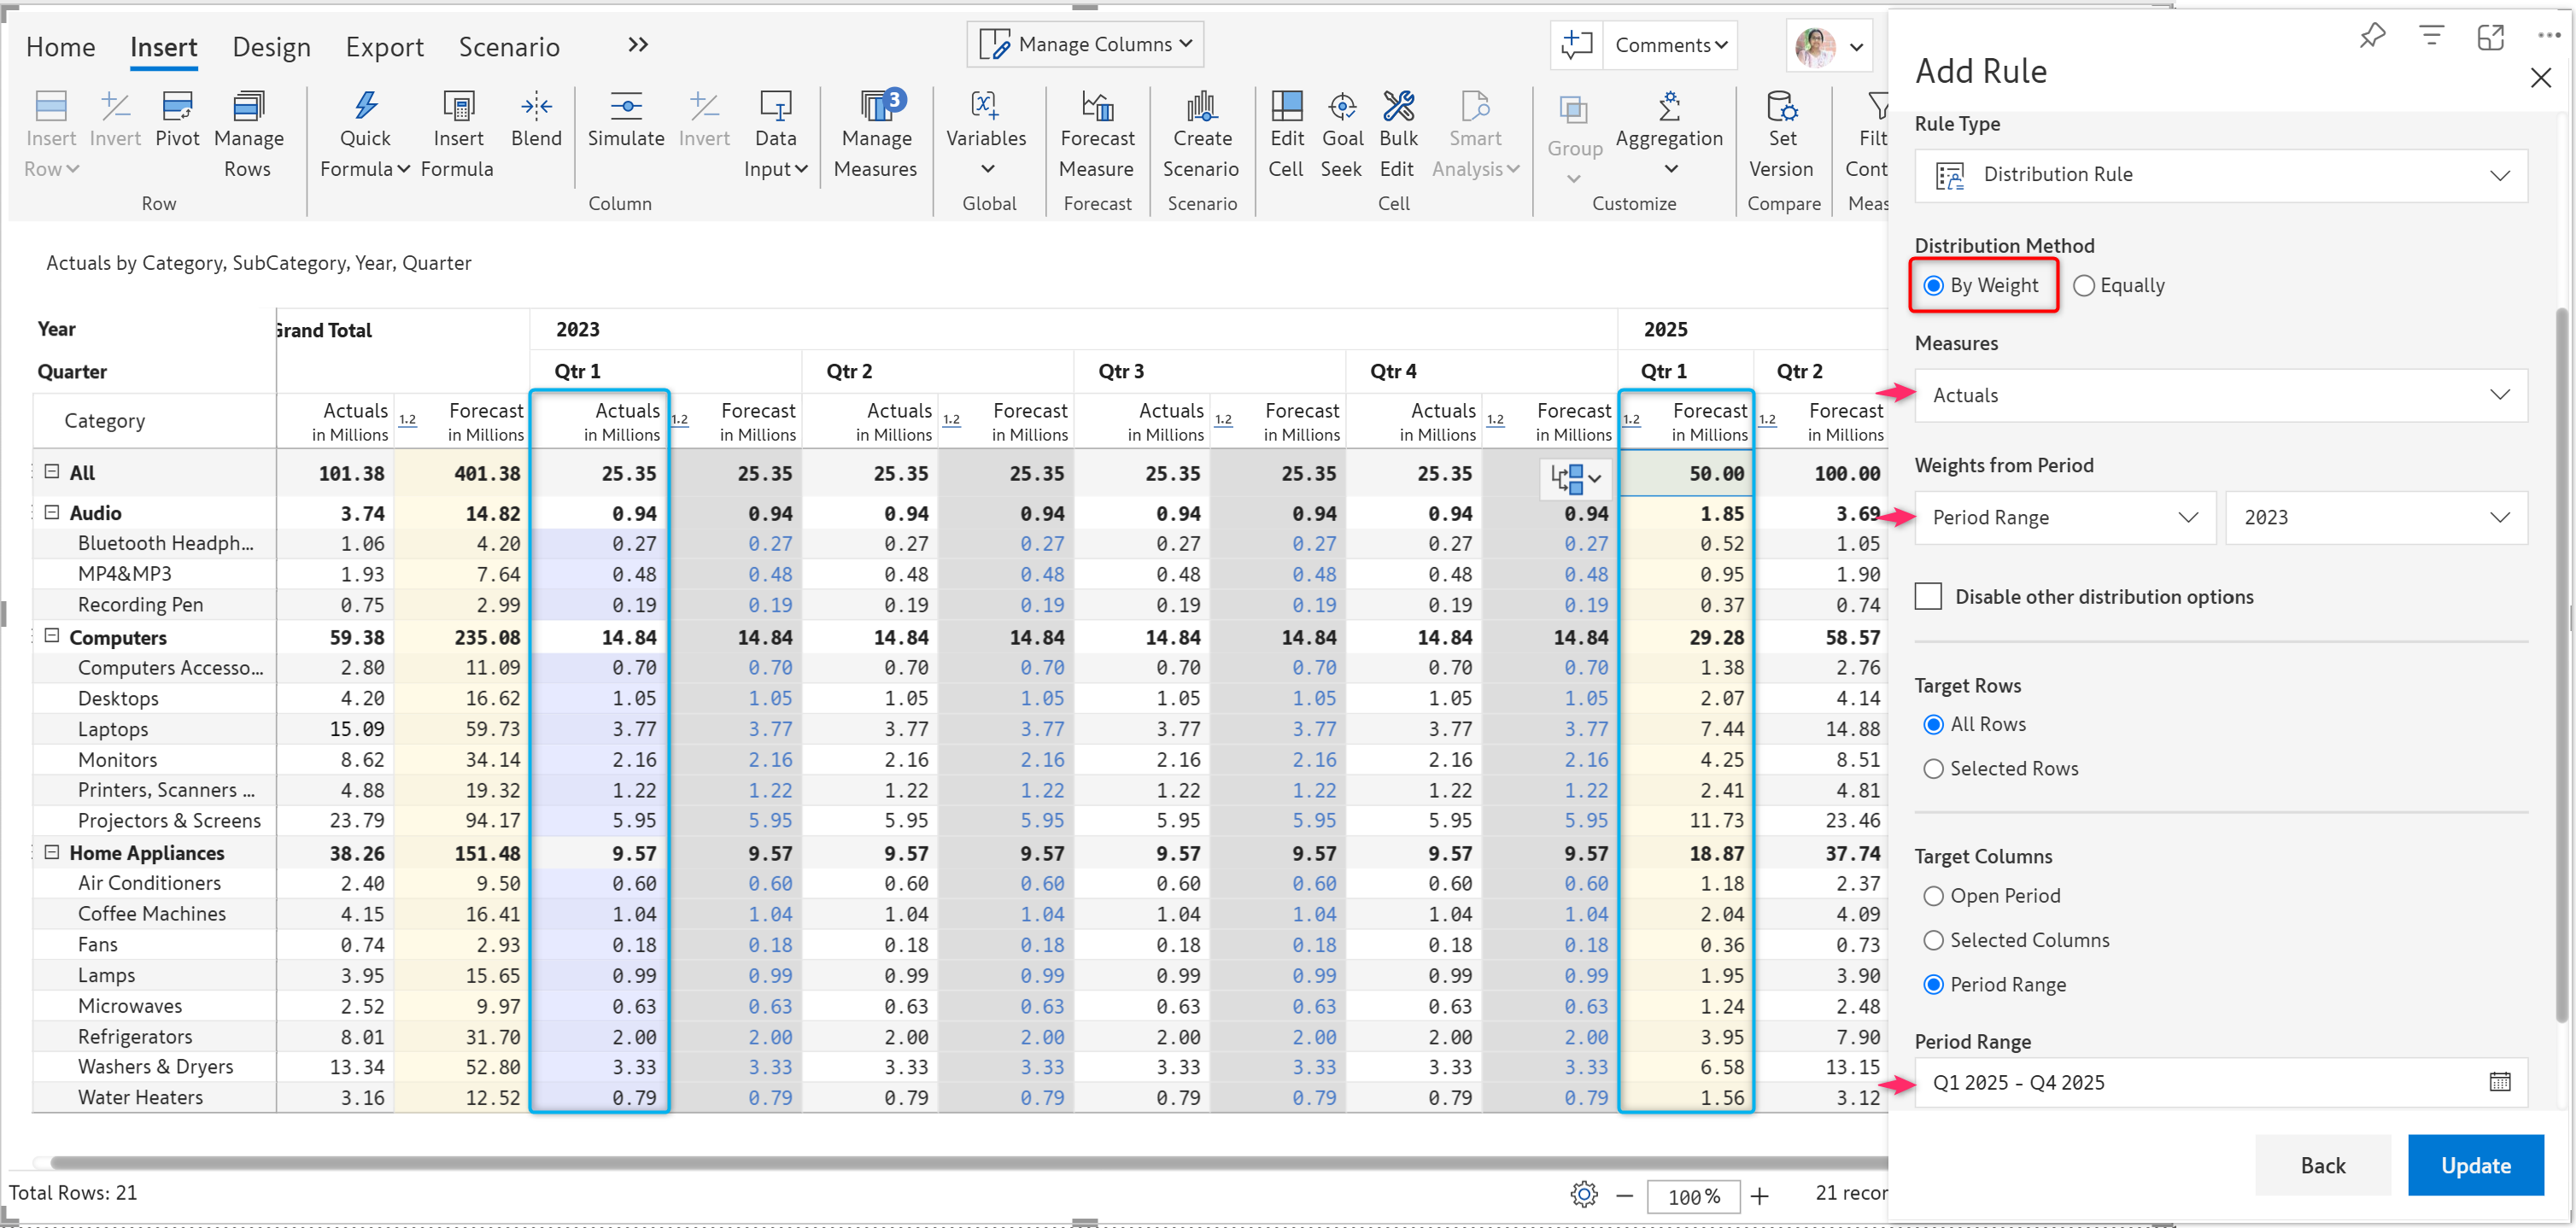
Manage your planning and forecasting workflows proactively by setting clear business controls in the form of input rules. These rules can include setting minimum and maximum thresholds, locking and unlocking cells to prevent changes to key values, and changing the distribution method.
When adding input and forecast columns to your report, you can configure these settings in the 'Data Input' and 'Forecast' side panels.
Additionally, we have now introduced a centralized menu option, 'Input Rules' for effective and collaborative management of input and forecast rules.
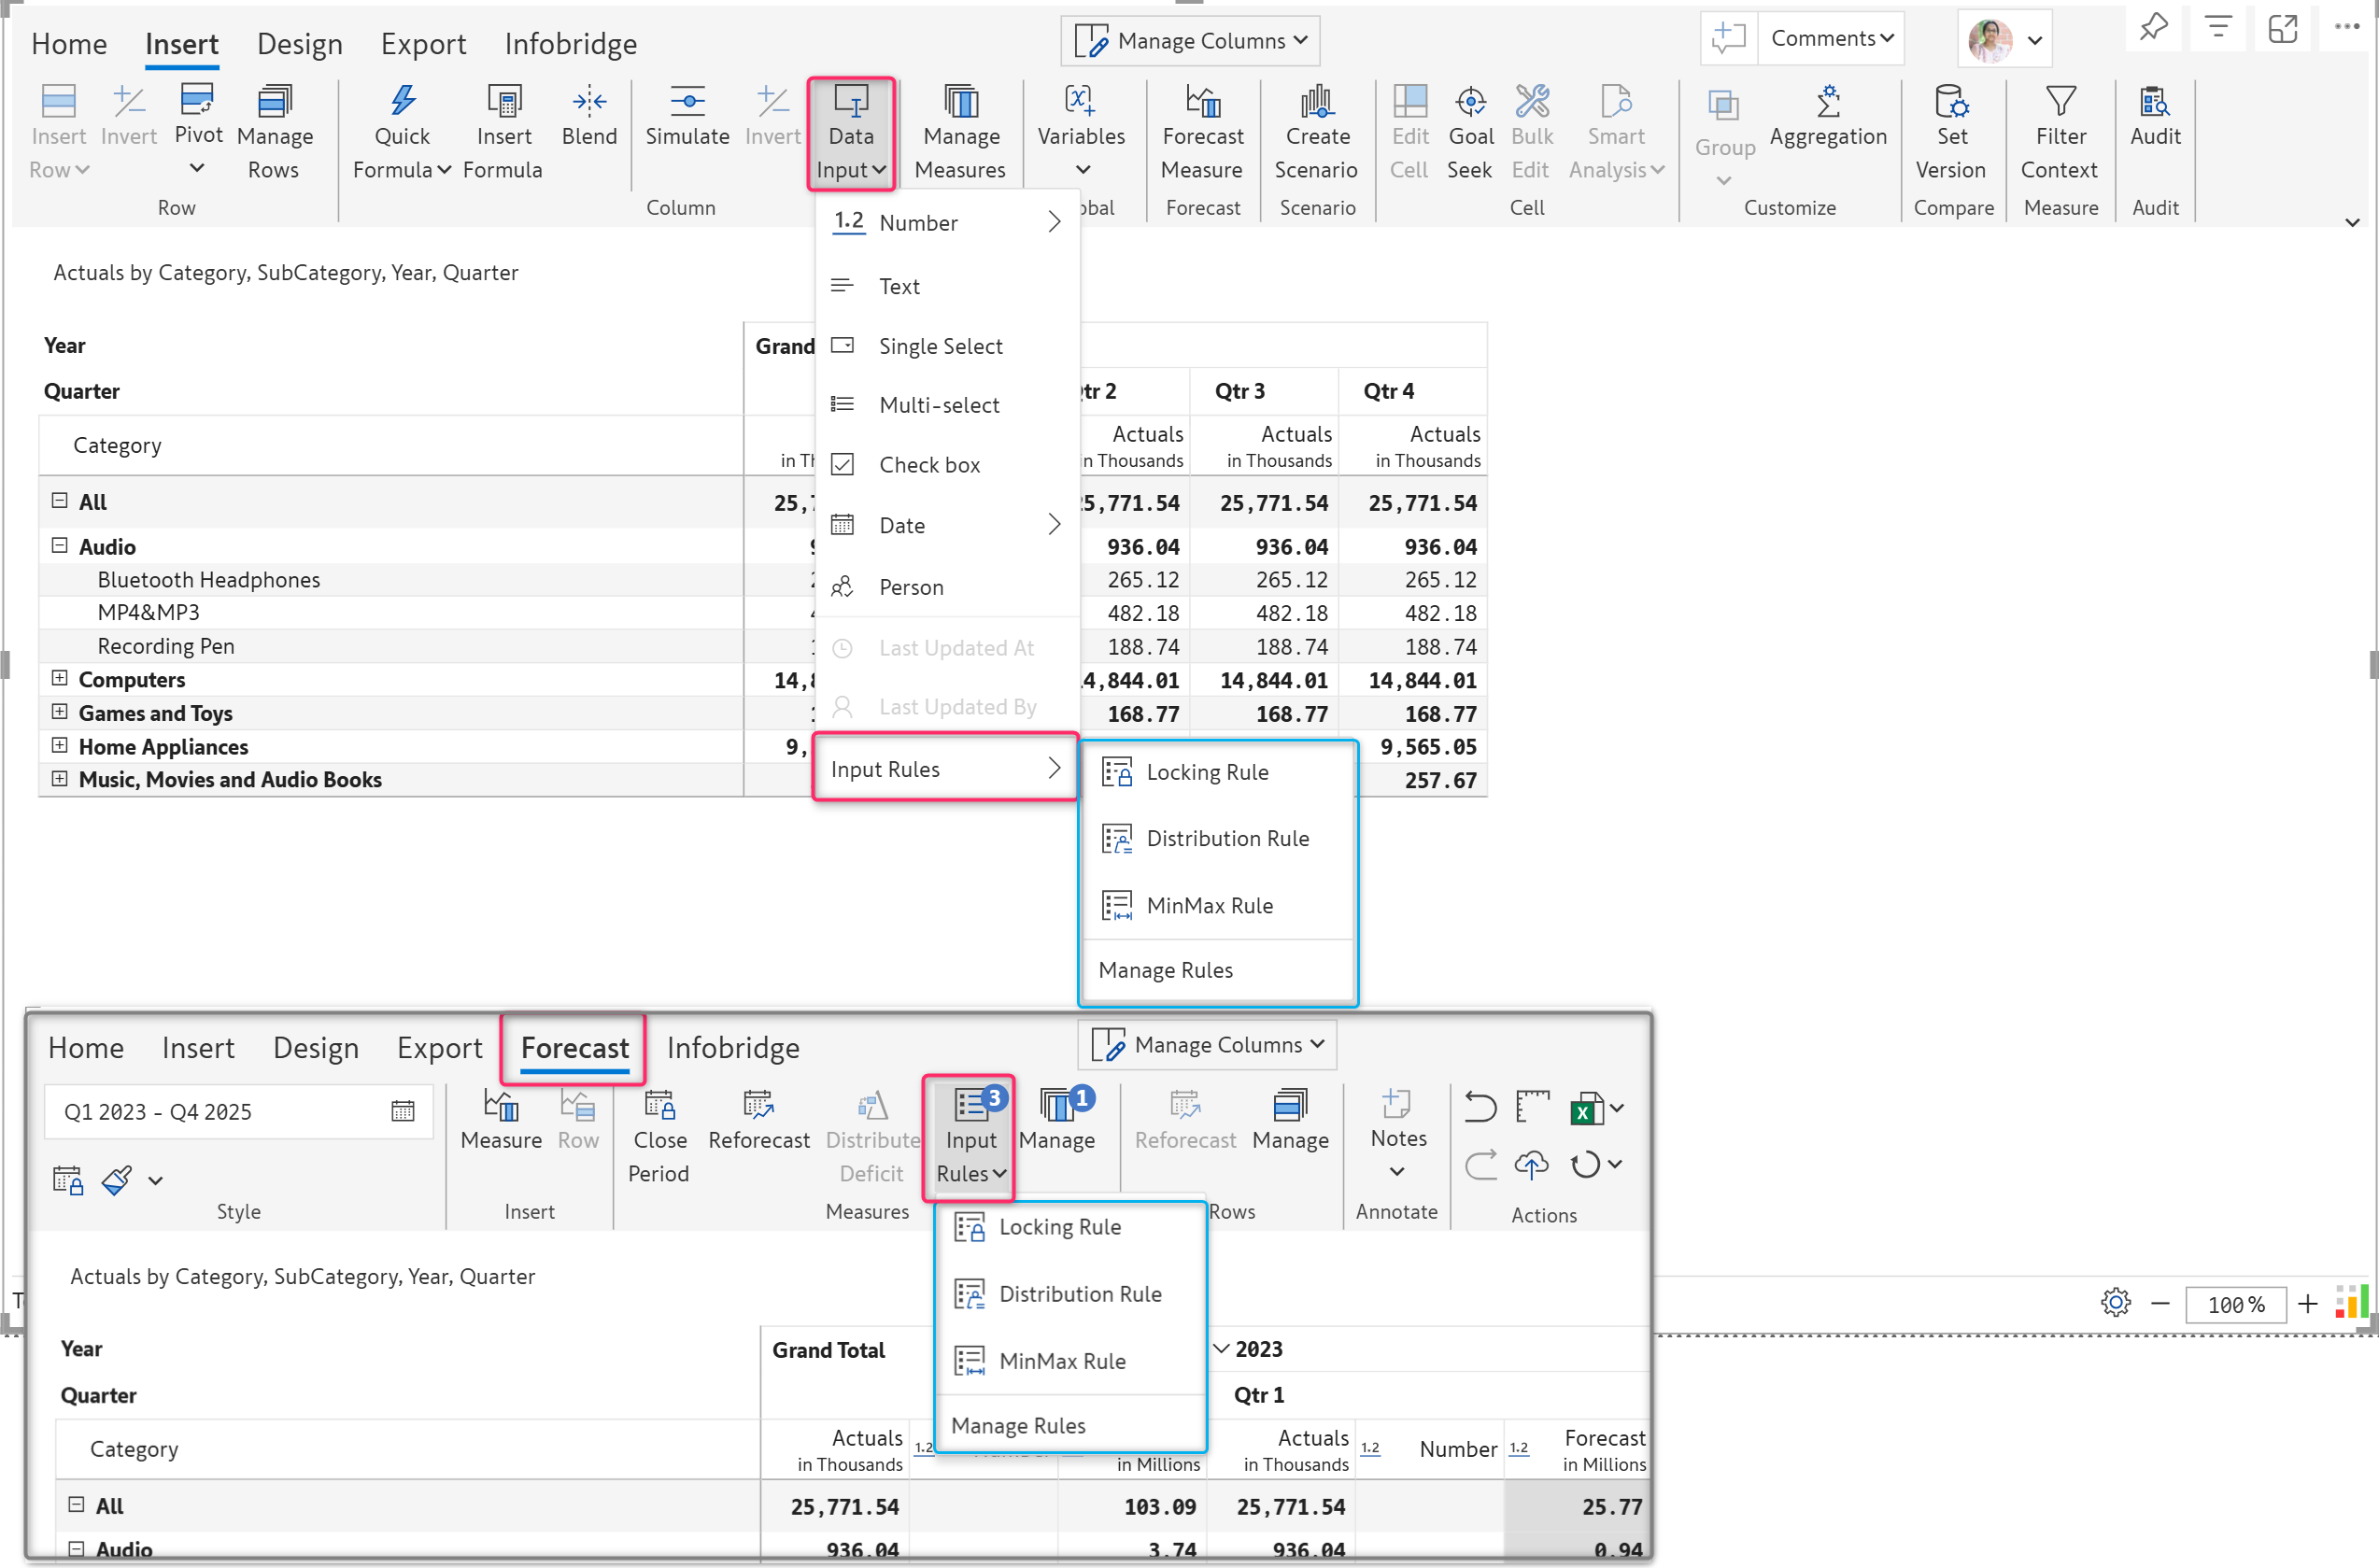
With this, you can:
Locking rule: Configure which cells should be locked and restricted from changes during distribution and forecasting to ensure key values remain unchanged.

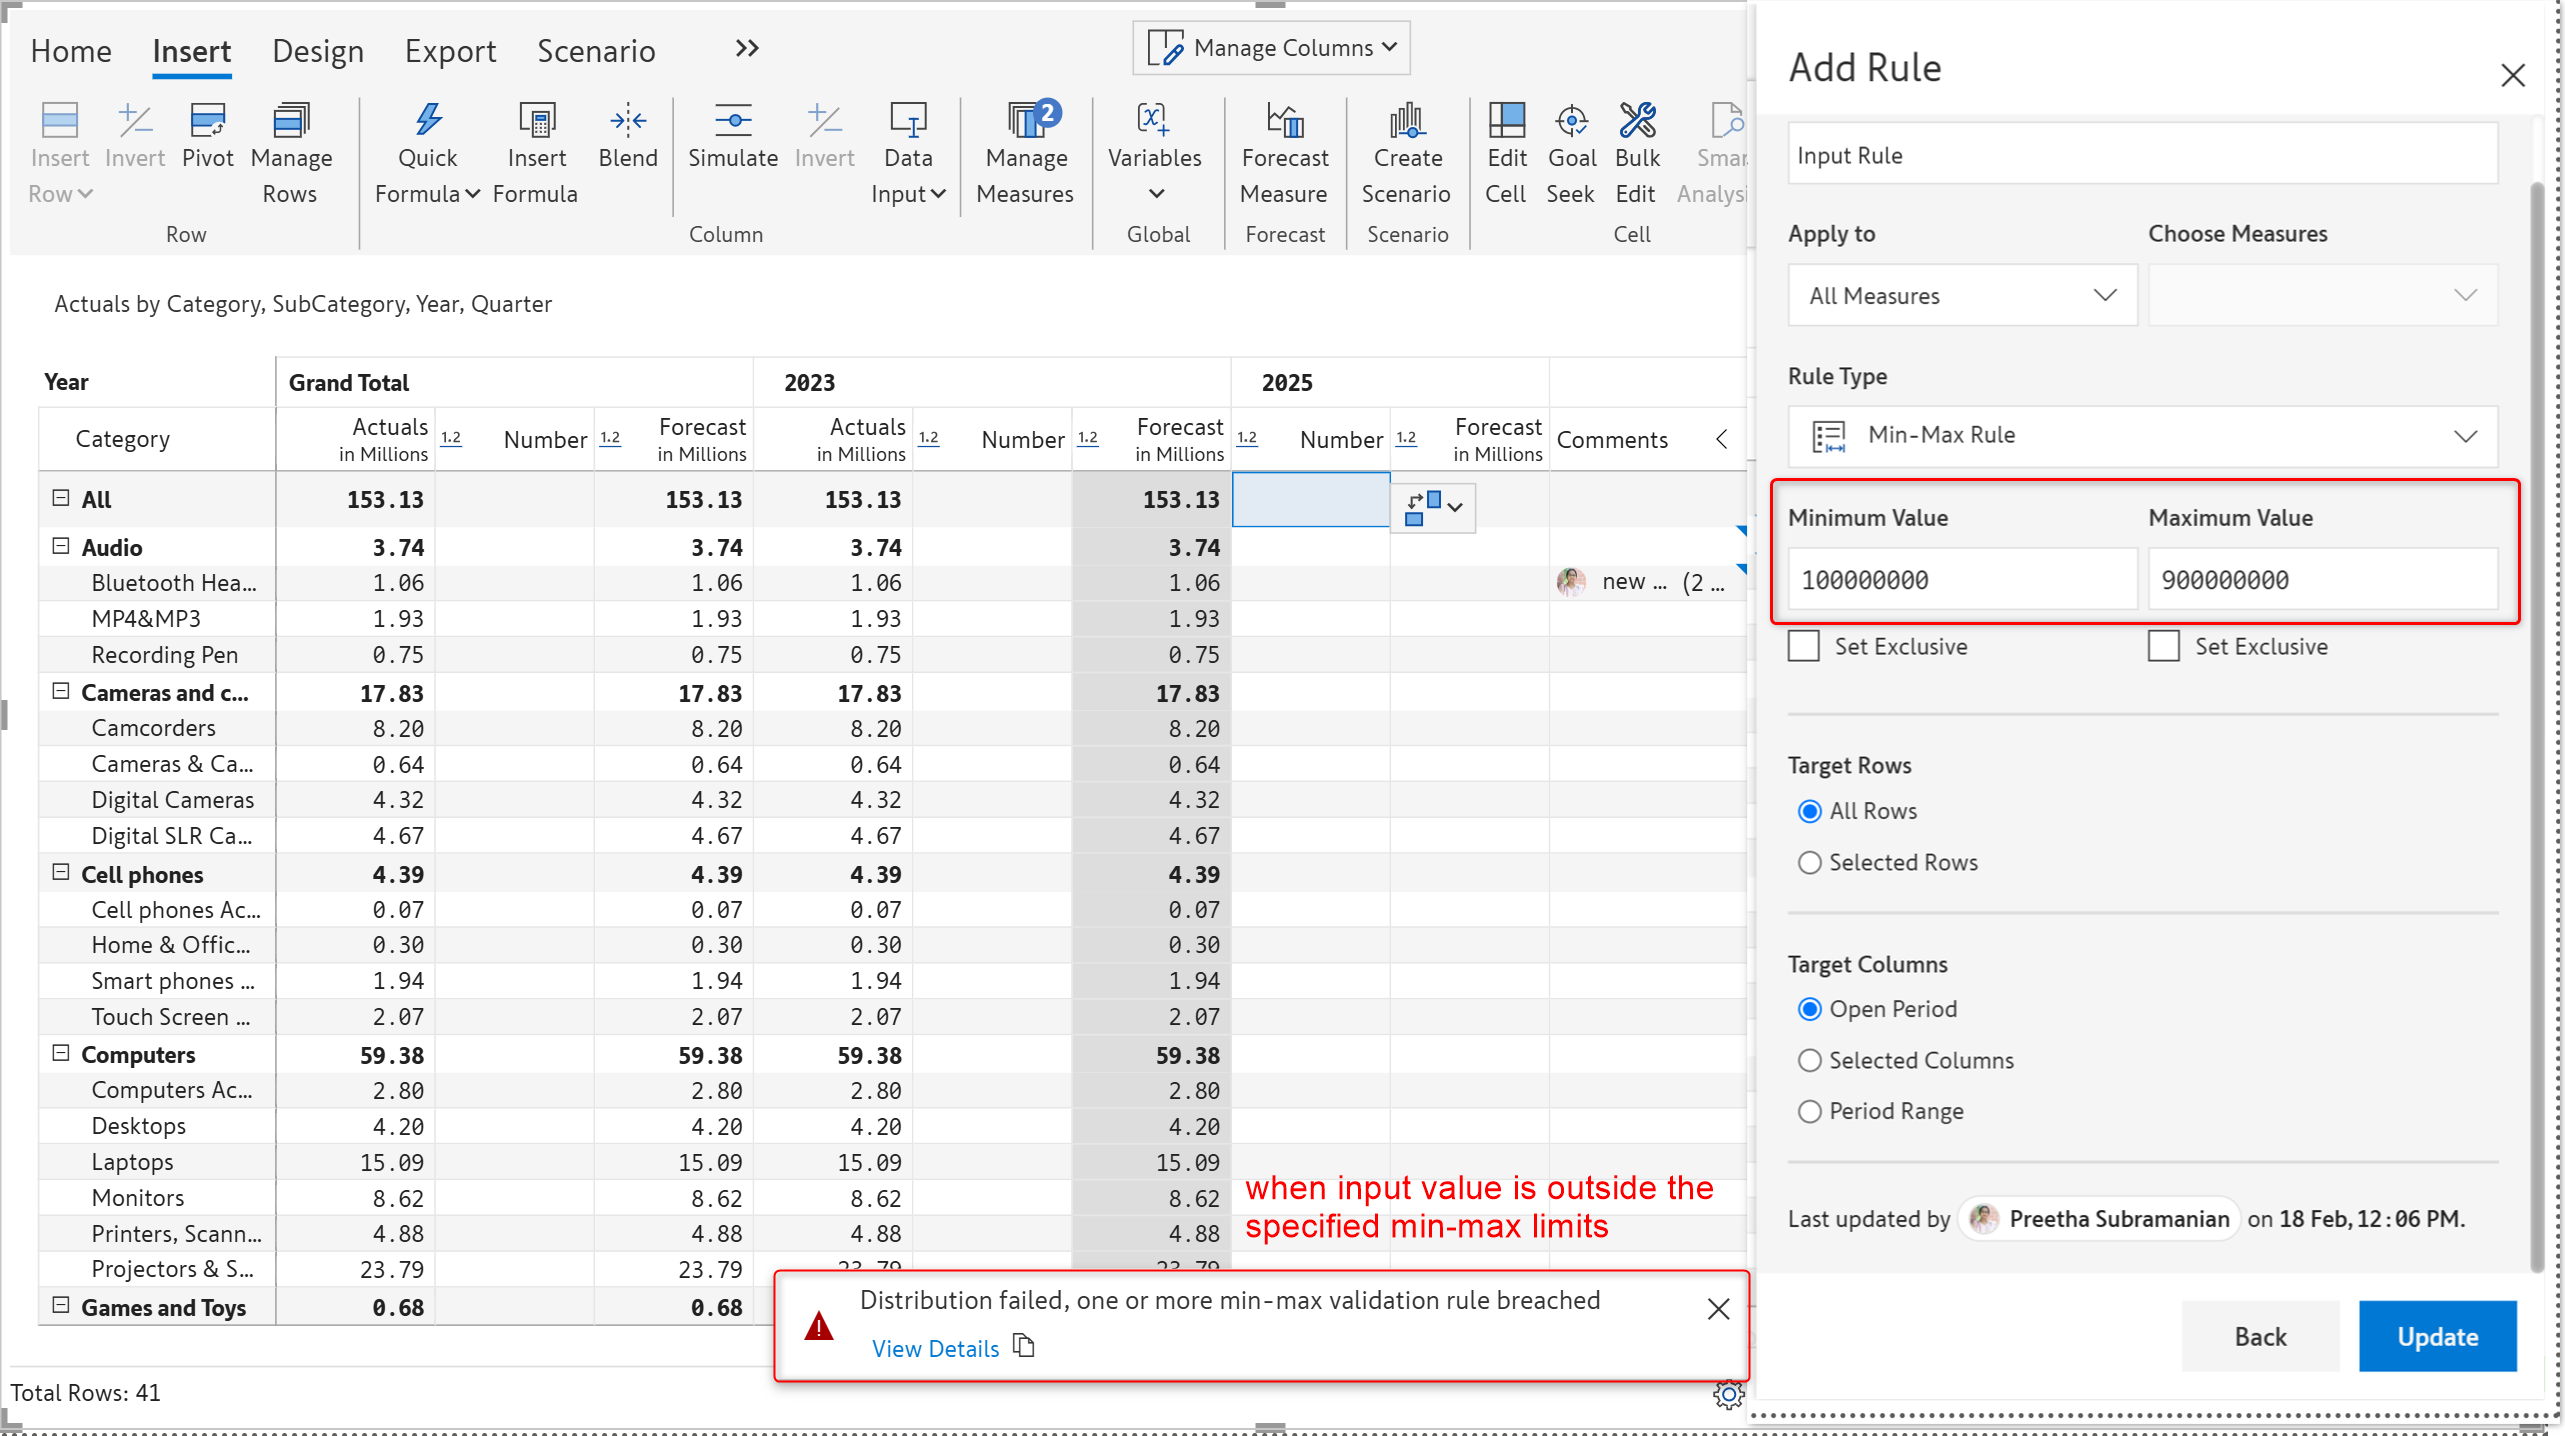
Min-Max rule: Set limits on the minimum and maximum values users can enter in these measures. These constraints ensure that the measure values do not fall below or exceed your specified limits during forecasting and distribution.
Distribution rule: Choose whether to distribute the total equally or to use a weighted distribution. You can also define the period range from which the weights will be derived, as well as the target rows and columns where they will be applied.
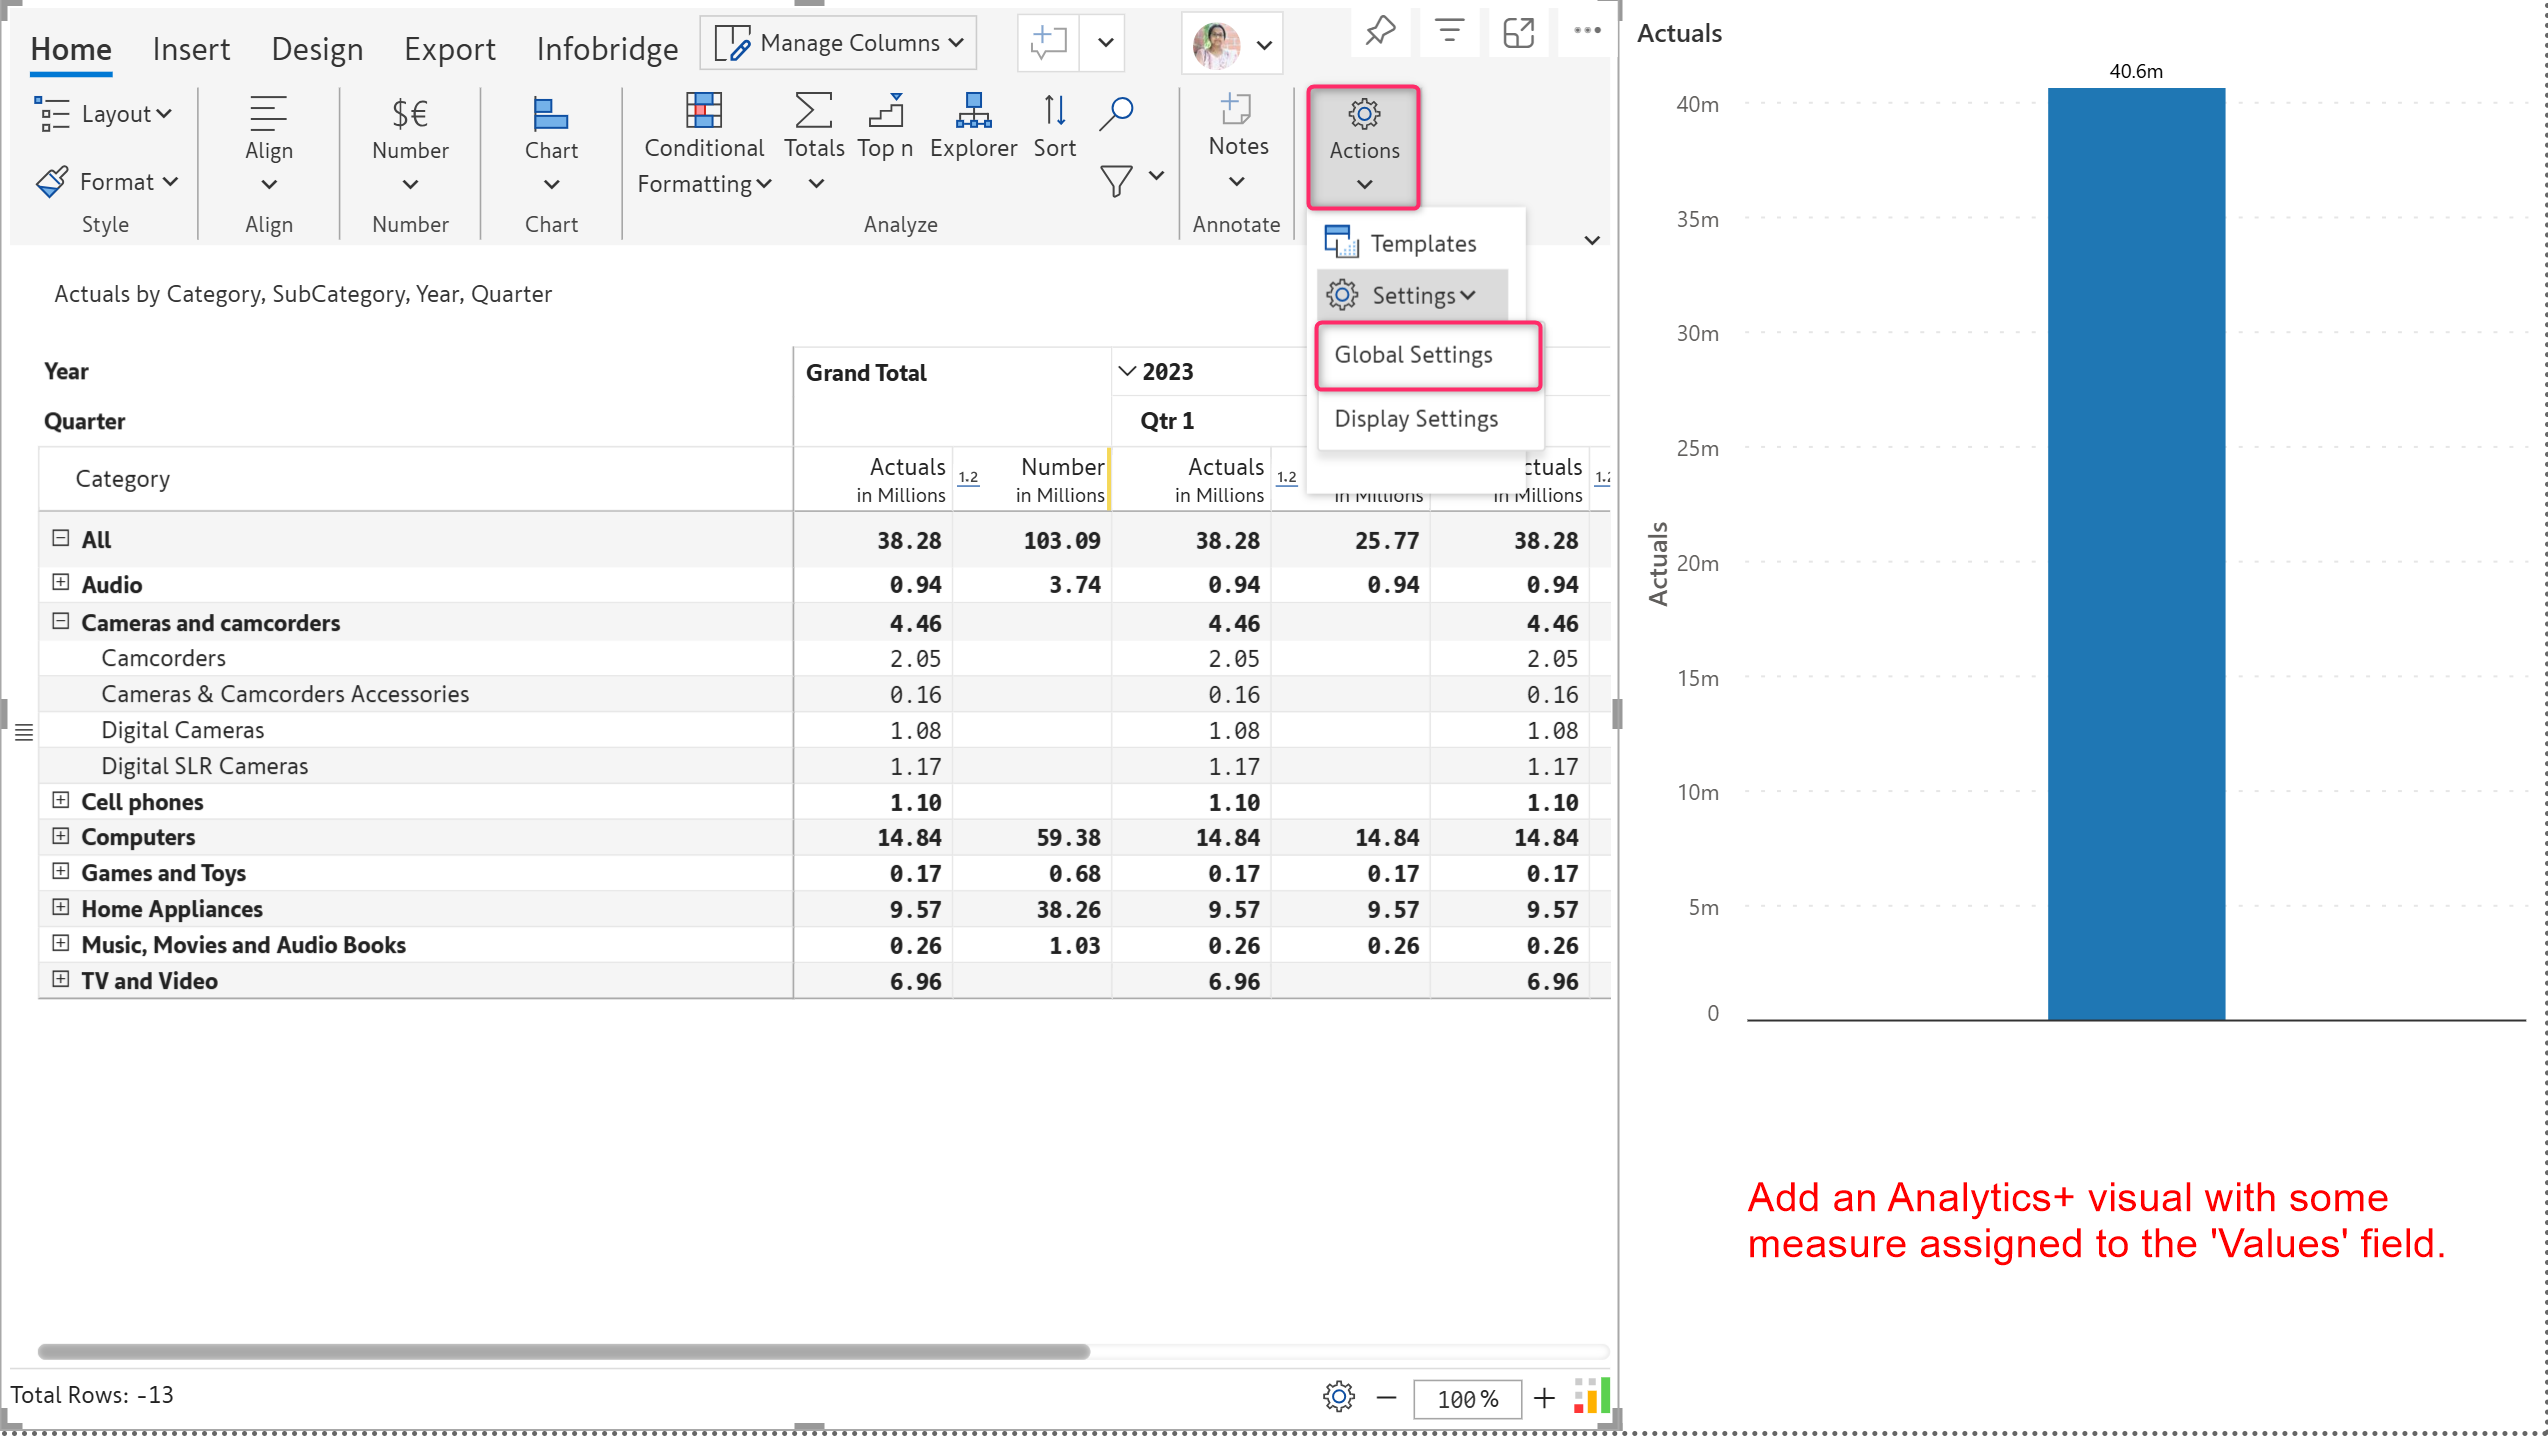
You can now create Analytics+ charts for your Inforiver reports with our new Data Streamer feature. With this, you can quickly stream your report’s dimension data, as well as native and custom input measures to an Analytics+ visual.
Create a sample Analytics+ visual with some measure added to it, as displayed below, side by side. Then, go to Settings > Global Settings > Data Streamer.
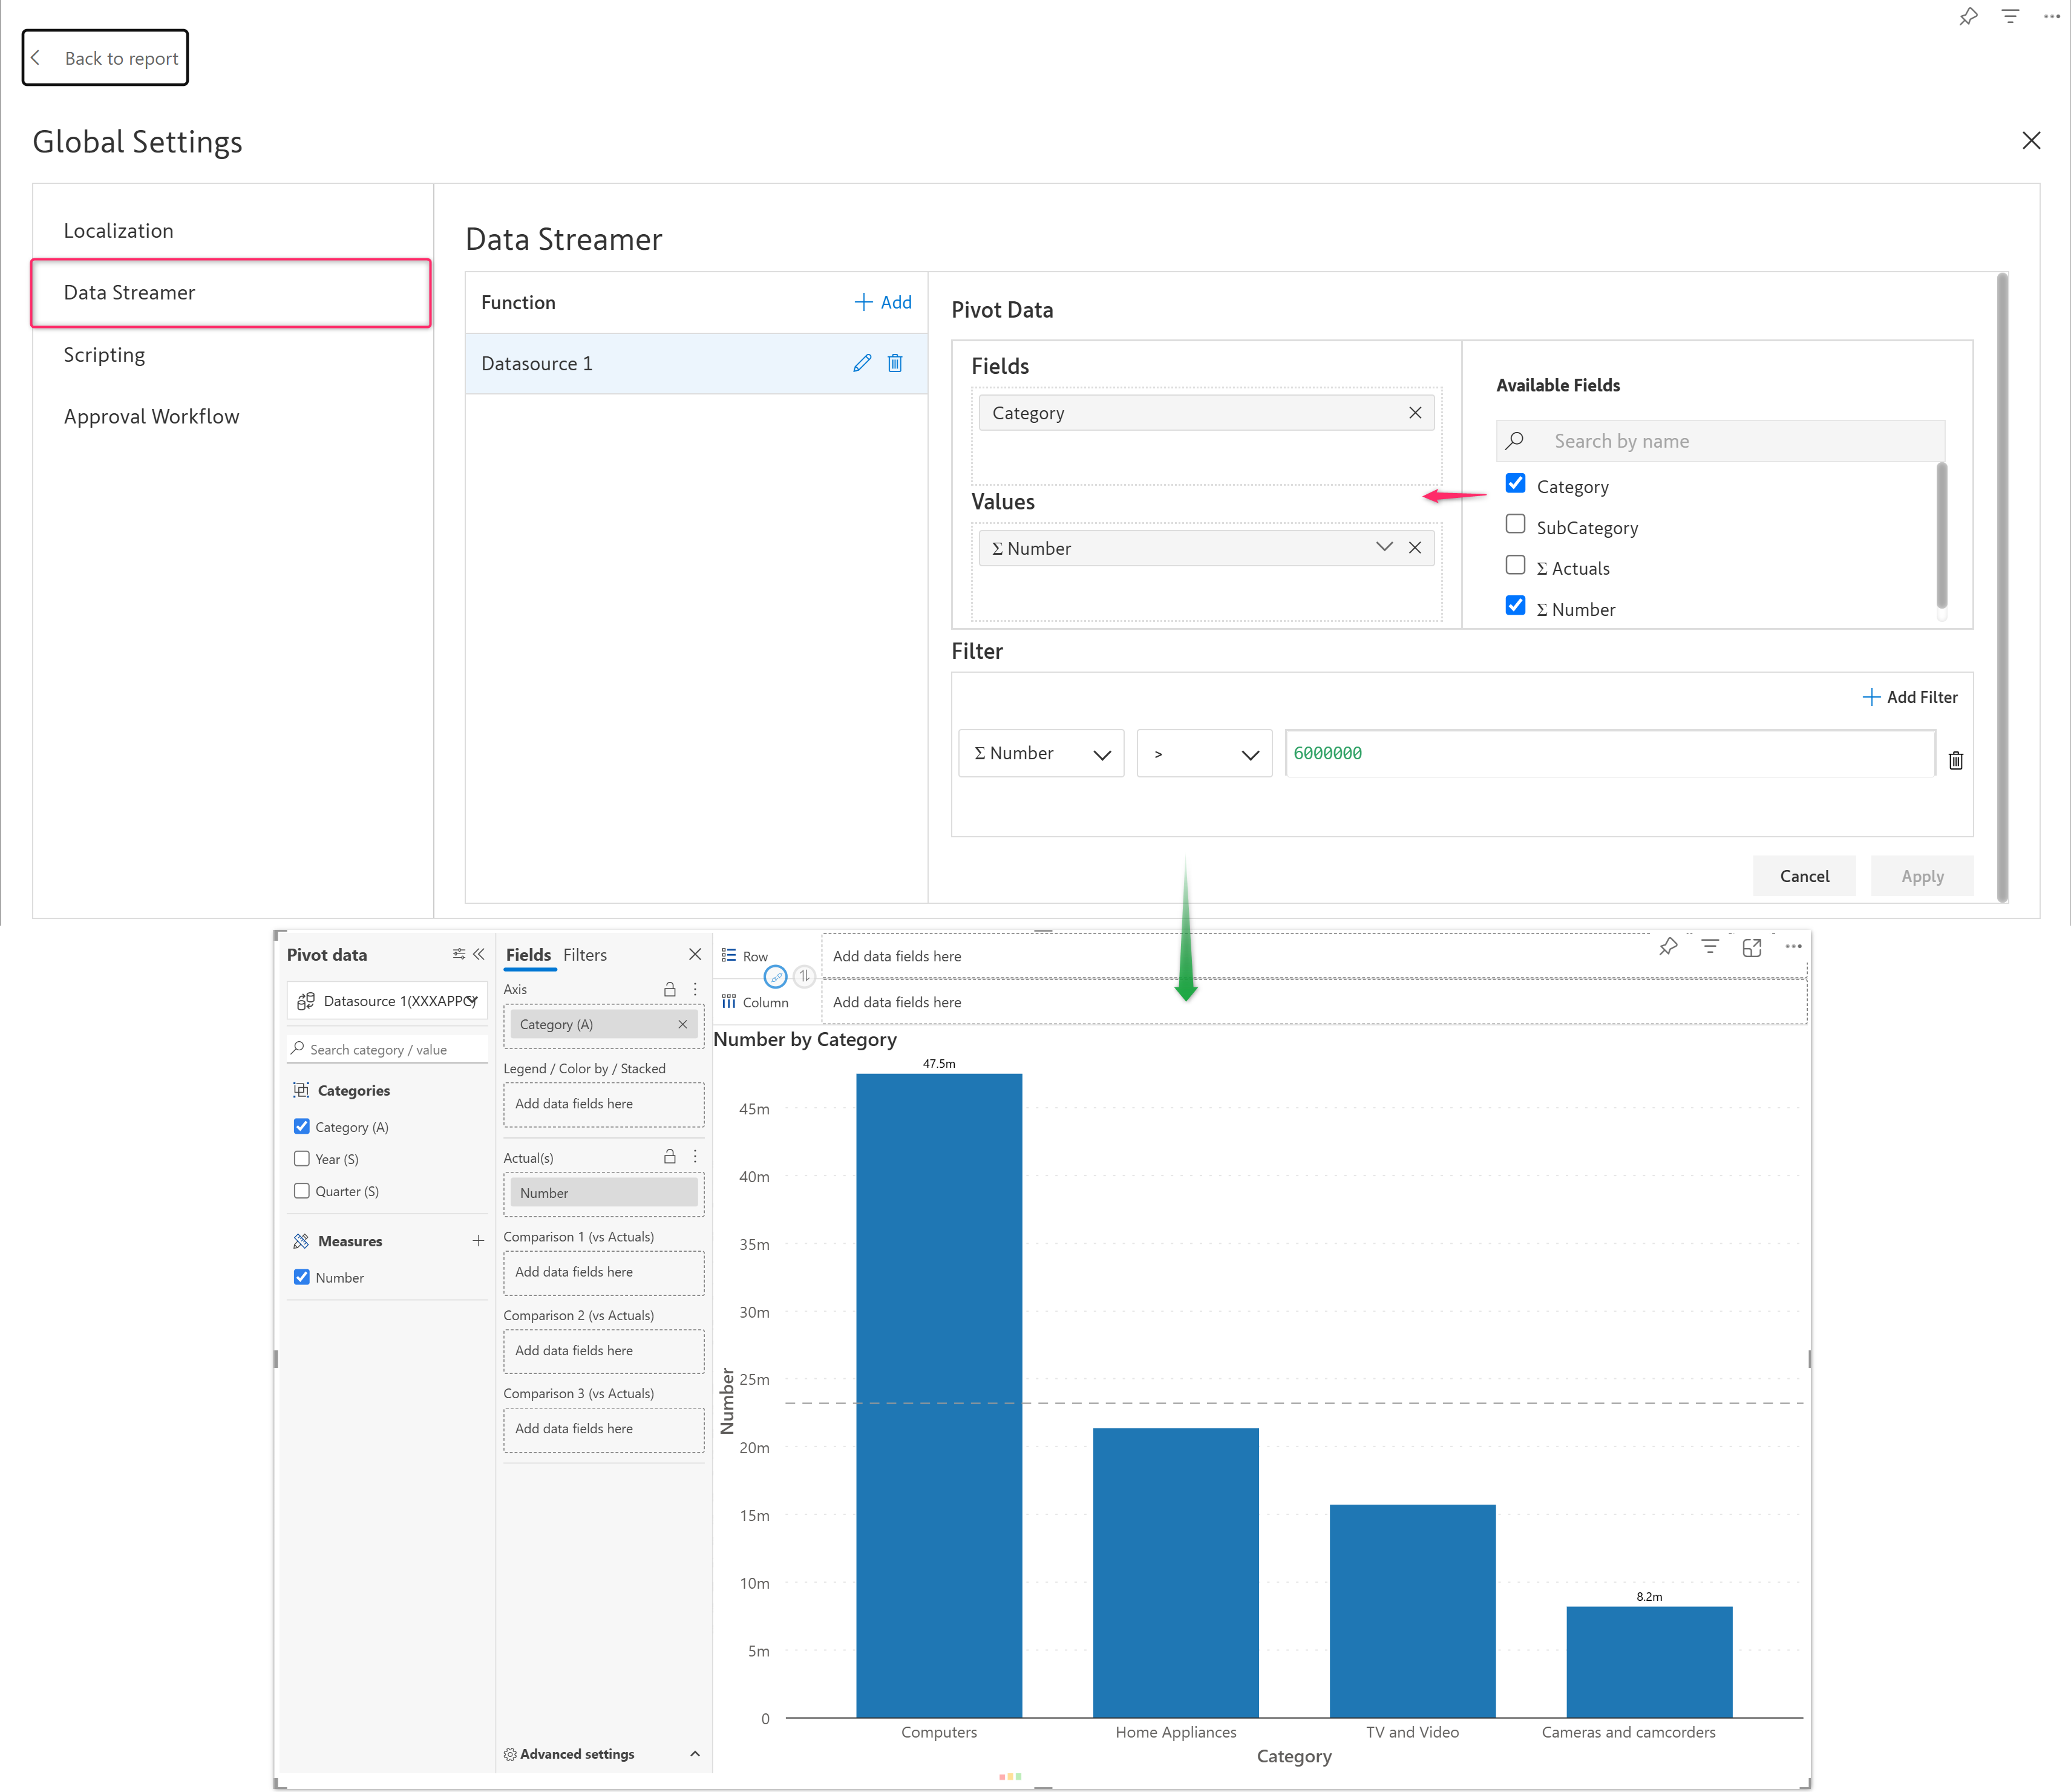
Create a new data source in the Data Streamer by configuring the necessary fields and values for your visualization. Add filters, if needed. In the Analytics+ visual, customize your chart with options such as Chart Type, Pivot Data, etc., and you’re all set.
Inforiver now supports faster and seamless working with large datasets, up to 1 million records with our new, high-performance mode.
This mode transforms the way the data input values are stored, retrieved, and updated. When enabled, you’ll notice improved performance and reduced processing times, especially with larger datasets.
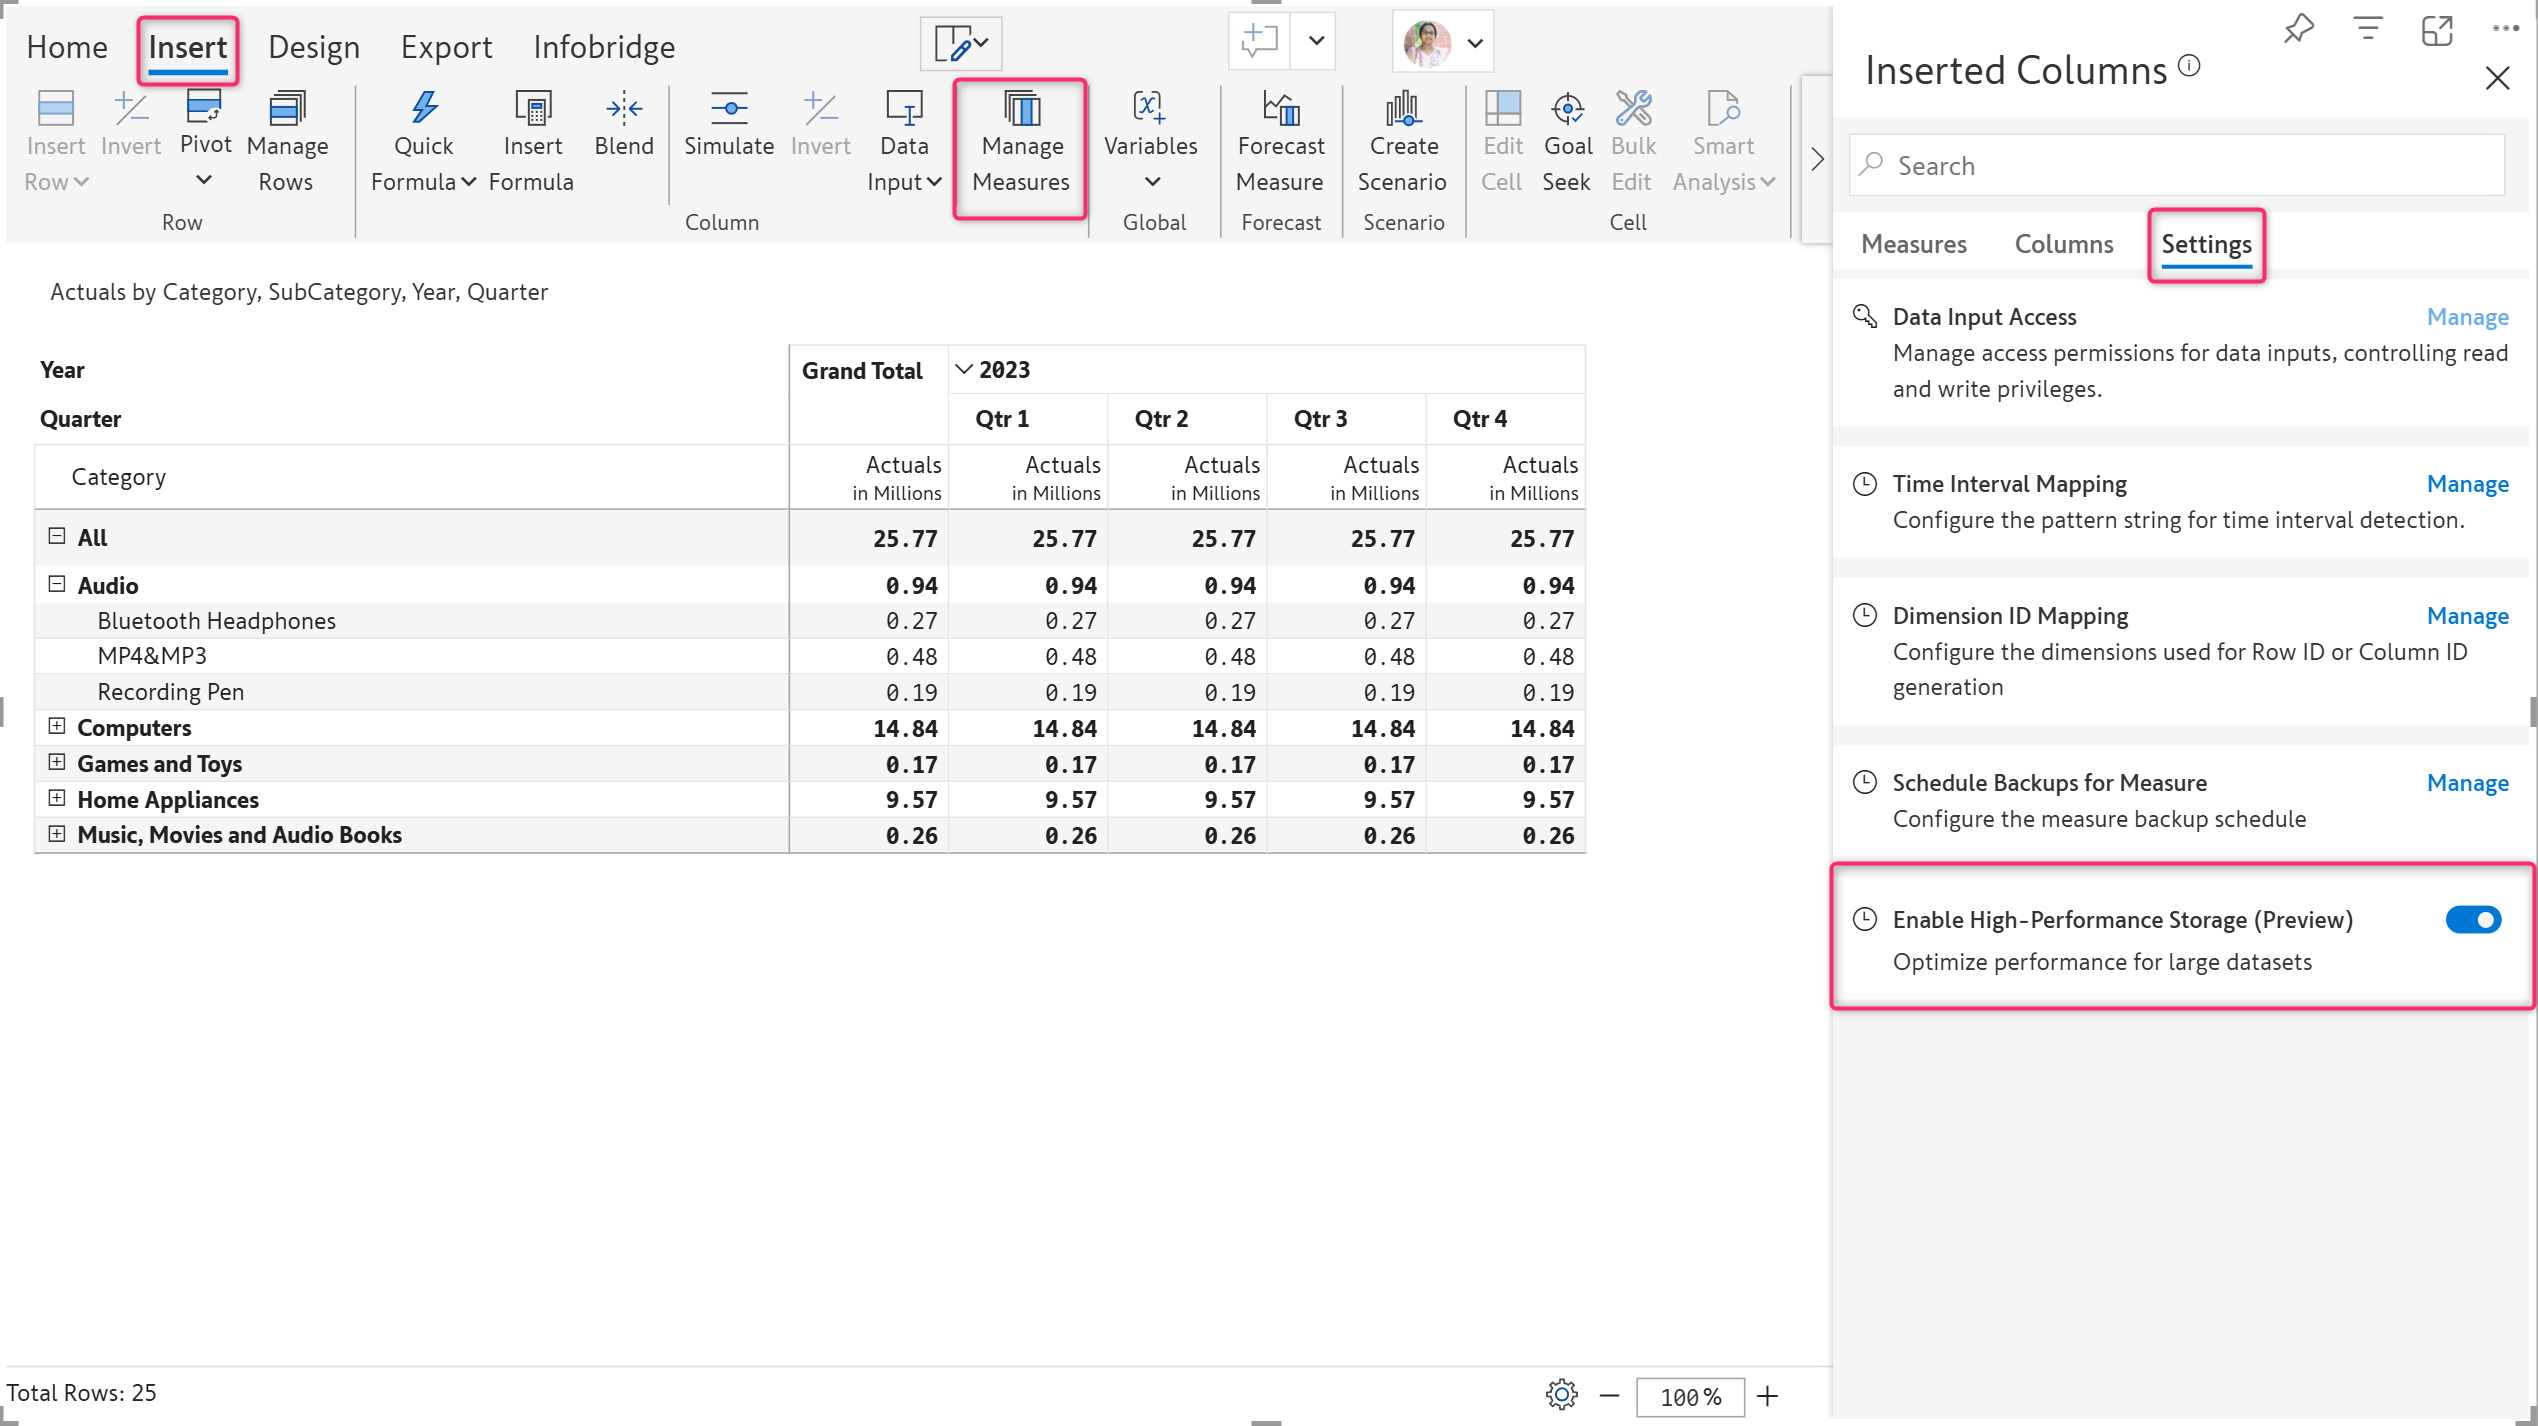
Please remember to enable this mode before creating any data input measures or columns in your report. Switching between modes is not supported after data input columns are created and updated unless you delete them.
Experience 3X faster writebacks in Infobridge, with enhanced efficiency and scalability. We have improved the Infobridge writeback process to accommodate larger datasets, now supporting up to 10 million records. For Azure SQL destinations, Infobridge writebacks can handle up to 30 million records.
You can now add data sources from OneLake to Infobridge. Ensure that you’re connected to your Fabric Lakehouse and Azure Data Lake Storage from the ‘My Integrations’ page in the console, and you are good to go.
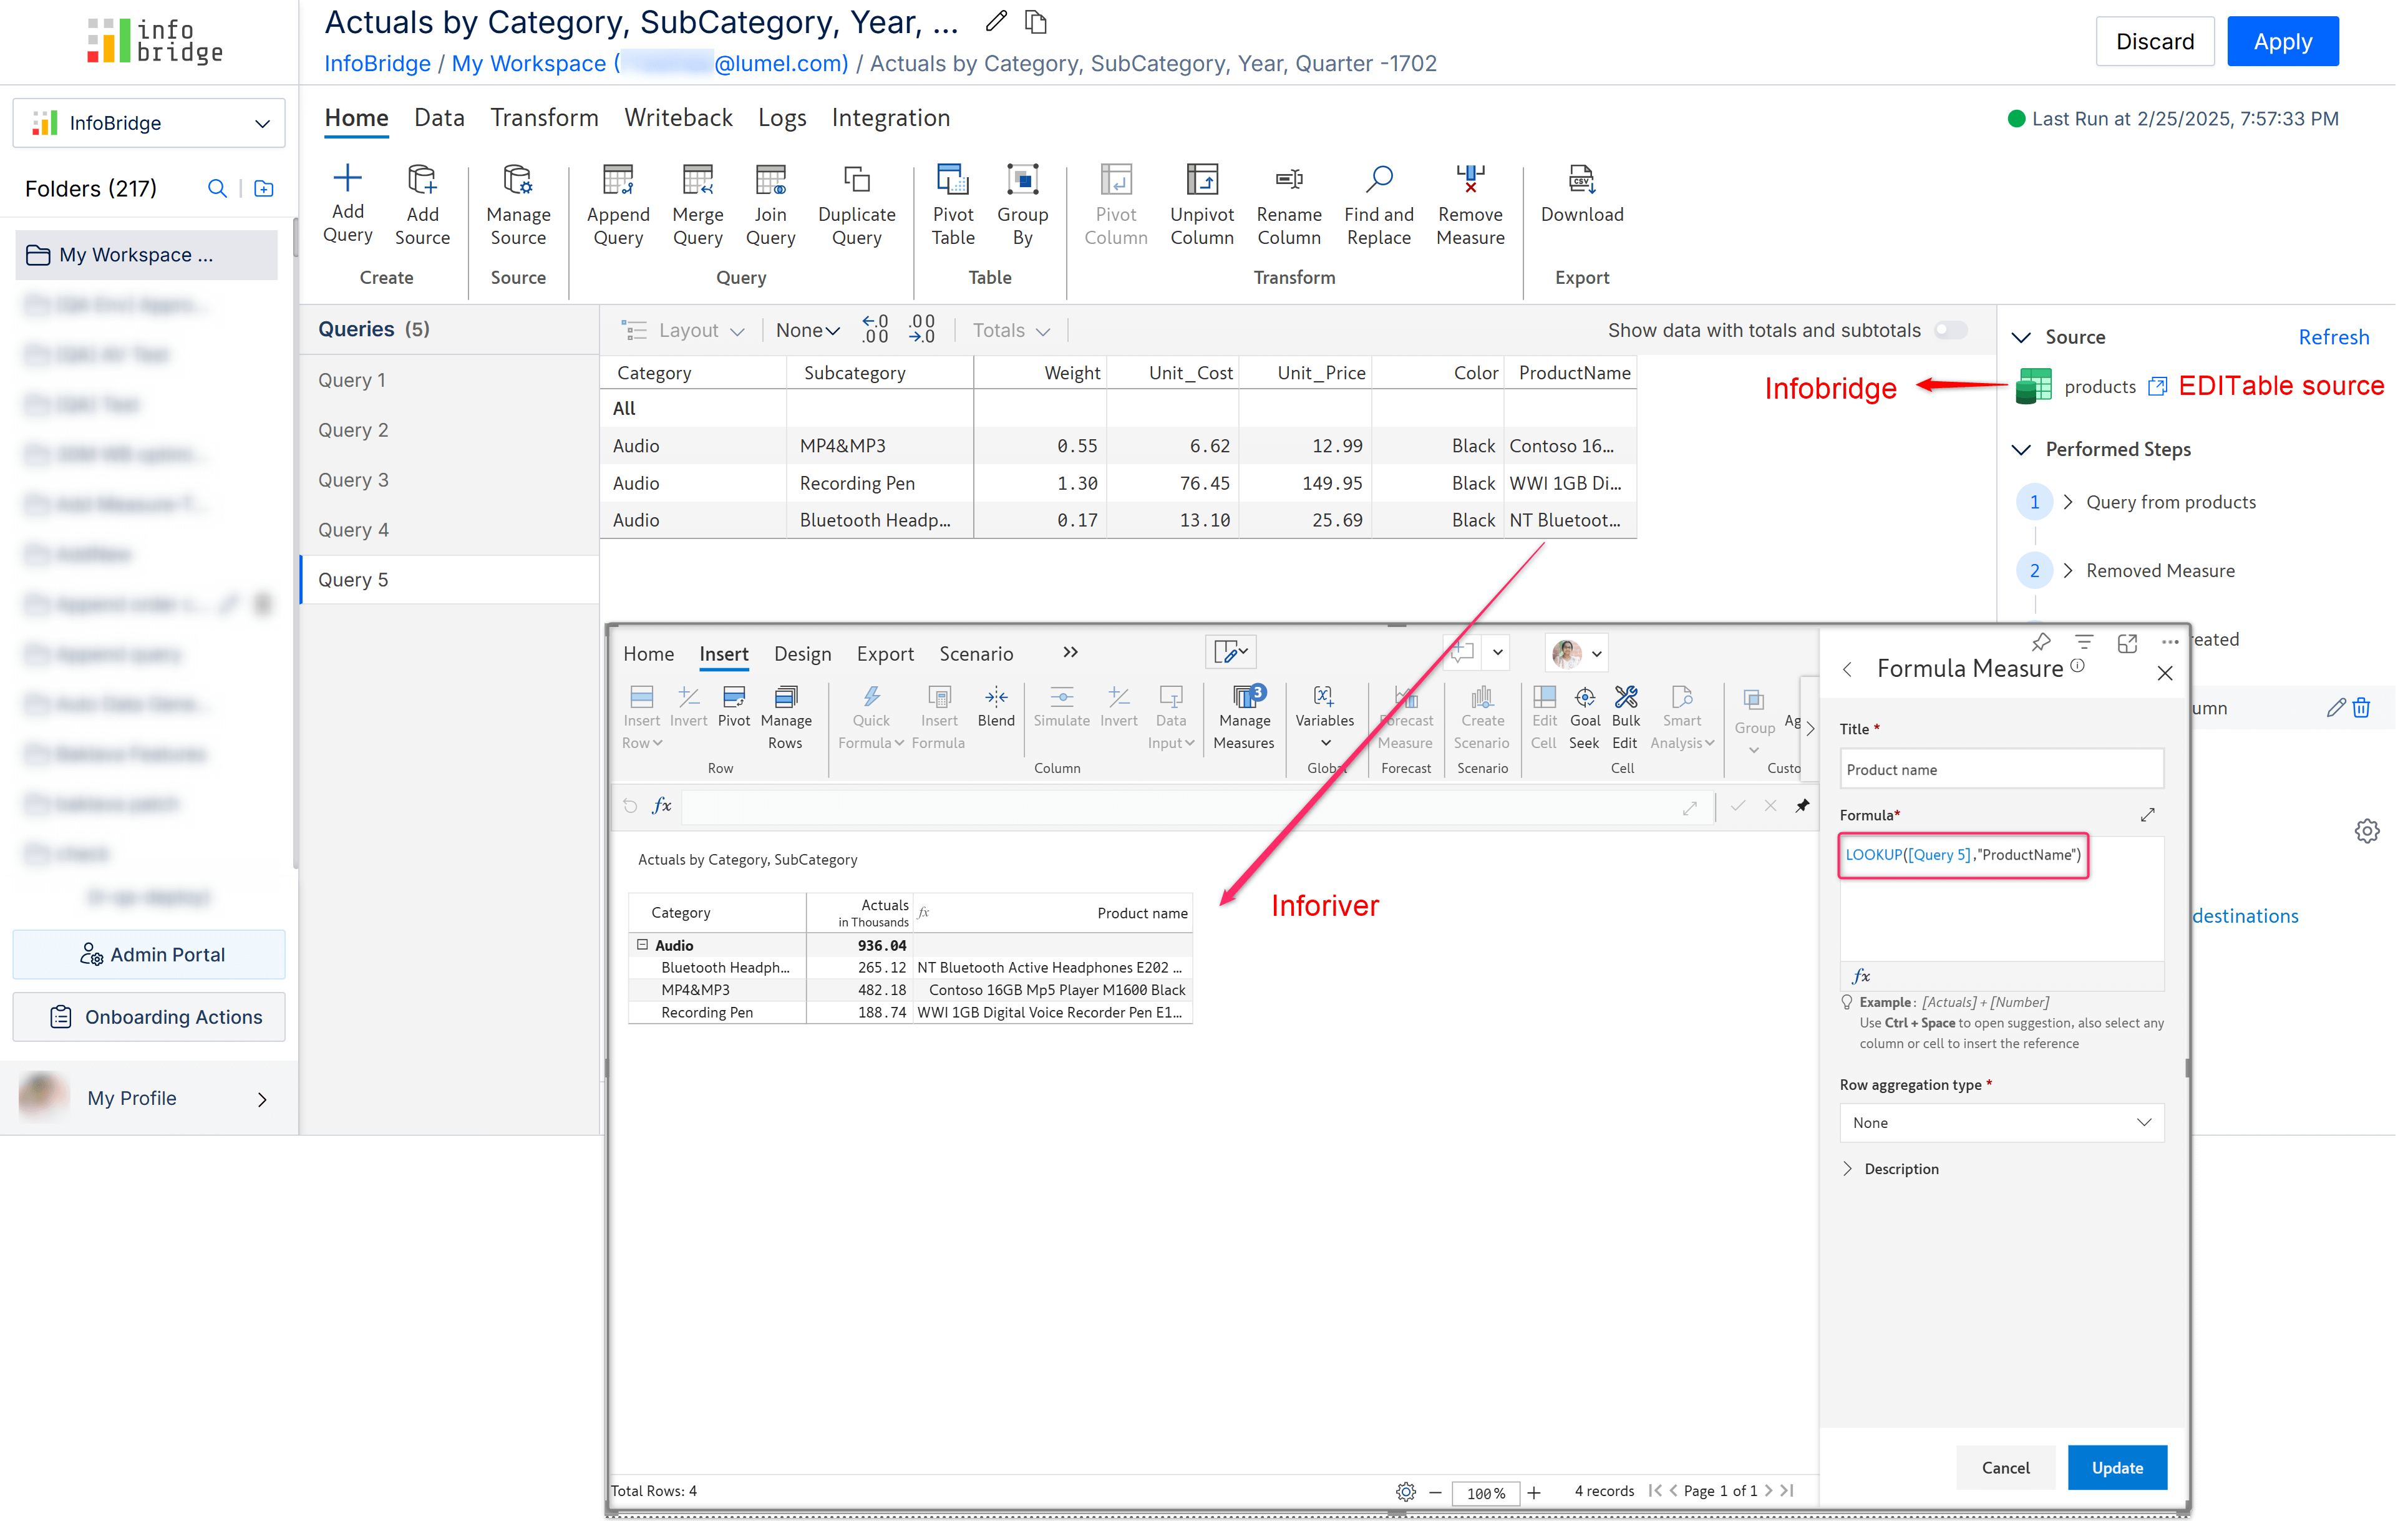
Infobridge can now fetch data from EDITable, enabling new possibilities for integrated and connected planning.
EDITable supports a wide range of cloud-based and on-premises databases, including Fabric Warehouse, Fabric SQL, Azure SQL, Snowflake, Amazon Redshift, BigQuery, Databricks, and PostgreSQL. The data tables from these destinations can now be imported into Infobridge via EDITable for real-time, connected planning.
For example, in the image below, we have integrated data from EDITable into a bridge. This data can be accessed live from an Inforiver report using the ‘LOOKUP’ function.
This way, you can seamlessly connect to multiple data sources from your Inforiver report.
No more distracting notifications and pauses during the auto-writeback process. The auto-writeback process is now seamless, with the event notifications displayed at the bottom of the visual.
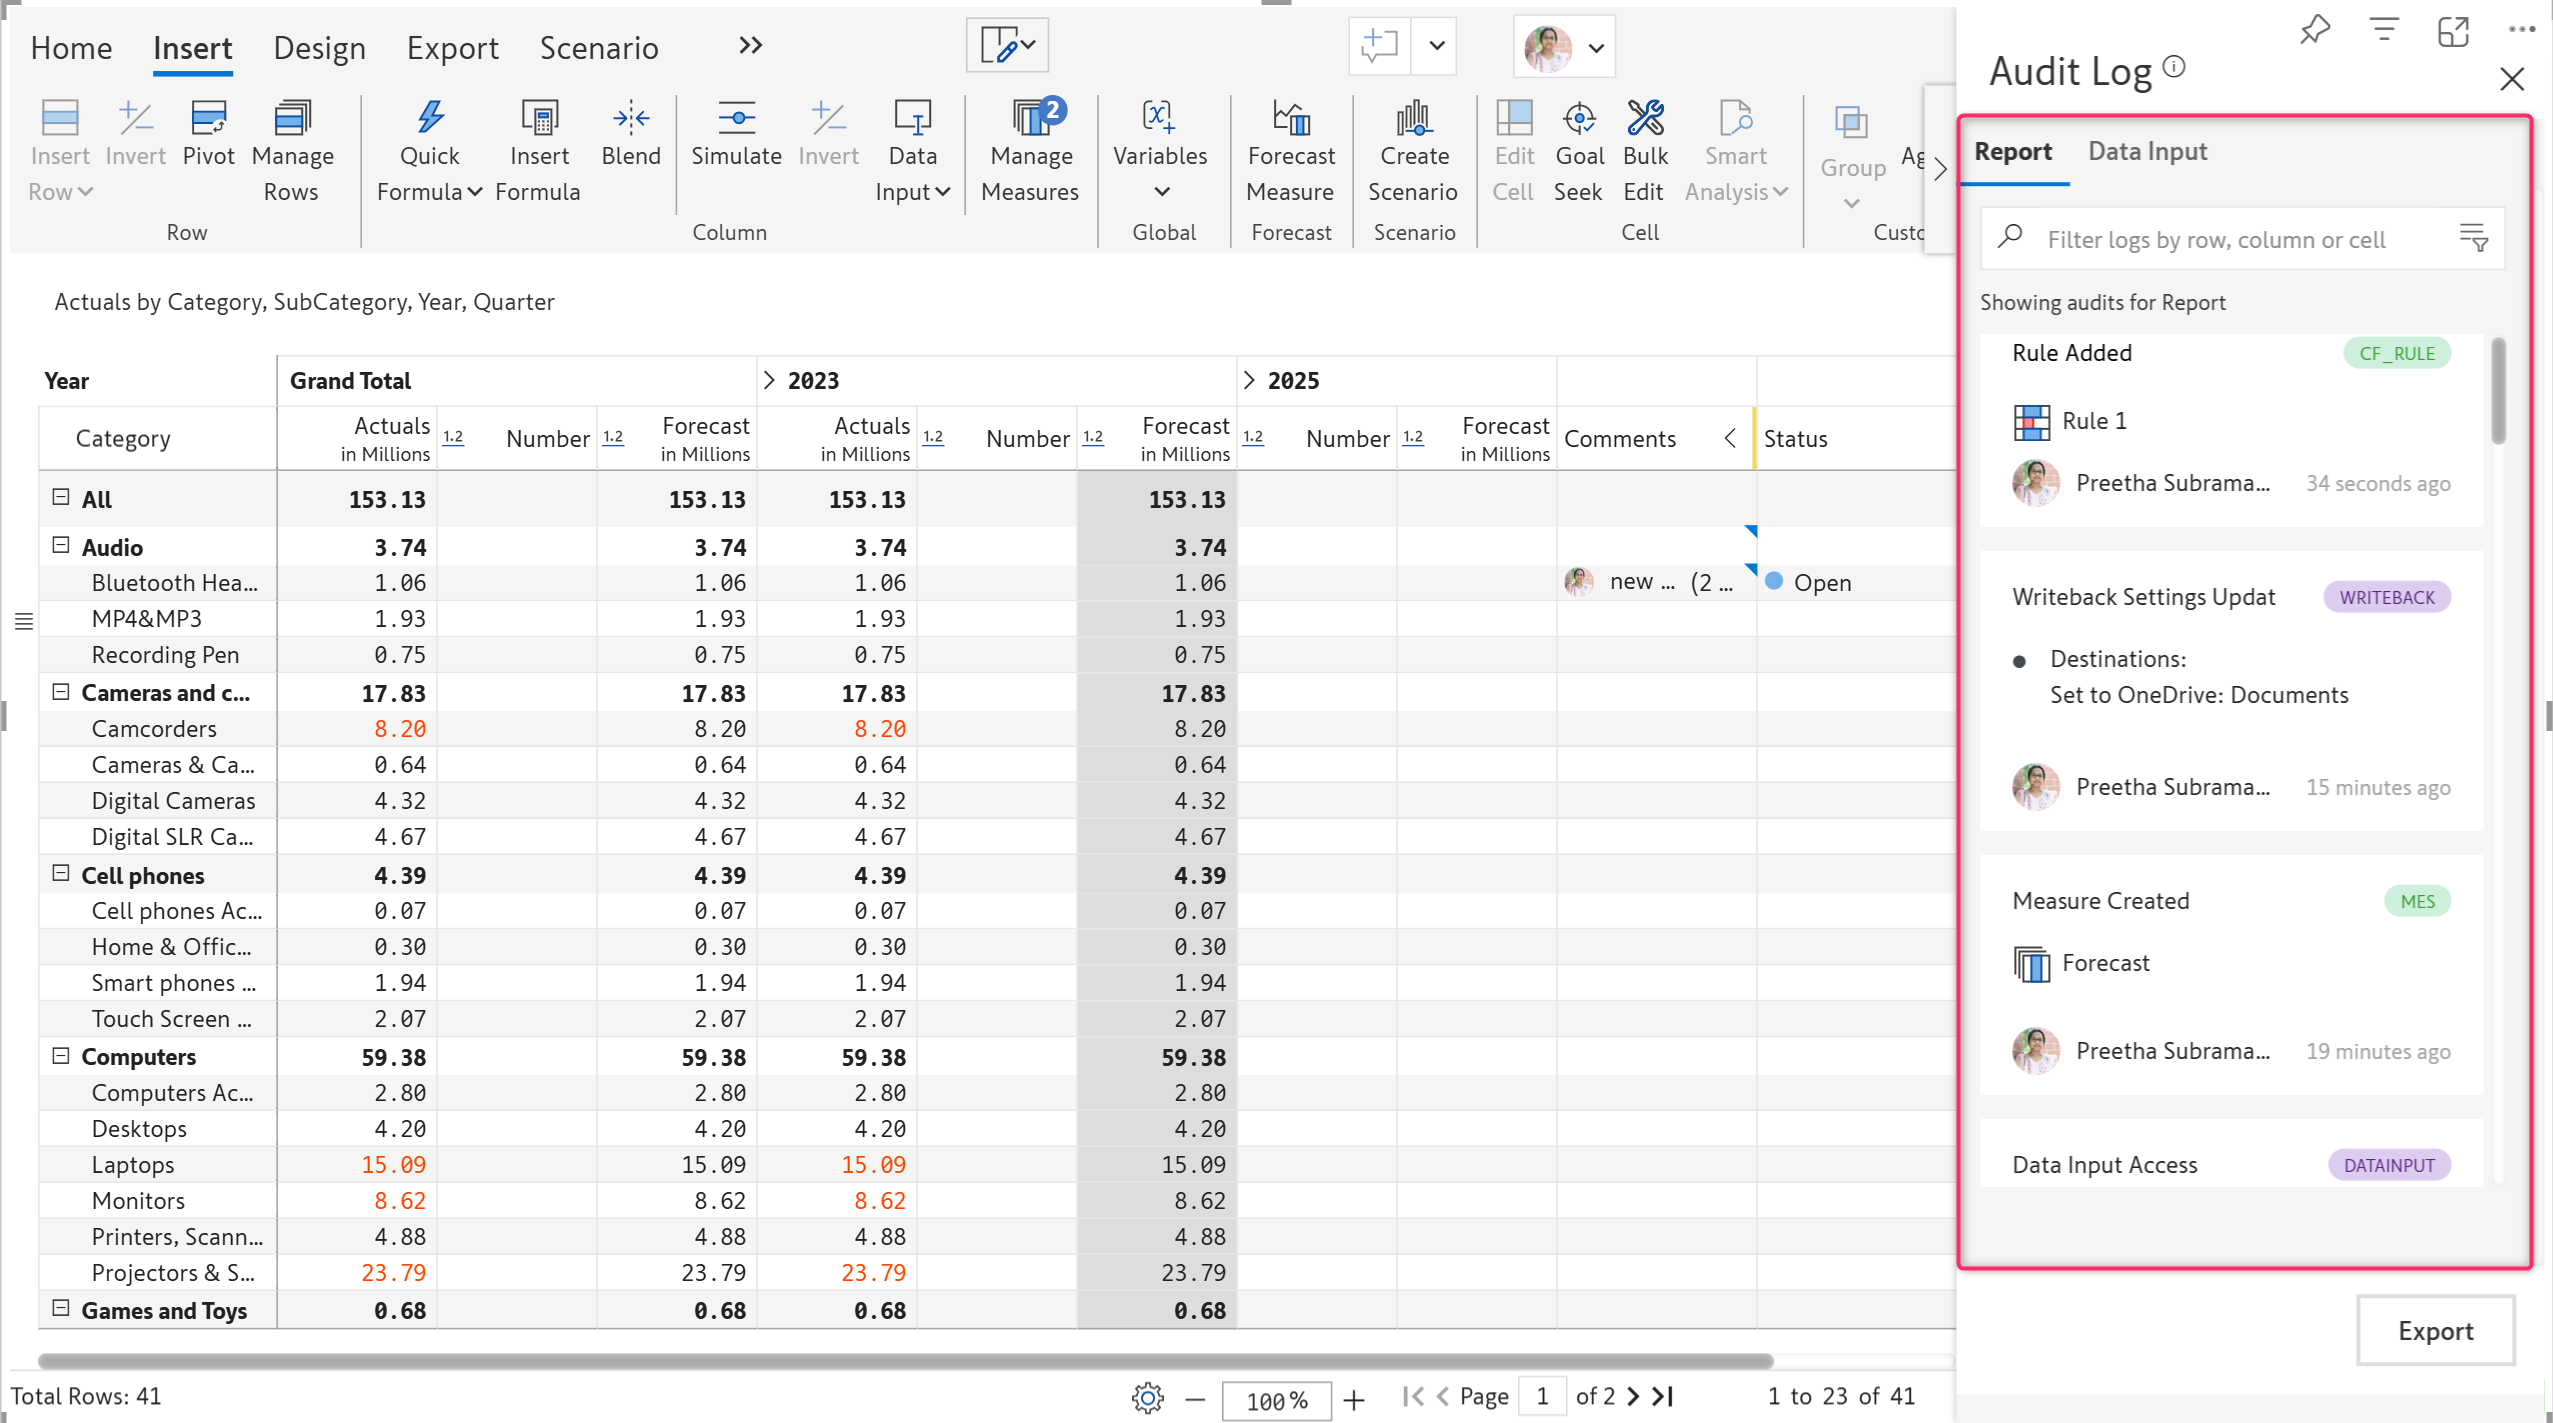
The audit log now displays a complete and comprehensive overview of all changes made to the report. This includes changes to data input measures, forecast measures, scenarios, snapshots, writeback settings, comments settings, conditional formatting, and more.
You can filter the logs by type, date range, the user who made the changes, and logs that include comments.
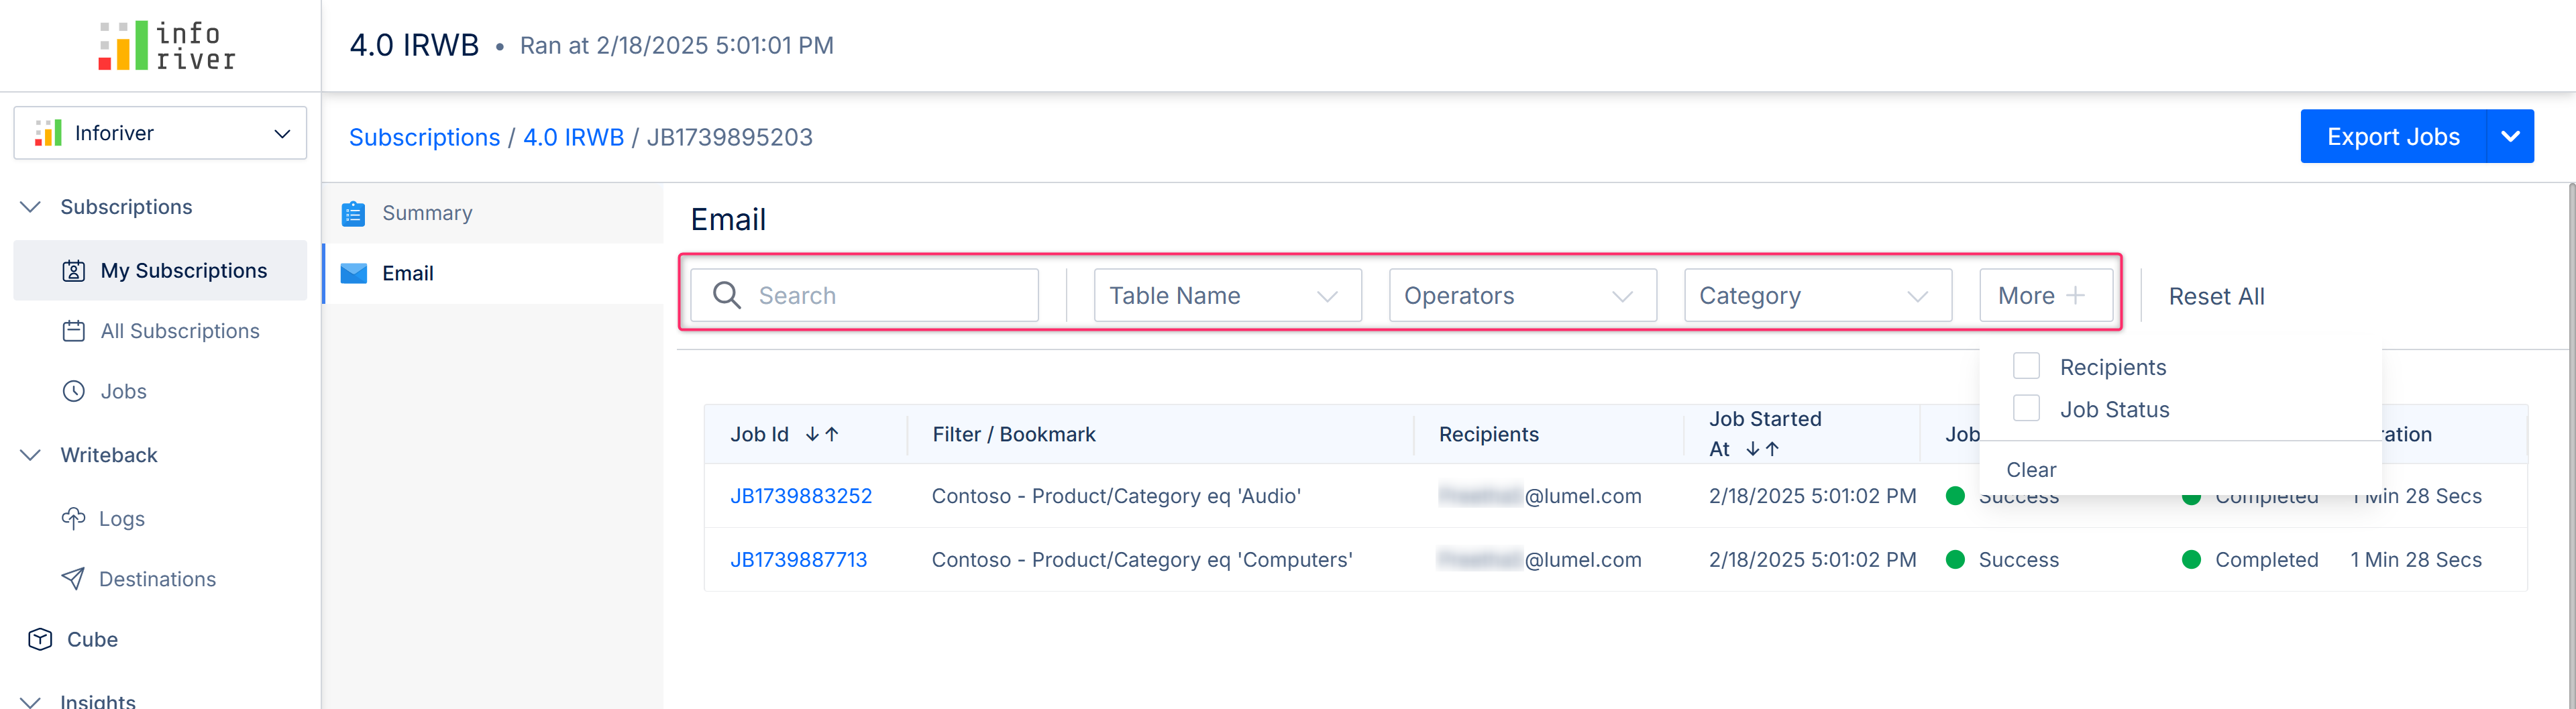
Search and filter options have been added to the scheduler summary, allowing users to select child jobs based on table name, category, sub-category, job status, and recipients for email destinations.
To learn more about the latest from Inforiver and why we are garnering recognition from industry experts, check out our newest brochure.
Inforiver and all our planning and analytics products continue to be updated to provide a diverse range of users with optimal performance. With continual improvements and innovations planned, we welcome your feedback.
Visit the Inforiver Community to share your ideas, vote on others’ submissions, and interact with other users.
If you’re ready to level up your planning, reporting, and analytics, try it for free today.

Inforiver helps enterprises consolidate planning, reporting & analytics on a single platform (Power BI). The no-code, self-service award-winning platform has been recognized as the industry’s best and is adopted by many Fortune 100 firms.
Inforiver is a product of Lumel, the #1 Power BI AppSource Partner. The firm serves over 3,000 customers worldwide through its portfolio of products offered under the brands Inforiver, EDITable, ValQ, and xViz.