Upcoming webinar on 'Inforiver Charts : The fastest way to deliver stories in Power BI', Aug 29th , Monday, 10.30 AM CST. Register Now
Upcoming webinar on 'Inforiver Charts : The fastest way to deliver stories in Power BI', Aug 29th , Monday, 10.30 AM CST. Register Now
Are your Power BI reports struggling with complex data navigation? Do users get lost drilling down through endless levels? Traditional Power BI filters often fall short, making granular data exploration a frustrating experience. This is where advanced Power BI hierarchy filters become essential.
In this comprehensive guide, we'll delve into the process of setting up and optimizing hierarchy filters in Power BI, and crucially, reveal how Inforiver Super Filter (and it’s free forever!) enhances this process with unparalleled flexibility, dynamic logic, and enhanced control, making it the ultimate slicer for Power BI.
Inforiver Super Filter offers a modern take on hierarchy filtering in Power BI, designed to simplify and streamline the user experience. It brings flexibility, clarity, and enhanced control to hierarchical data navigation. In the sections that follow, we’ll explore how Super Filter elevates the filtering experience with features that go far beyond what's available in native slicers.

Figure 1: Hierarchy Filter in Inforiver Super Filter
Feature | Native Power BI Slicers | Inforiver Super Filter |
|---|---|---|
| Combine Hierarchy with Measure Filters | ❌ Not supported in a single visual | ✅ Filter hierarchy with numeric slider (e.g., Sales, Profit) |
| Advanced Search | ❌ Limited to visible level; no wildcard support | ✅ Search all hierarchy levels; supports wildcard and operators |
| Wildcard Search | ❌ Not supported | ✅ Wildcard search with operators |
| Conditional Formatting | ❌ Not available | ✅ Format based on measure values (e.g., low margins) |
| Sorting & Ranking | ❌ Requires manual DAX or external logic | ✅ Built-in Top N, Bottom-N, sort by measure/alphabet |
| Variance Display with Measures | ❌ Requires additional visuals or DAX | ✅ In-built variance calculation with icon indicators |
| Display Measure Detail | ❌ Not supported | ✅ Measures like Sales, Profit shown next to each item |
| Parent-Child Selection Control | ❌ Selecting parent selects all children | ✅ Leaf Node Single Select supported |
| Rich Formatting Options | ❌ Very limited formatting | ✅ Customize fonts, colors, icons, row styling, indentation |
| View Types | ❌ Only default list or dropdown | ✅ Checkbox, Radio Button, and List for hierarchy levels |
Create a Power BI hierarchy filter in minutes! To unlock the full power of hierarchy-based filtering with Inforiver Super Filter, simply:

Figure 2: Disabling the Facet Filter to enable the Hierarchy Filter

Figure 3: Measure Data added to the Other data fields
Once configured, Super Filter turns into a powerful hierarchy navigator and analyzer with the ability to drill down, format, filter by values, and much more. For more information on the Hierarchy Filter, please refer to the technical documentation.
To enable hierarchy-based filtering:

Figure 1: Disabling Facet Filter to enable Hierarchy Filter
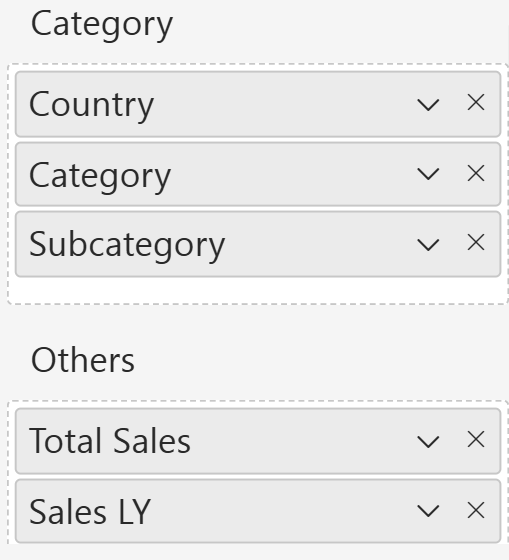
Figure 2: Measure Data added to the Other data fields
Once configured, Super Filter turns into a powerful hierarchy navigator and analyzer with the ability to drill down, format, filter by values, and much more. For more information of Hierarchy Filter Please refer to the Official Documentation.
Super Filter supports multiple visual styles for hierarchy filtering—checkboxes for multi-select, radio buttons for single-select, and compact lists for clean designs—configurable per use case.
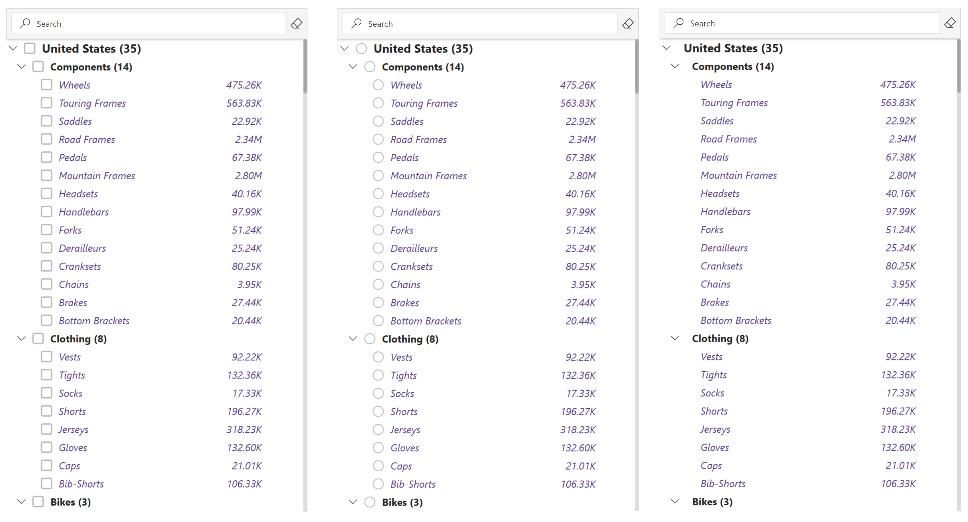
Figure 4: Checkbox, Radio and List view types in hierarchy filter
The search bar in Super Filter supports multilevel search, meaning it searches across all hierarchy levels such as Region, Country, and City. When a user types a value, it displays matching items regardless of their position in the hierarchy. Additionally, it supports wildcard characters (e.g., *, ?) and operator-based search (e.g., >50000, <10%) when used alongside measures—making search more dynamic and intelligent.
GIF 1: Multilevel search in hierarchy filter using the search bar in toolbar
When you place a measure into the 'Others' section, it appears as a detail next to each hierarchy item, showing KPIs like Sales, Profit, or Quantity. This provides additional information to the users to make the selections.
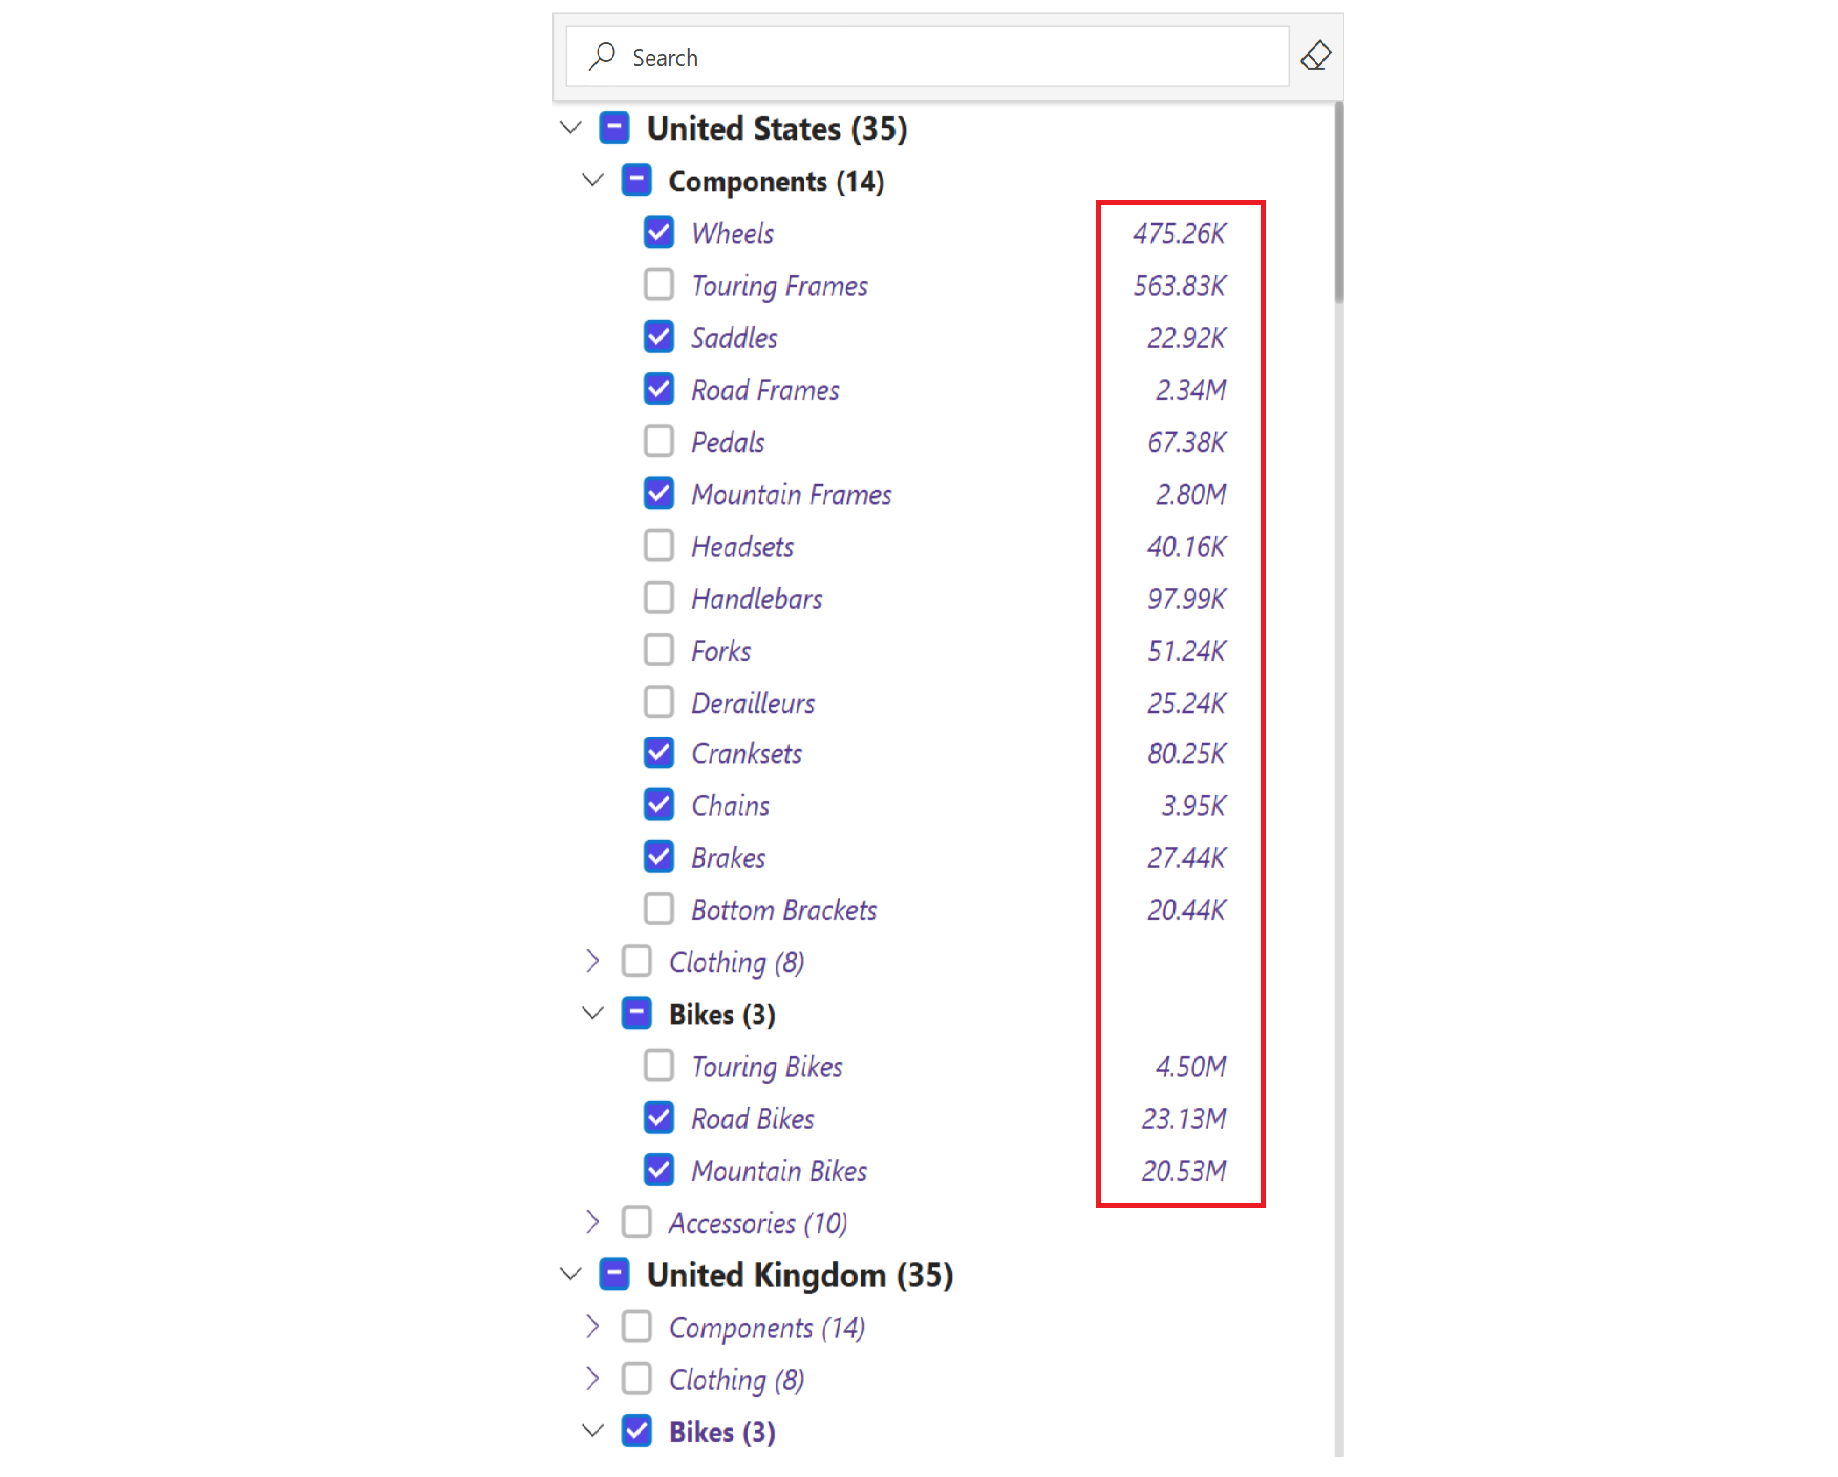
Figure 5: Sales measure shown as details for each leaf level item
When two measures are added to the “Other” field, variance mode can be enabled to calculate and display the difference between the selected measures, along with positive/negative indicators. This functionality is natively available in Super Filter, requiring no extra visuals or DAX.
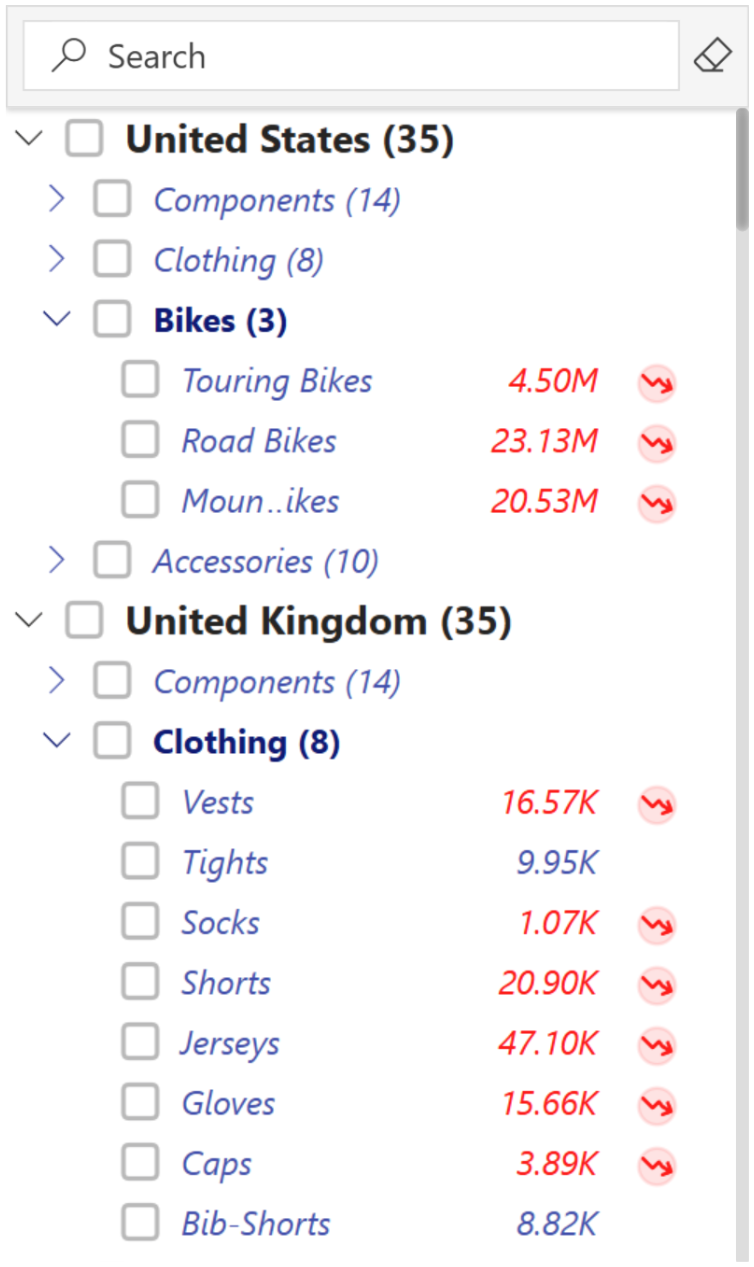
Figure 6: Variance highlighted using icon-based on the measure values added.
Conditional formatting lets you visually distinguish items in the hierarchy based on measure logic, such as applying colors or styles to highlight specific conditions. These rules can be saved as presets, making it easy to filter and focus on items that meet defined business criteria without manually scanning the list.
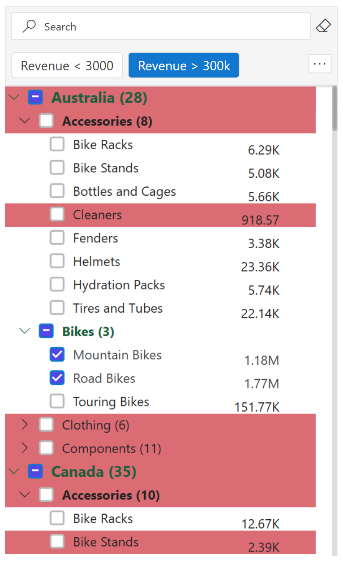
Figure 7: Sales > 100k is highlighted by a green background color using conditional formatting.
Super Filter also offers dynamic Top-N or Bottom-N filtering directly within the visual, allowing users to rank items based on a selected measure. It also enables sorting either alphabetically or by measure values across hierarchy levels. This eliminates the need for DAX-based workarounds and enhances user interactivity.
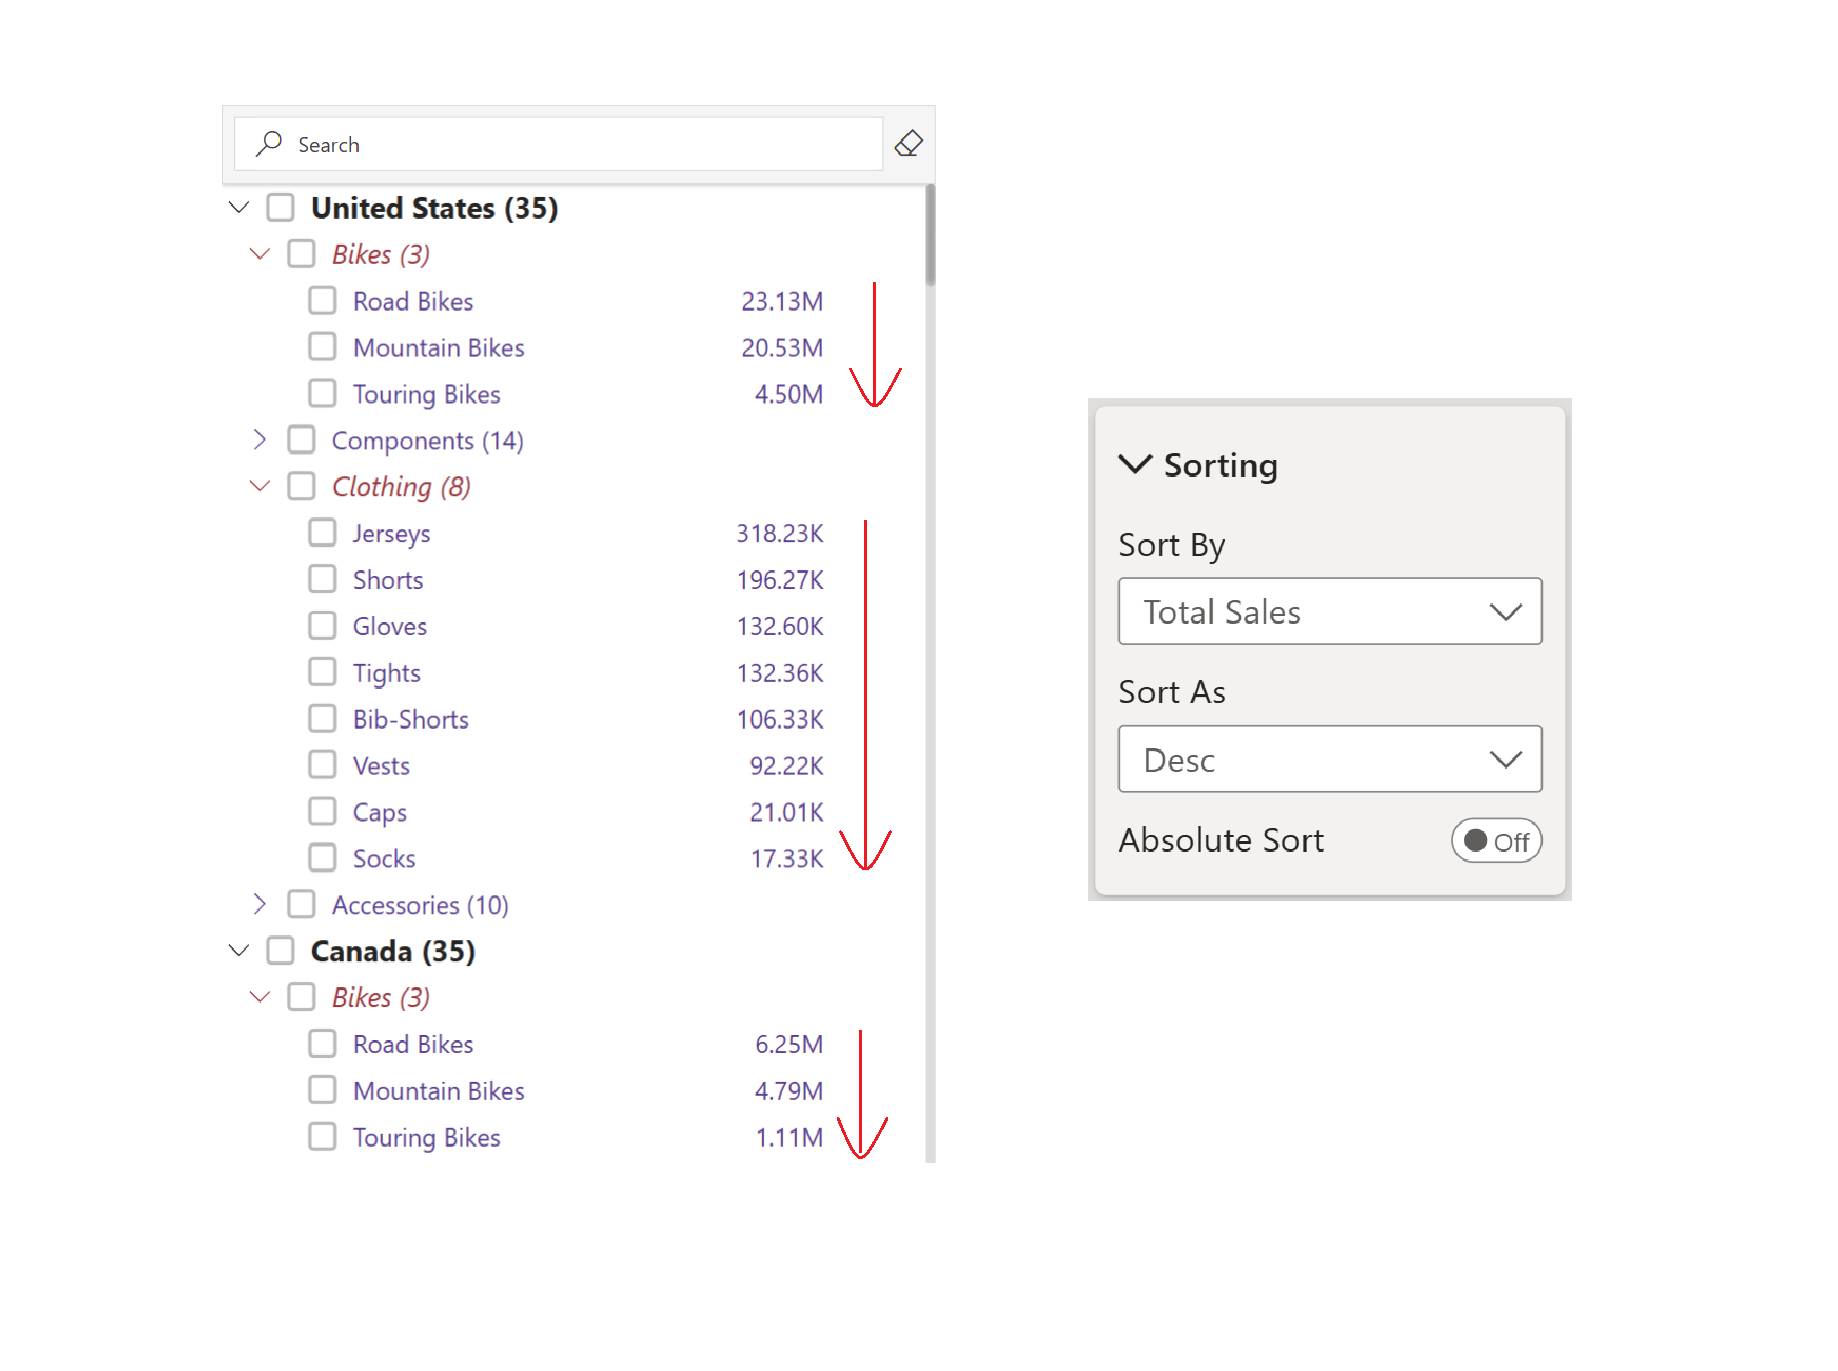
Figure 8a: Hierarchy filter Sorted in descending order based on Sales measure.
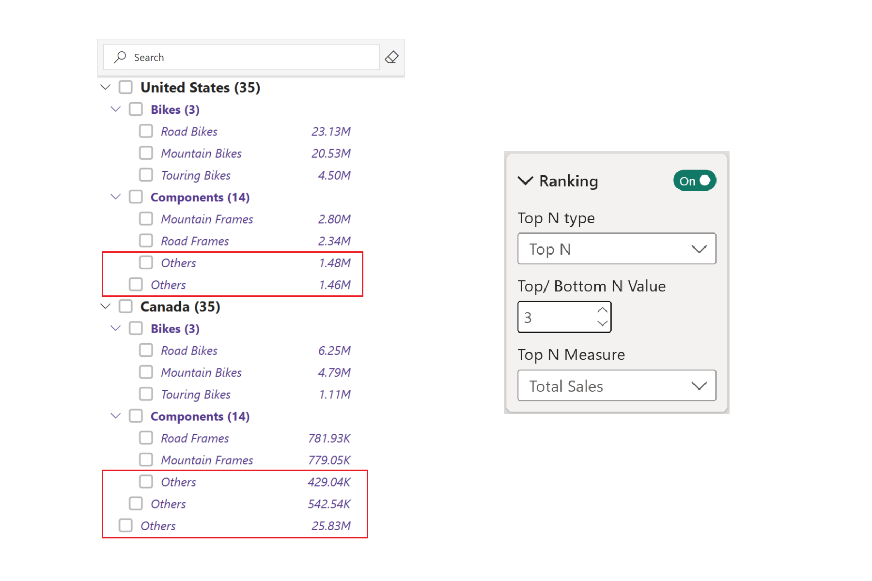
Figure 8b: Hierarchy Filter ranked by Top 3 based on Sales measure
Normally, selecting a parent node selects all children—but with Leaf Node Single Select, only the first child gets picked, giving more precise control.
GIF 2: Leaf node single select customisation in Hierarchy Filter
Inforiver Super Filter allows you to layer a numeric measure filter alongside a category-based hierarchy. This lets users interactively filter hierarchical items based on a selected value range of a DAX Measure (e.g., Sales, Profit).
Here is a GIF showcasing Dynamic Measure-based filtering for a Country -> Category -> Products hierarchy:
GIF 3: Dynamic filtering using measure slider based on sales measure
From expand/collapse icons to font styling, indentation, alternate row coloring, and utility icons—Super Filter offers full visual customization of the hierarchy tree.
The Inforiver Super Filter transcends the limitations of a standard Power BI slicer. It's a comprehensive solution for advanced hierarchical filtering in Power BI, empowering users with intuitive drilldown filter Power BI capabilities, multi-level search, dynamic measure-based filtering, and stunning conditional formatting. For any team looking to streamline complex Power BI filter options and drive faster, more informed decisions, Inforiver Super Filter is the essential upgrade (and it’s free forever!). Don't just filter data; truly explore it. Try it on Microsoft AppSource today and transform your Power BI data exploration experience!

Inforiver helps enterprises consolidate planning, reporting & analytics on a single platform (Power BI). The no-code, self-service award-winning platform has been recognized as the industry’s best and is adopted by many Fortune 100 firms.
Inforiver is a product of Lumel, the #1 Power BI AppSource Partner. The firm serves over 3,000 customers worldwide through its portfolio of products offered under the brands Inforiver, EDITable, ValQ, and xViz.