Upcoming webinar on 'Inforiver Charts : The fastest way to deliver stories in Power BI', Aug 29th , Monday, 10.30 AM CST. Register Now
Upcoming webinar on 'Inforiver Charts : The fastest way to deliver stories in Power BI', Aug 29th , Monday, 10.30 AM CST. Register Now
Making your Power BI report titles dynamically update based on selected filters can be a struggle. While Power BI can support dynamic titles through DAX measures, it often falls short when it comes to rich formatting, multi-selection handling, and ease of use. Users typically rely on complex DAX formulas and workarounds, impacting report usability and performance.
Inforiver solves these challenges with a no-code approach, offering seamless, context-aware dynamic titles across its suite of visuals that includes Inforiver Reporting Matrix, Enterprise Matrix, Analytics Plus, and Super Filter.
This blog post explores how Inforiver eliminates the limitations of Power BI’s native dynamic title functionality and provides a simple, click-based method to enhance report readability and interactivity.
Filter context in Power BI determines how data is filtered when evaluating a DAX expression. Filters applied via slicers, visual filters, and table selections shape the dataset used in calculations. While Power BI does allow dynamic titles based on filter context, it requires DAX measures and conditional formatting to function properly.
Dynamic titles in Power BI can be achieved primarily using DAX measures that adjust based on user-selected filters. The SELECTEDVALUE function is commonly used to retrieve the chosen filter values, ensuring that the title reflects the applied selections. A fallback default (e.g., "All Years") is displayed if multiple values are selected. Once created, this measure can be applied to a visual’s title using field-based formatting (fx) in the Format Pane. This approach ensures that report titles remain context-aware and dynamically update based on filter interactions.
| Feature | Power BI (DAX) | Inforiver (No-Code) |
|---|---|---|
| Multiple Filters selection | ❌ Requires CONCATENATEX | ✅ Fully Supported and no-code based |
| Formatting Options | ❌ No (Plain text only) | ✅ Yes (Bold, Colors, Line Breaks) |
| Performance Impact | ⚠️ Can slow down large reports | ✅ Optimized with no DAX Overhead |
| Ease of Use | ❌ Requires DAX expertise | ✅ Simple Click-Based Setup |
| Works in All Visuals | ❌ Limited support | ✅ Works in Matrix, Tables and Charts |
These constraints can make it difficult to create fully dynamic and visually appealing reports.
The Inforiver suite of visuals enables fully customizable, filter-aware titles using a simple, click-based approach. Unlike Power BI’s native functionality, Inforiver allows Rich Text Formatting (bold, color, line breaks), Automatic Updates based on applied filters, Context-Aware Headers and Labels and without creating any complex DAX measures.
The dashboard below showcases customer analysis using the Inforiver suite of visuals, including Matrix, Analytics+, and Super Filter. These visuals dynamically update based on filter context, ensuring that report headers and column headers in the Matrix reflect applied filters. Additionally, Analytics+ provides context-aware annotations, offering deeper insights into customer trends and behaviors.
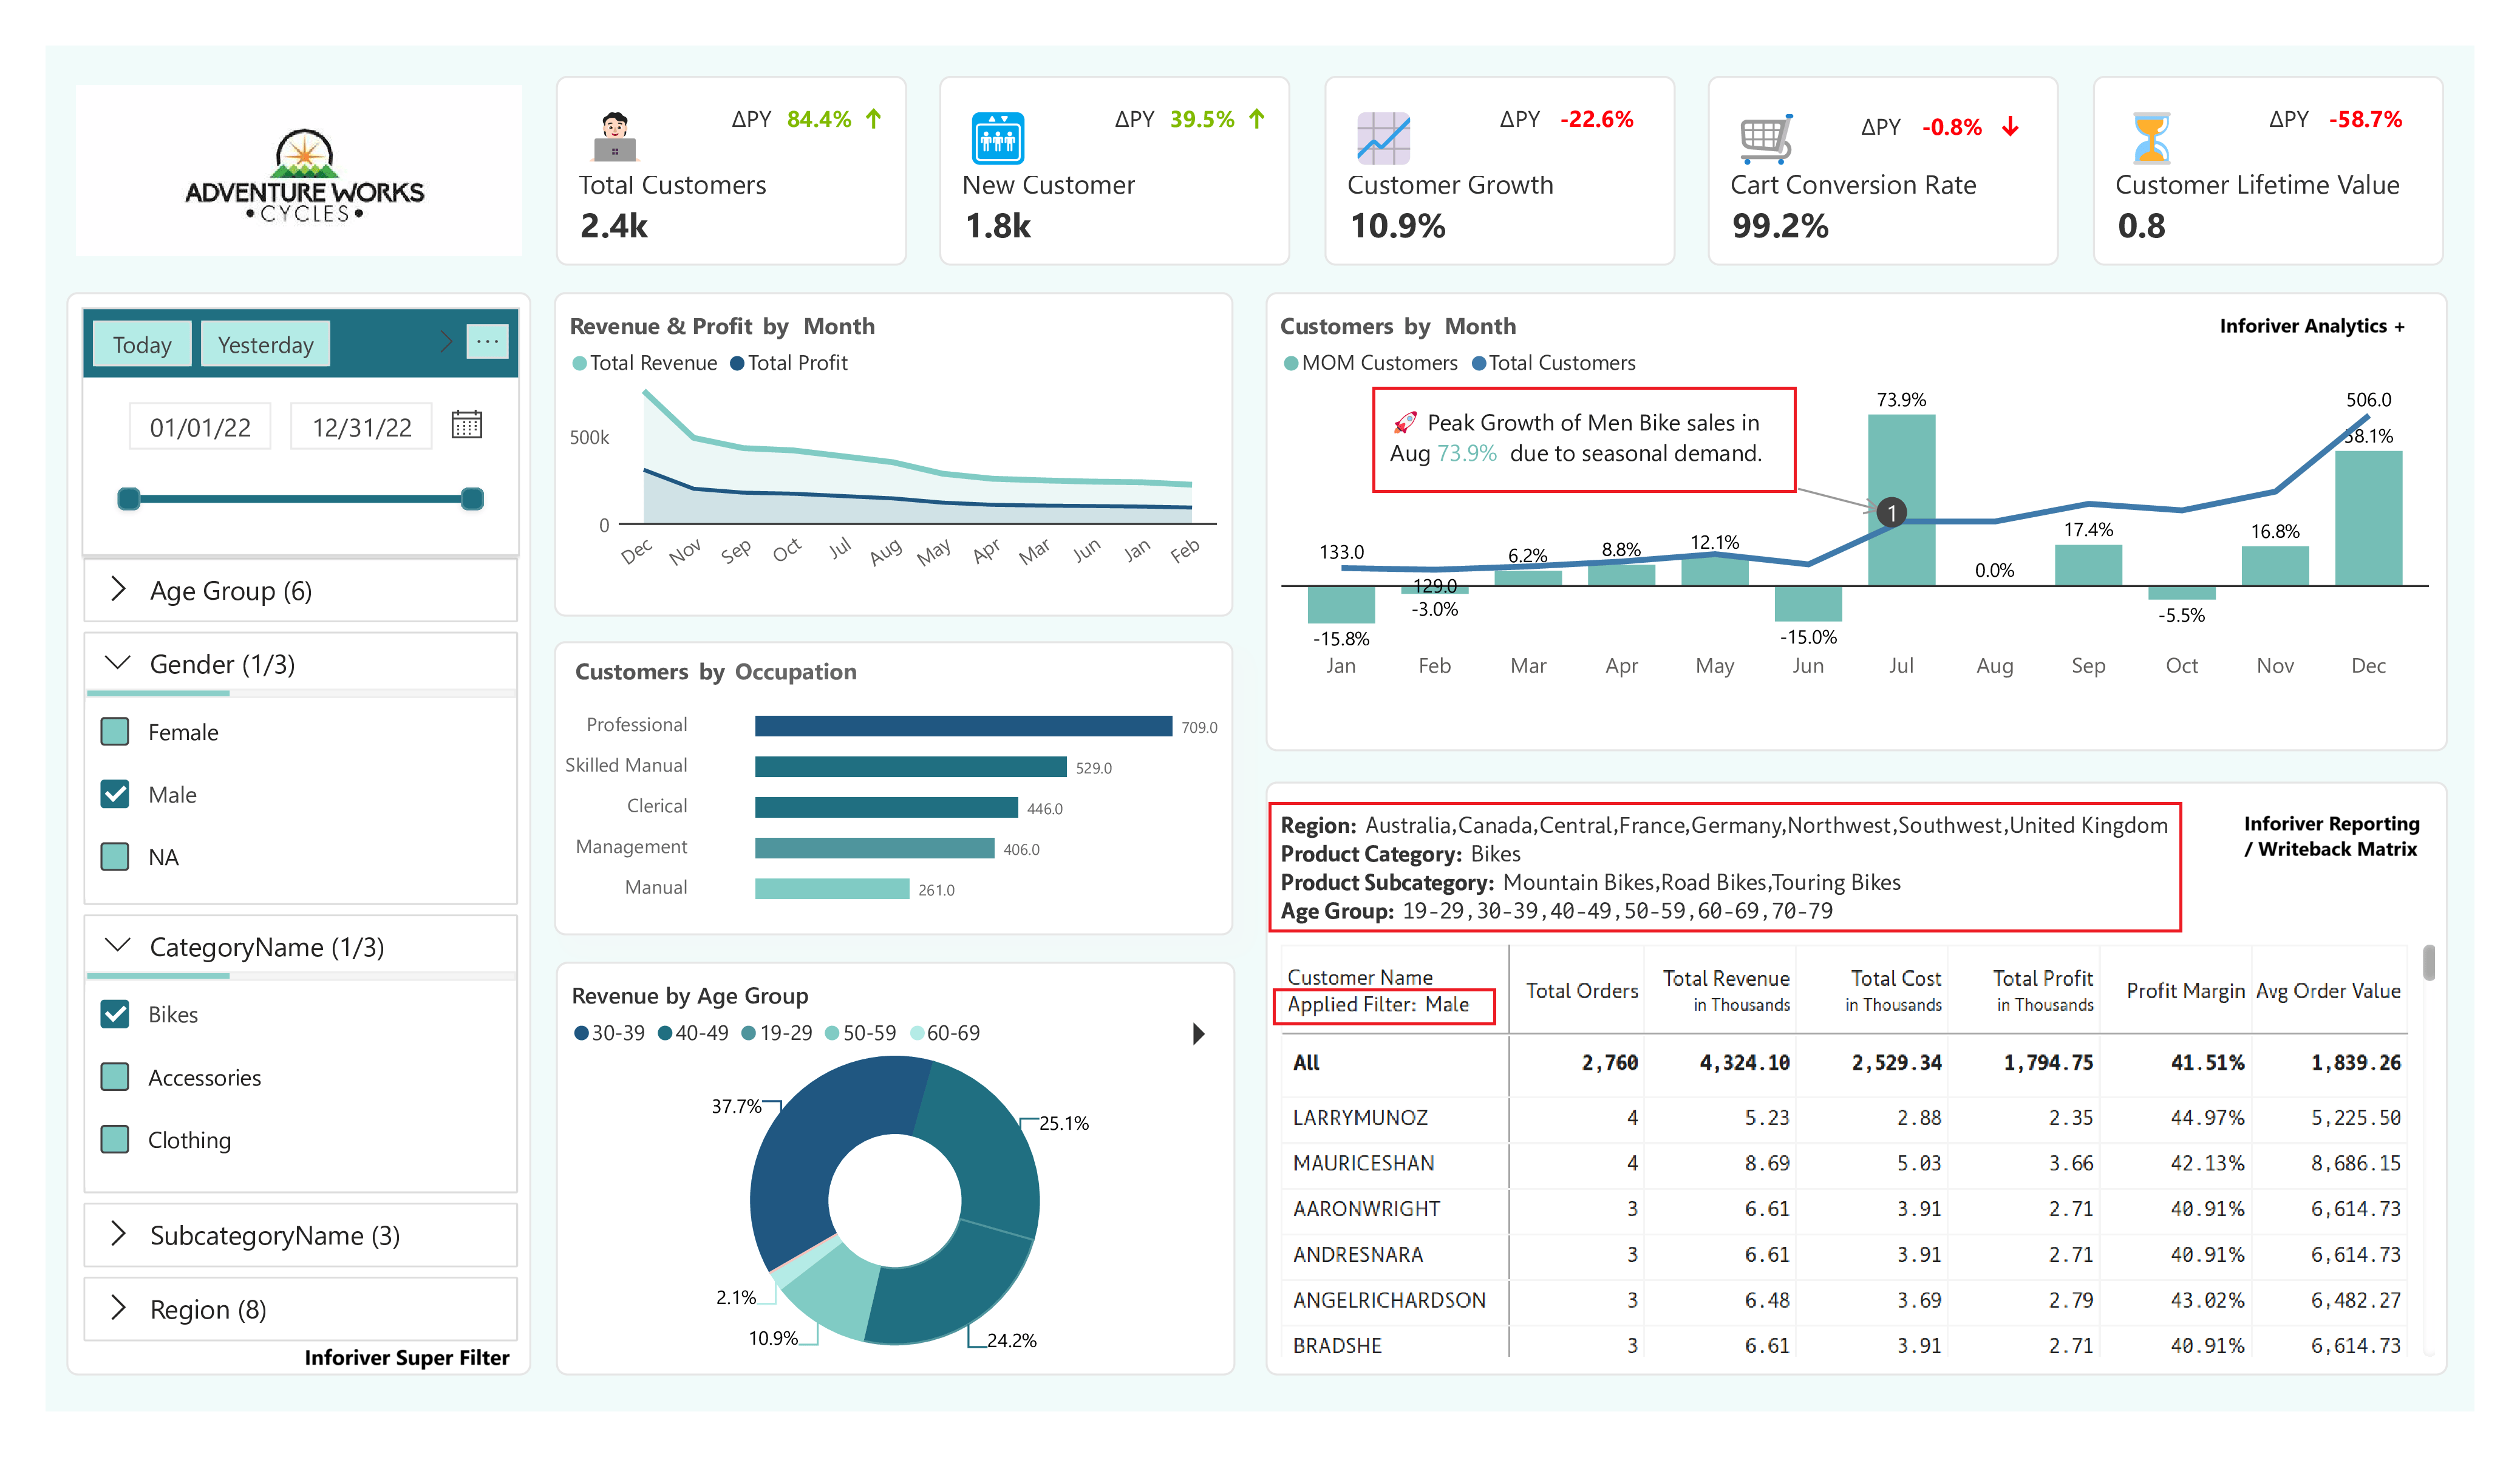
Image 1: In the above image Headers update dynamically in Inforiver Matrix and annotations update dynamically in Inforiver Analytics+ based on the filter context.
Once you've set up your dashboard, you can enhance its interactivity by enabling context-aware filter settings. Here’s how:
Activate context settings in Super Filter through Display Settings in the Format visual pane.
In Inforiver Matrix or Analytics+, select Filter Context, choose the visual name in the context measure, enable context awareness, and save.
Add dynamic titles using Preset or create custom headers with filter context in Inforiver Matrix or Analytics+ via Canvas Settings.
Utilize filter context-based features like commenting, conditional formatting, writeback, data inputs, locked cells, and Infobridge-connected planning in Inforiver reporting Matrix and Writeback Matrix.
For more details, refer to: Context Awareness in Inforiver Reporting & Writeback Matrix & Context Awareness in Analytics+
GIF 1: Dynamic Header update in Inforiver Reporting Matrix and context aware annotations in Inforiver Analytics+
Inforiver’s suite of visuals Reporting Matrix, Writeback Matrix, Analytics Plus, and Super Filter offers a powerful alternative, enabling filter context aware and fully formatted dynamic titles without the need for extensive DAX workarounds. By leveraging Inforiver, users can enhance report readability, improve performance, and simplify title customization with an intuitive, click-based approach.
To learn more about the latest from Inforiver and why we are garnering recognition from industry experts, check out our newest brochure.
If you’re ready to level up your planning, reporting, and analytics, try it for free today.

Inforiver helps enterprises consolidate planning, reporting & analytics on a single platform (Power BI). The no-code, self-service award-winning platform has been recognized as the industry’s best and is adopted by many Fortune 100 firms.
Inforiver is a product of Lumel, the #1 Power BI AppSource Partner. The firm serves over 3,000 customers worldwide through its portfolio of products offered under the brands Inforiver, EDITable, ValQ, and xViz.