Inforiver

Upcoming webinar on 'Inforiver Charts : The fastest way to deliver stories in Power BI', Aug 29th , Monday, 10.30 AM CST.    Register Now
Storytelling Chart

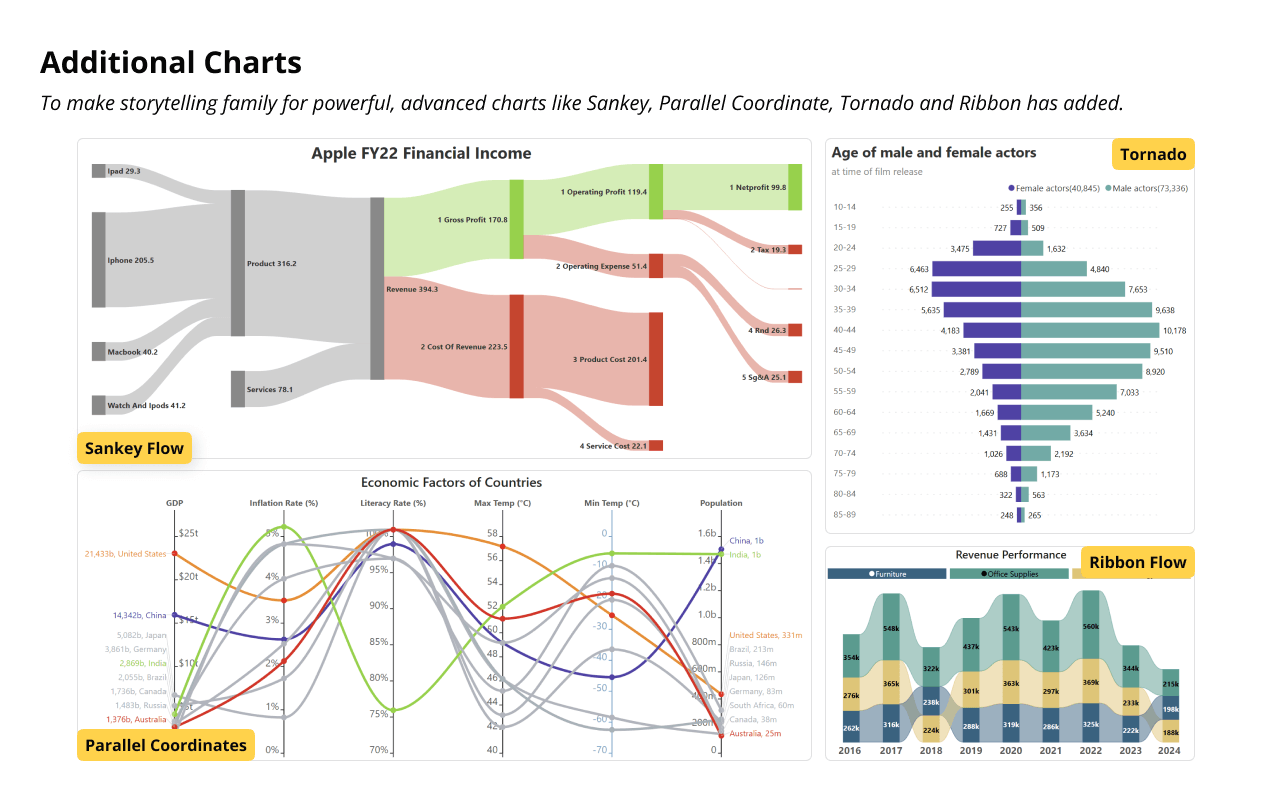
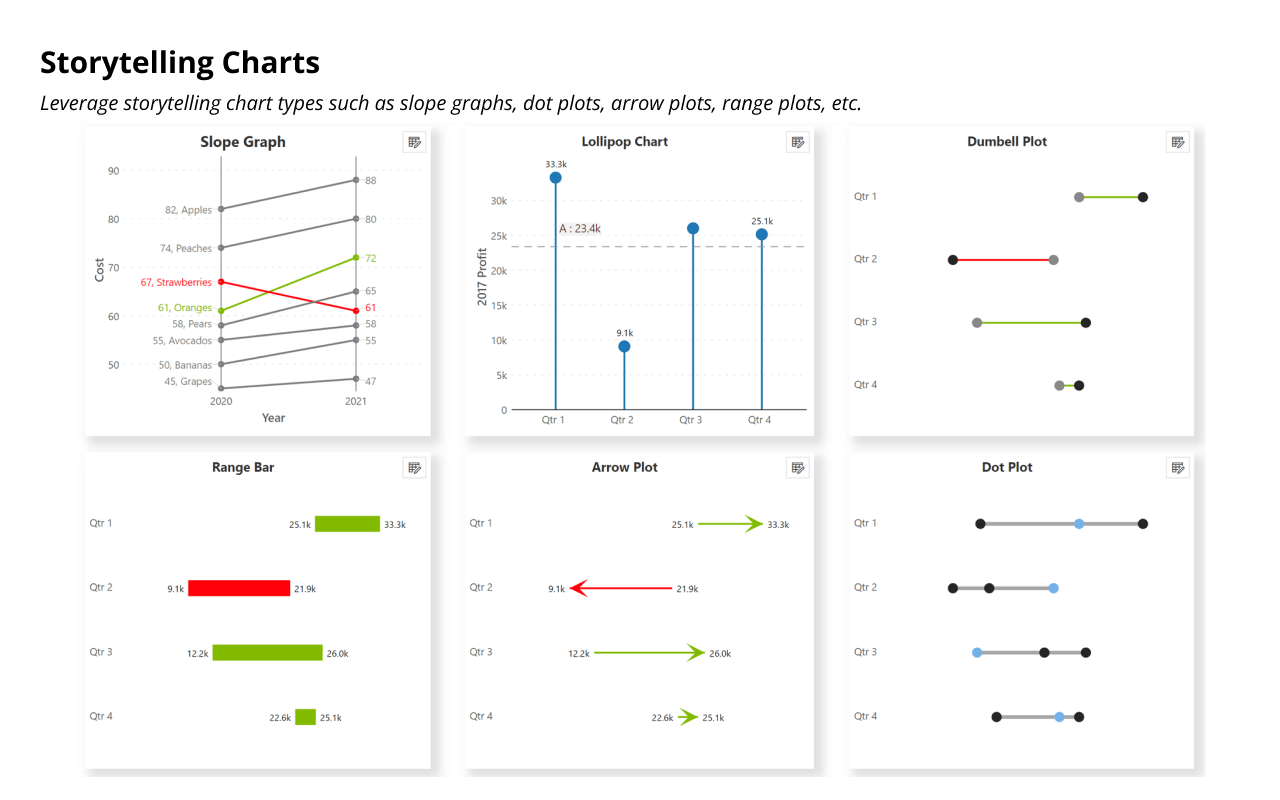
Inforiver Analytics+ Storytelling Chart is a powerful custom visual suite for Power BI, designed to help you create compelling, media-ready charts with ease. It includes a rich collection of over 15 chart types, such as dot plots, arrow plots, lollipop charts, range bars, ribbons, Sankey diagrams, slope charts, parallel coordinates, tornado charts, and more.

With advanced customization features like conditional formatting, trellis views, analytics tools, filter context, and annotations, ensuring you get the best insights from your data.

Learn more about what Inforiver Analytics+ Storytelling Suite can do.
Download PBIX
Dumbell Column/Bar
Dot Plot Column/Bar
Range Plot Column/Bar
Arrow Plot Column/Bar
Ribbon Chart
Slope Graph
Parallel Coordinates
Lollipop Plot
Tornado Chart
Sankey Flow
iframe preview
View interactive content

Key features

Wide range of chart types

Wide Range of Chart Types

Access 15+ storytelling charts tailored for data visualization.
Orientation

Orientation

Display charts in horizontal or vertical layouts for better readability.
Conditional formatting

Conditional Formatting

Apply different colors to highlight data based on business rules.
Advanced trellis support

Advanced Trellis Support

Create multi-level small multiples with up to three axes.
Built-in Analytics statistics

Built-in Analytics & Statistics

Provide insights with deviation bar, error bars, reference lines and bands.
Data label customization

Data Label Customization

Customize data labels with multiple styling options.
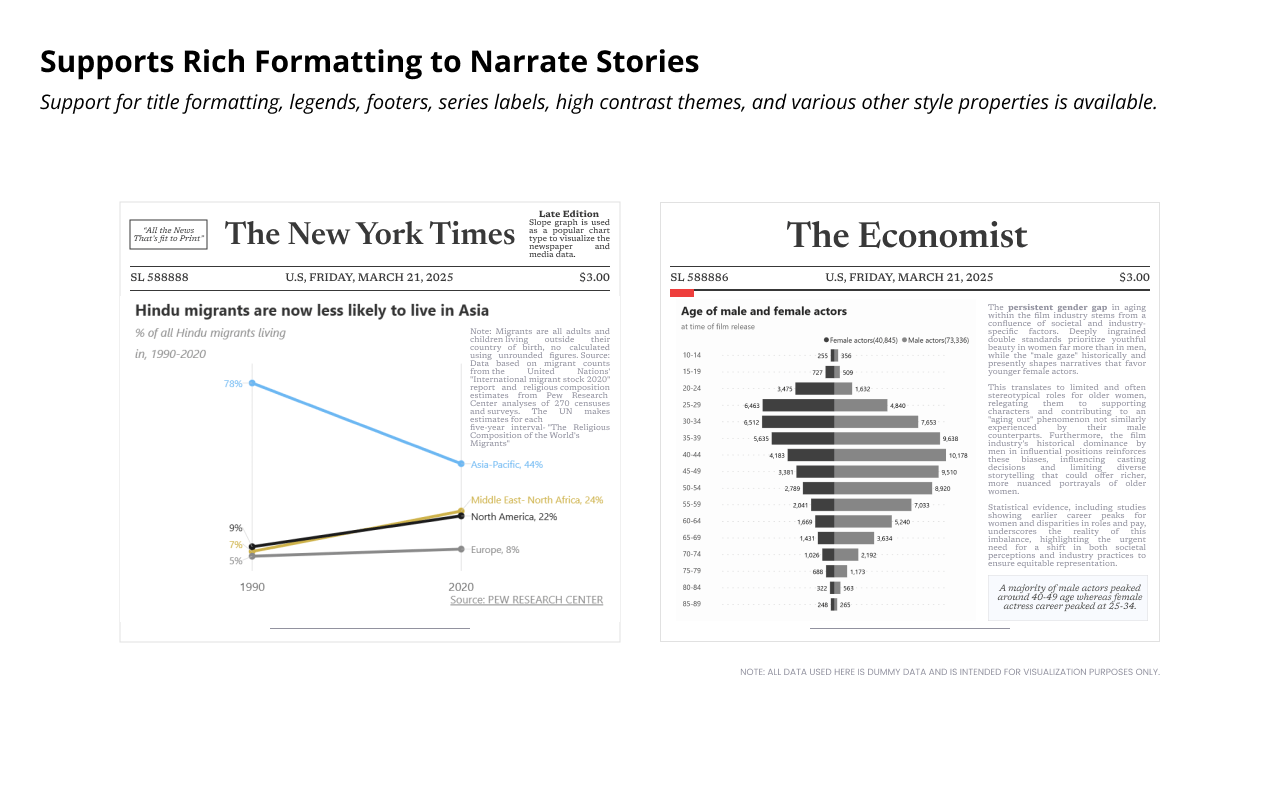
Rich formatting

Rich Formatting

Features include ranking, sorting, legends, number formatting, aggregation, conditional formatting, axis breaks, and pixel-perfect export to PDF.

Ranking

Filter top/bottom N values dynamically, with an option to group the remaining as “Others.”

Gallery

Show More
Show Less

Featured webinar

popup-popular-charts-for-storytelling

Popular charts for storytelling

Join this webinar for a wide-ranging exploration of different chart types and their uses, their role in effective data stories and a LIVE DEMO in Power BI on creating 50+ chart types with in-built storytelling customizations.
Watch now

Pricing

Get Storytelling chart family

Billed at
$9,995 Unlimited users
Buy storytelling chart family for your entire organization;
Buy now

Get the entire Analytics+ suite

Starts at
$3  /user/month (2 - 999 users)
$2.40  /user/month (1000+ users)
Buy all the 100+ Charts, KPI cards and Tables;
Buy now

Get Waterfall chart Family

Billed at

$9,995

/year
Buy waterfall chart family for your entire organization;
Buy now

Get storytelling chart family

Popular Storytelling Chart in Power BI

Explore all 50+ chart types that you can create in Power BI without using scripting or DAX.​

popular-charts-for-storytelling-mockup

Get Inforiver brochure

Maximize your business potential with Inforiver's paginated reporting, data entry, planning & budgeting capabilities
Download now
Inforiver

Inforiver helps enterprises consolidate planning, reporting & analytics on a single platform (Power BI). The no-code, self-service award-winning platform has been recognized as the industry’s best and is adopted by many Fortune 100 firms.

Inforiver is a product of Lumel, the #1 Power BI AppSource Partner. The firm serves over 3,000 customers worldwide through its portfolio of products offered under the brands Inforiver, EDITable, ValQ, and xViz.

linkedin facebook pinterest youtube rss twitter instagram facebook-blank rss-blank linkedin-blank pinterest youtube twitter instagram