Upcoming webinar on 'Inforiver Charts : The fastest way to deliver stories in Power BI', Aug 29th , Monday, 10.30 AM CST. Register Now
Upcoming webinar on 'Inforiver Charts : The fastest way to deliver stories in Power BI', Aug 29th , Monday, 10.30 AM CST. Register Now
Inforiver Writeback Matrix has a range of new enhancements to support your real-time connected planning and reporting solutions in Power BI. This 3.9 version release includes extended support for Microsoft Fabric in Infobridge and Inforiver, high-performance hierarchy handling, and Web application firewall compatibility. Our latest version offers the capabilities to create highly interactive, user-driven reports with the optimized Variables feature and streamlined visual row management.
Explore the highlights here:
1.1. Redesigned UI for data input rows
5. Commenting and collaboration
7.1. Support for Fabric Lakehouse sources
7.2. Writeback to Fabric SQL destinations
7.4. Context-aware connected planning
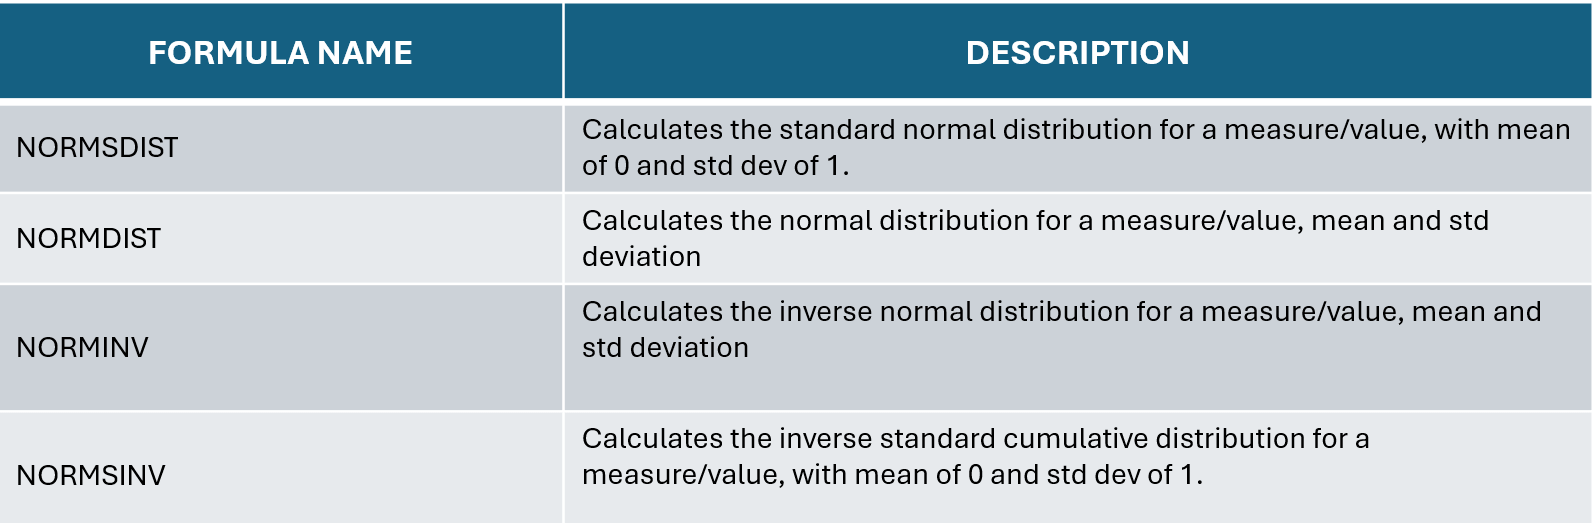
9.1. Normal distribution formulae
10.2. Performance boost for allocations
10.3. Unlock cells in the Read view
10.4. Functions for Display Settings
10.5. Conditional formatting for data input fields
Please refer to our release notes for a comprehensive list of requirements, features, and bug fixes.
Creating and managing custom rows with Inforiver has never been easier with support for formulas in parent rows, ability to switch row types and flexibility to change static rows to template rows.
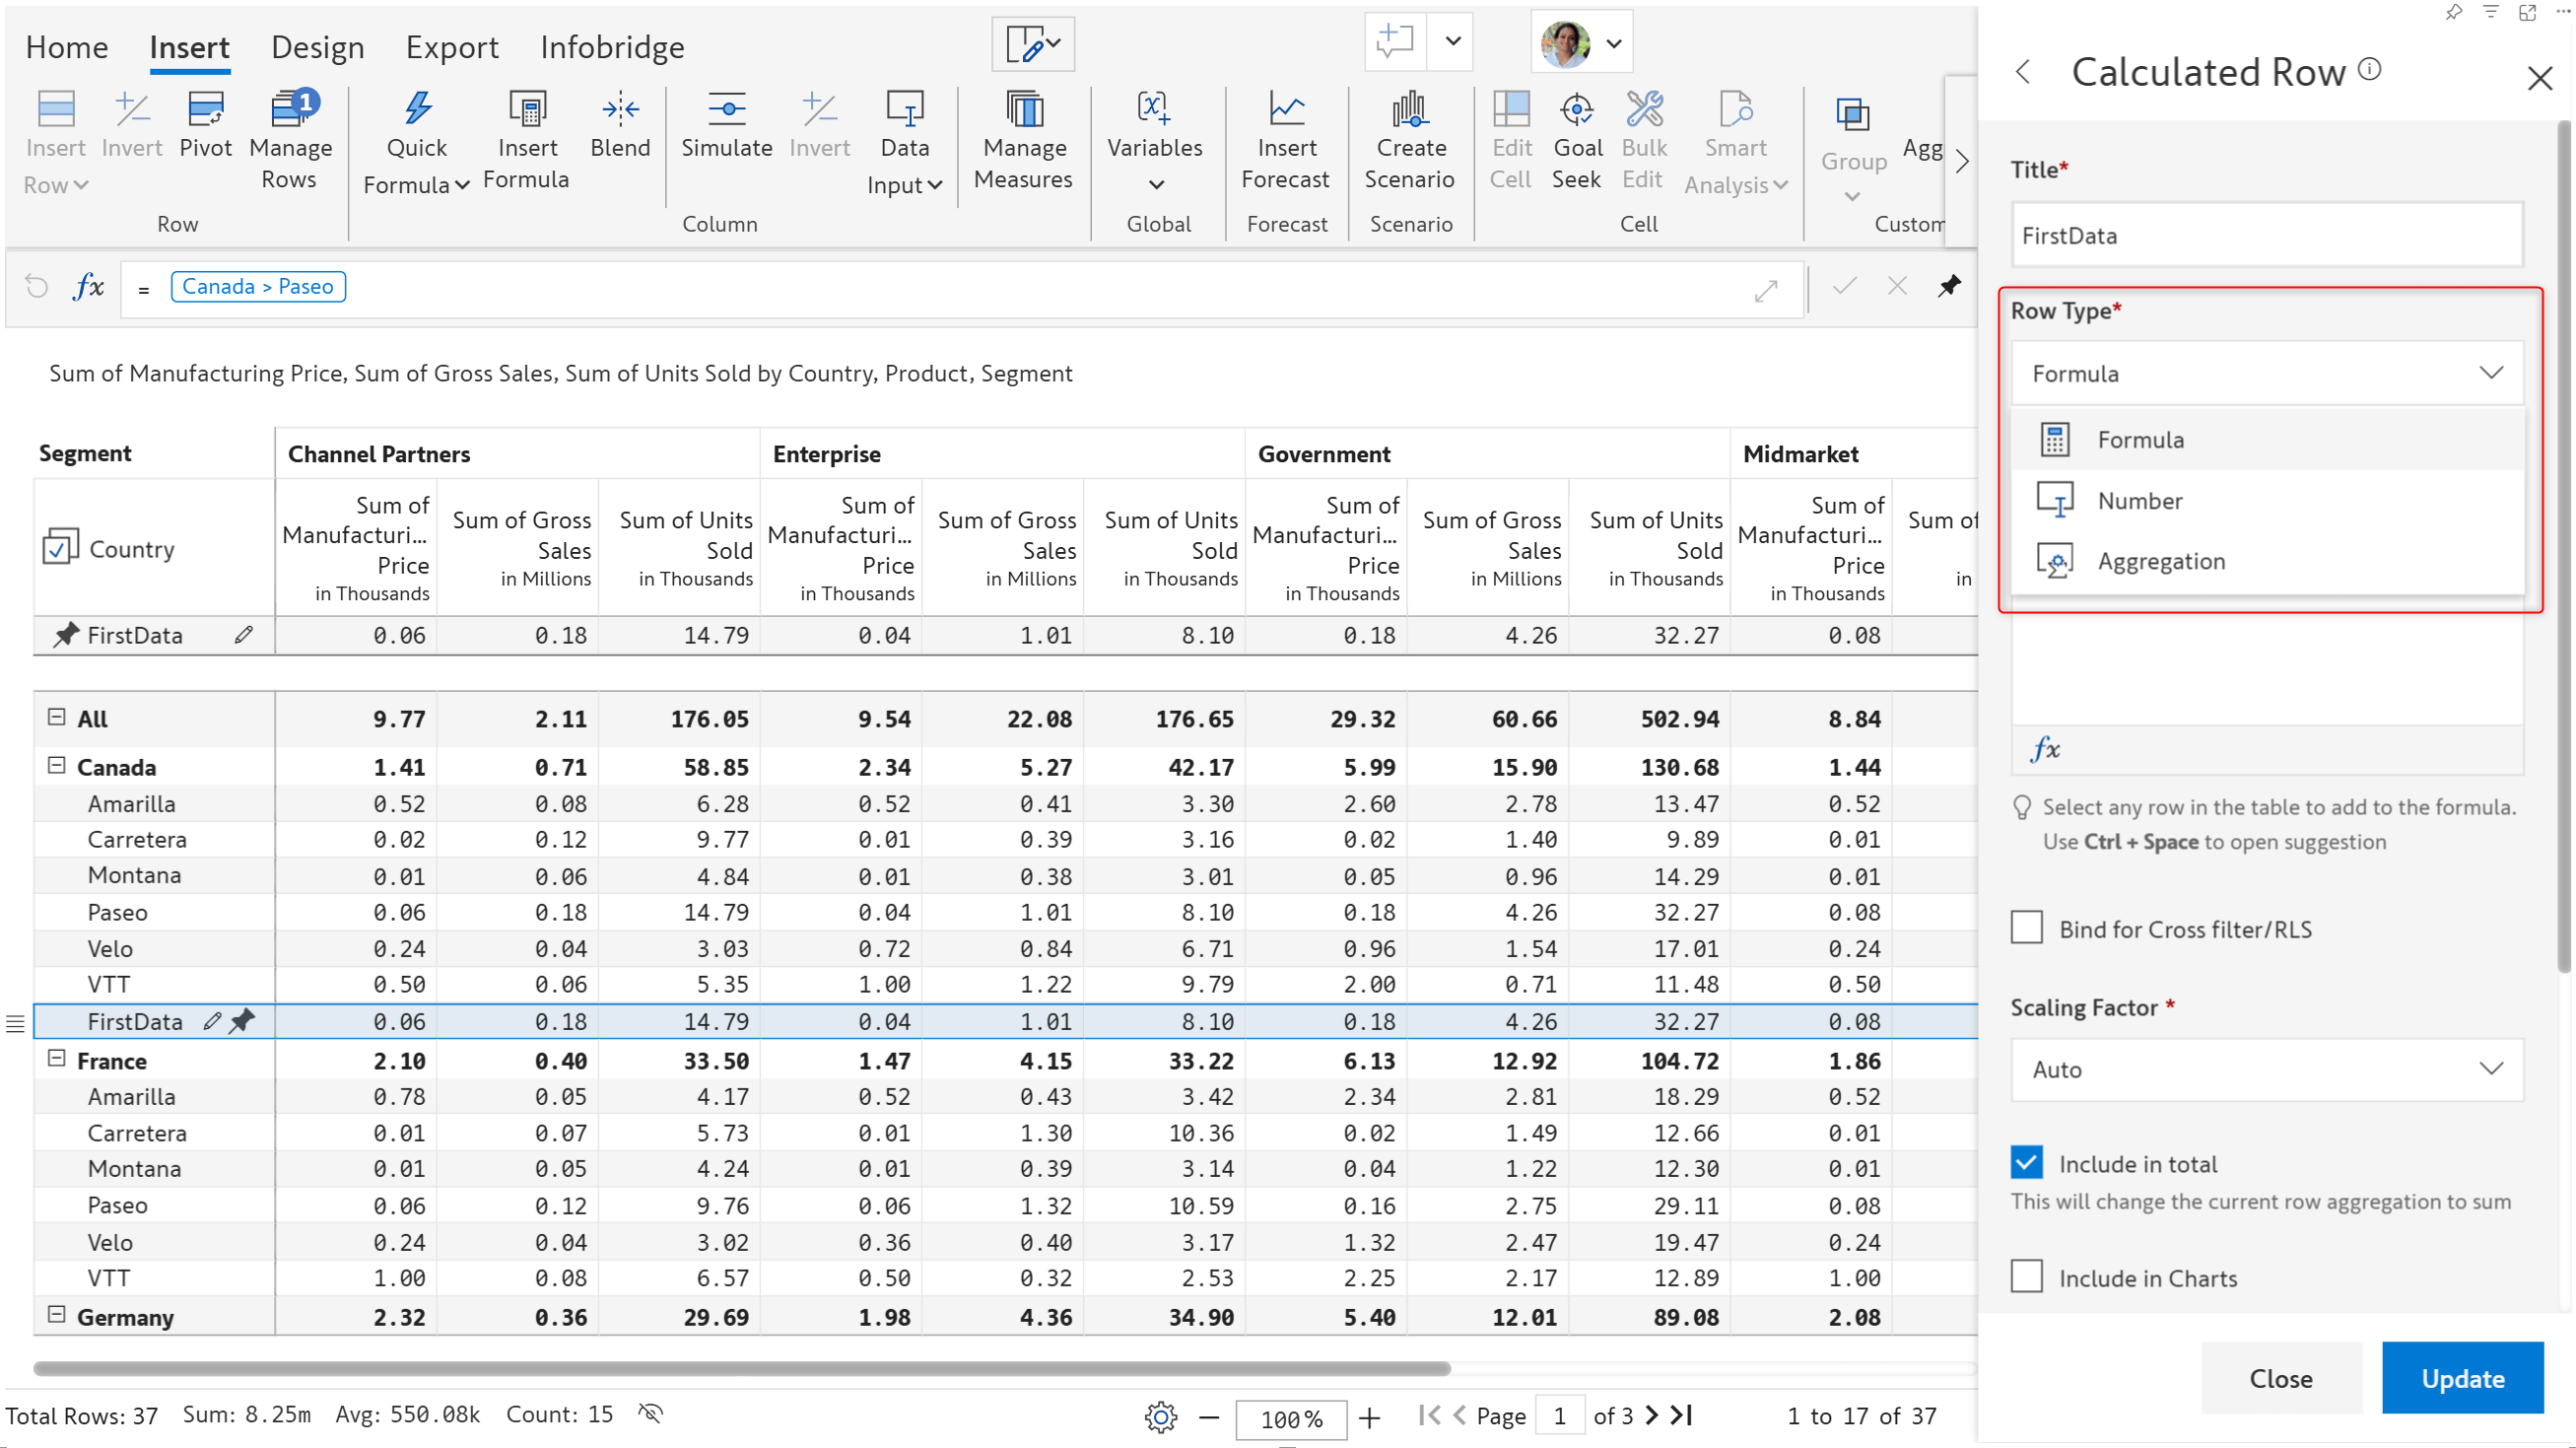
Create data input, calculated, template, and aggregated rows and govern them with the new and improved Managed Rows interface. The new Tree view will help you quickly locate custom rows and identify the hierarchical level at which they were created.
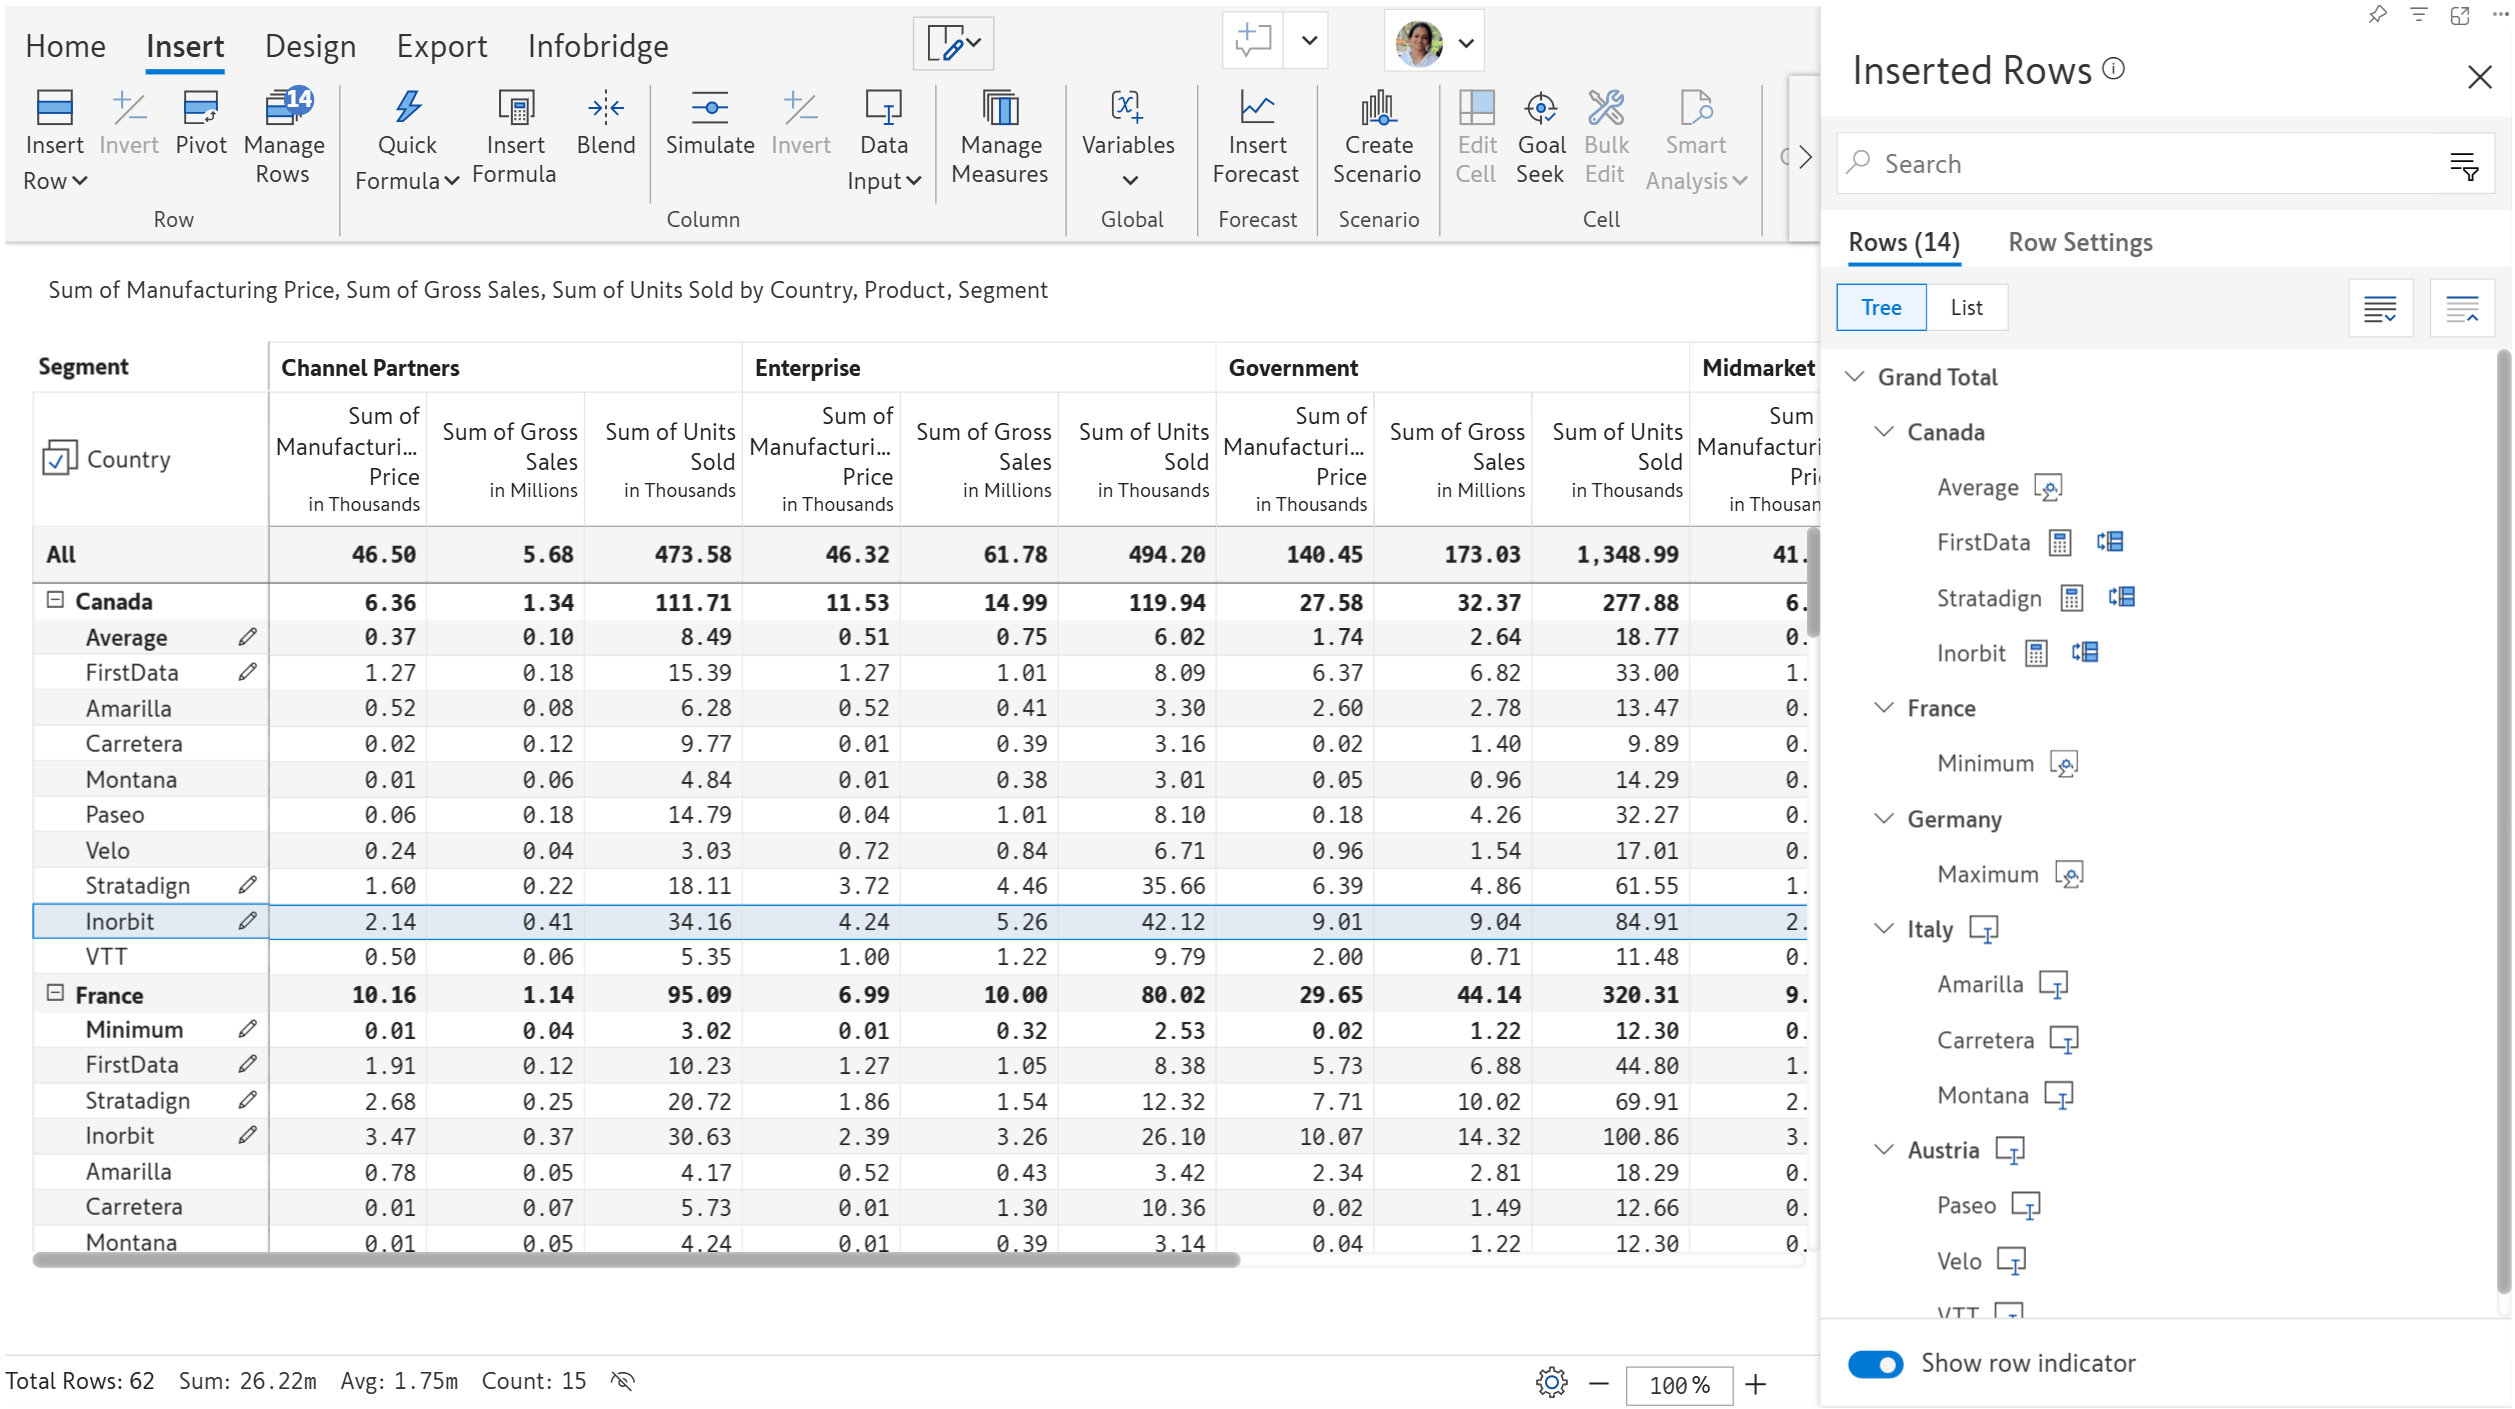
You have the flexibility to switch between data input, calculated, and aggregated rows at any time with the new Row Type dropdown. For instance, you may have used a formula and referred to the values of an existing row dimension while creating the row. You can easily change it to data input and enter values without having to create a new data input row.
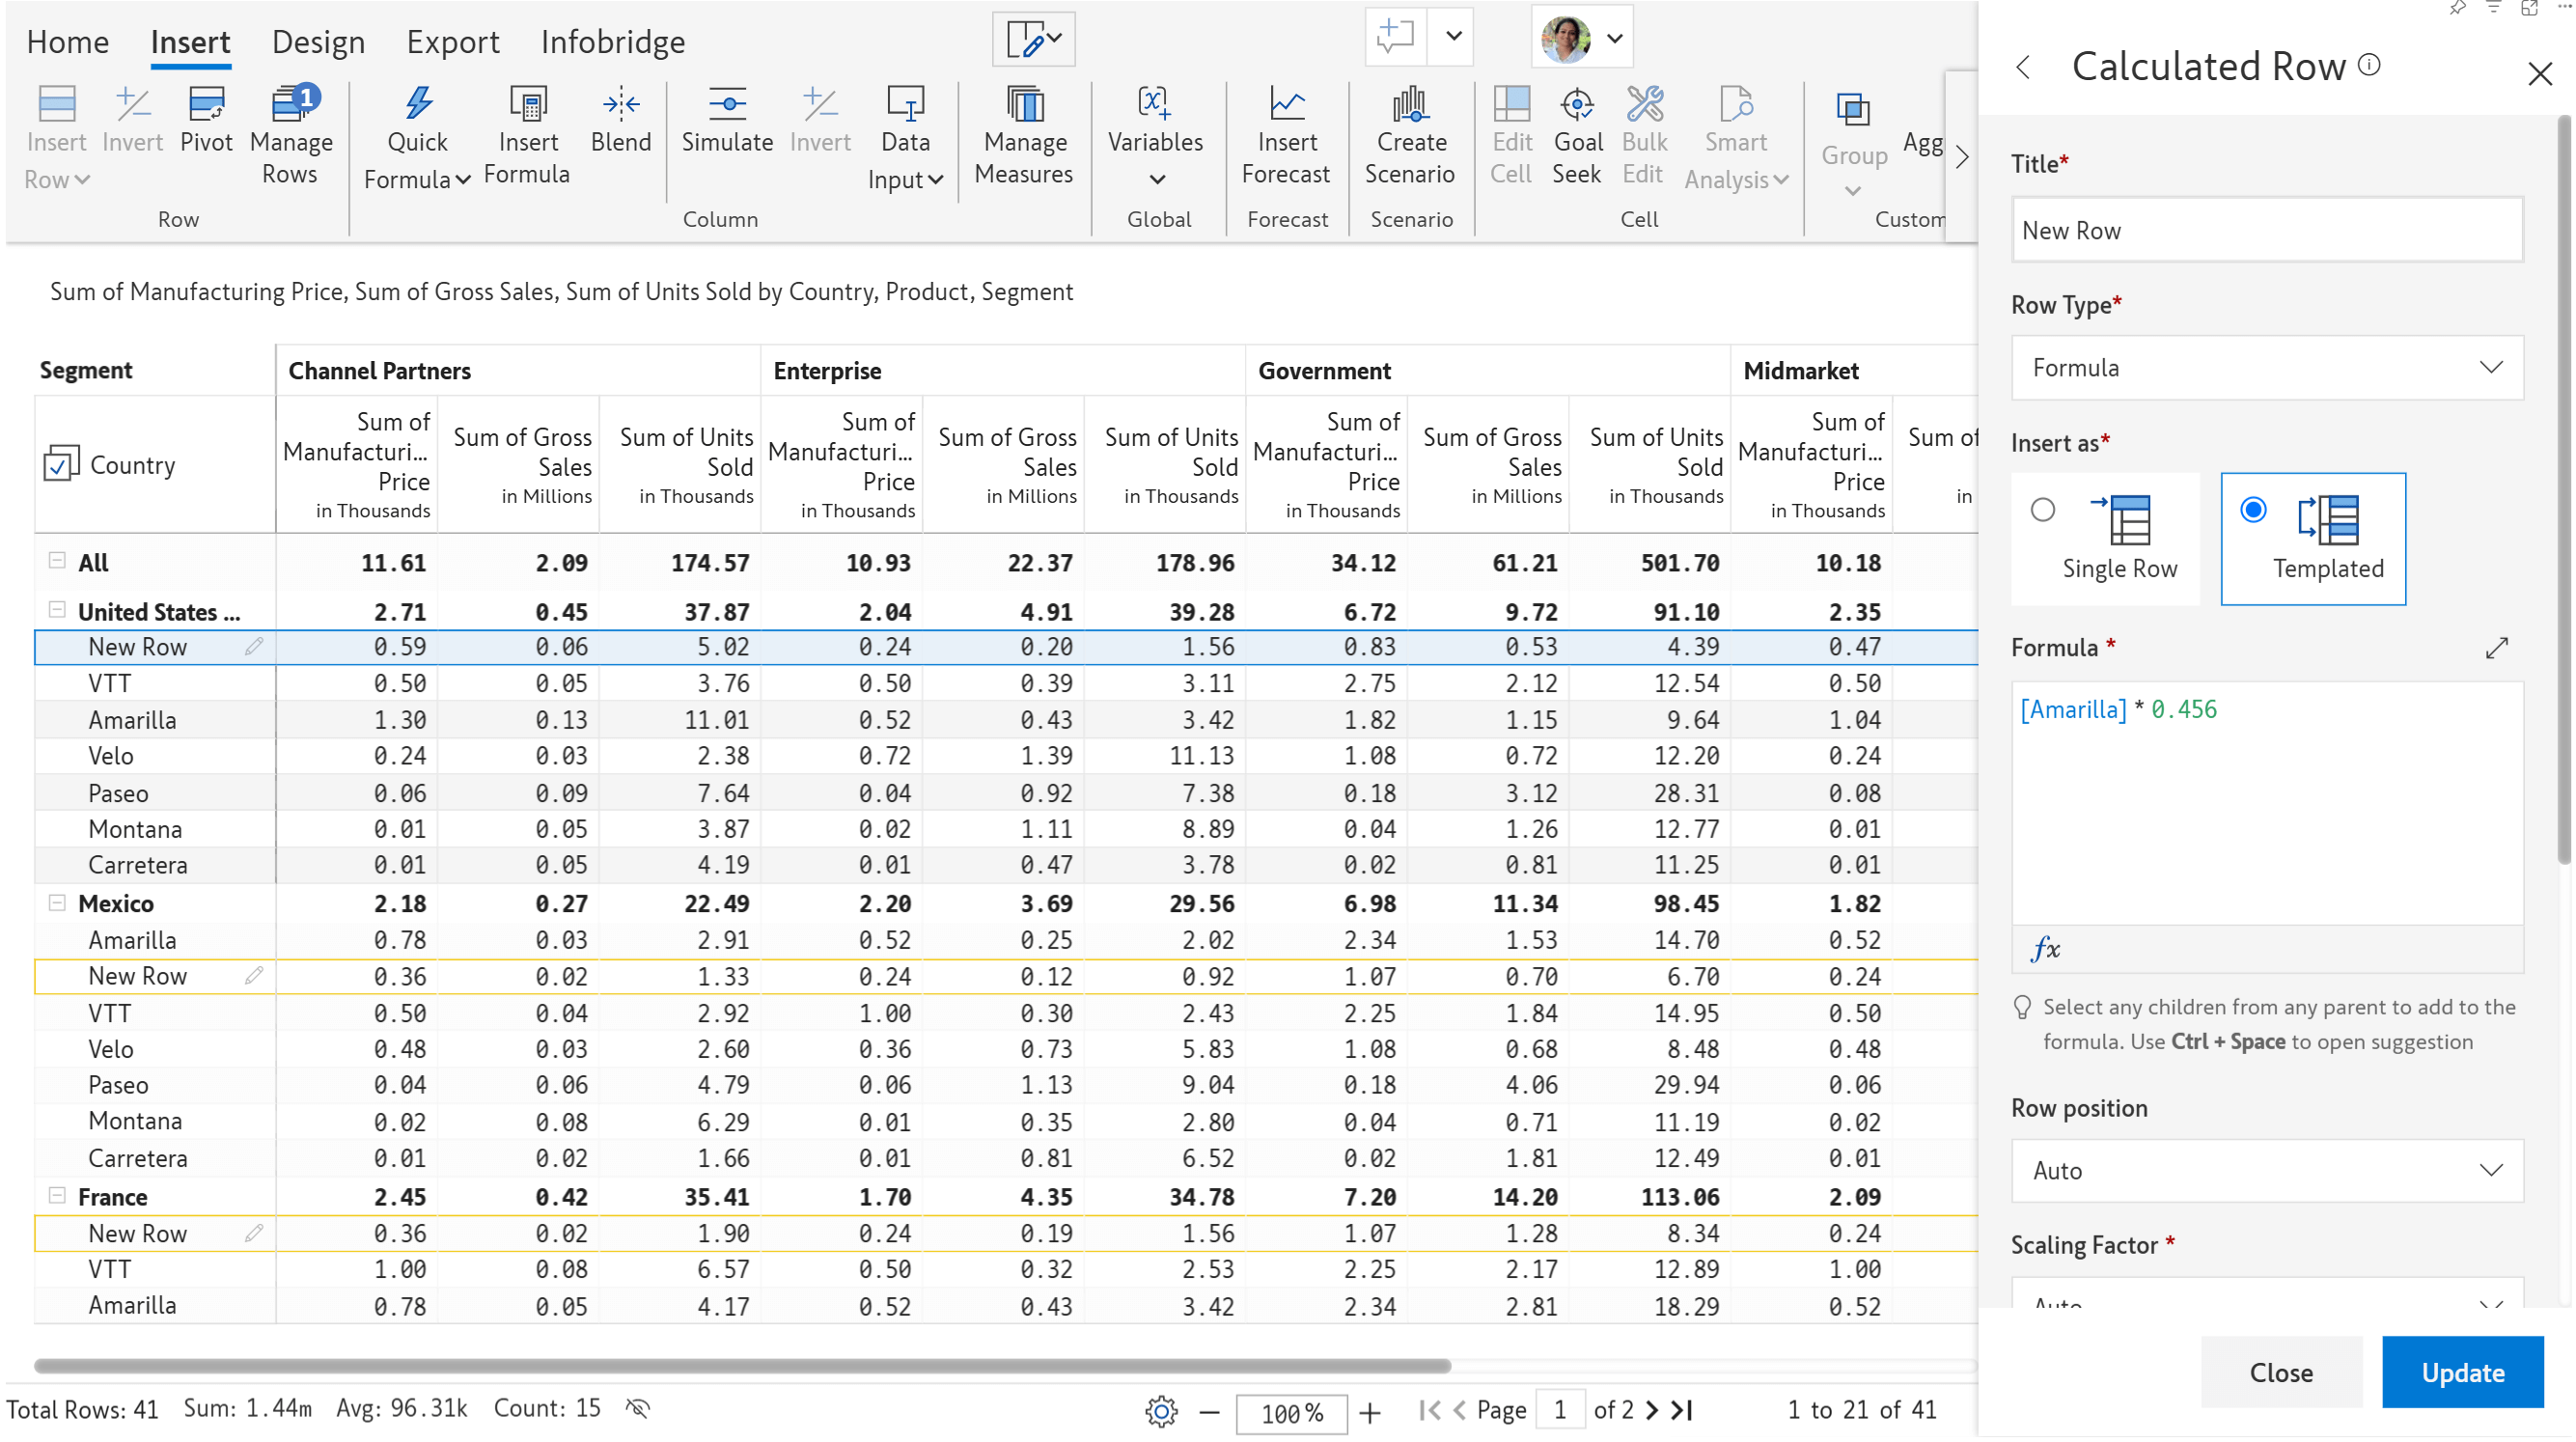
You can also convert a custom row (data input or formula) to a template row – i.e. the row will be available across all levels of the hierarchy. For instance, you may create a product line specific to a particular region. You can use the Templated option to replicate the same product line across all regions.
Variables accept user input and enable report users to navigate hierarchies, apply filters, run scripts, perform dynamic calculations, and rank data on the fly. The new easy-to-navigate UI ensures a smooth experience for creating and maintaining your variables.
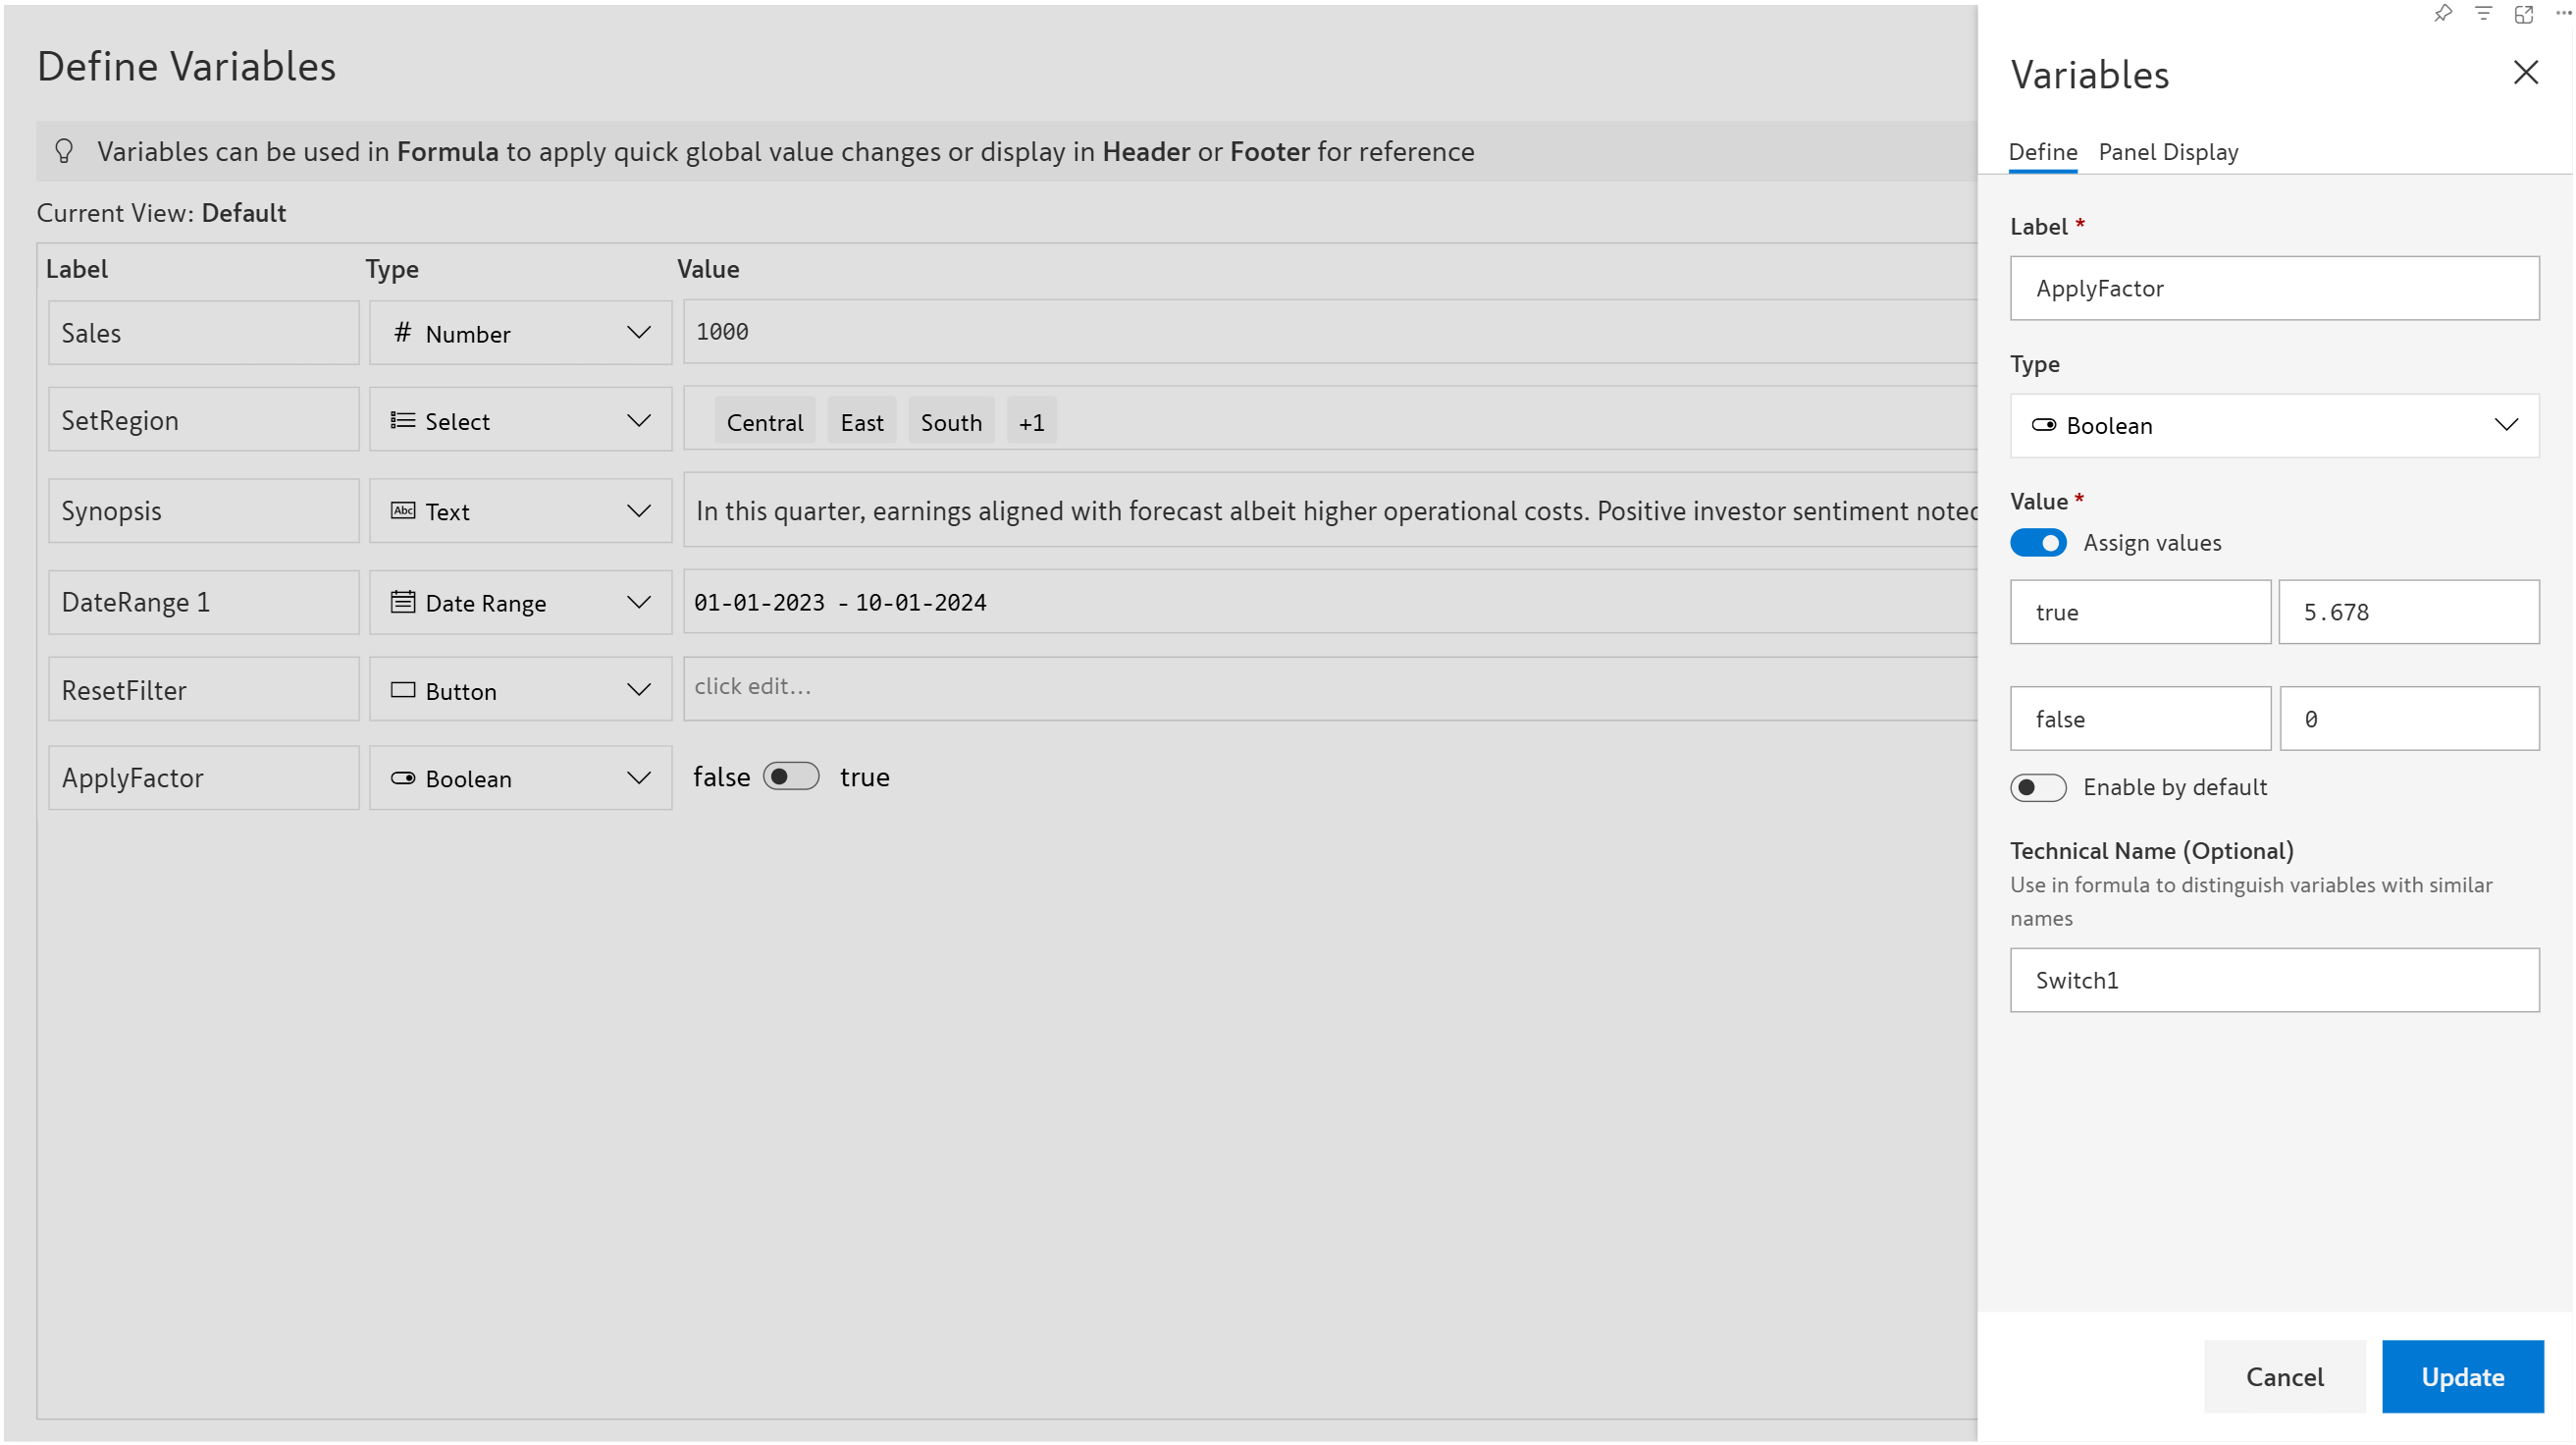
See how variables can make report navigation and editing easier without creating Inforiver filters or manually editing the header or visual measures.
If your subscription job is running long or you need to make additional modifications to your report before sending it out, you can use the new Cancel Job option in the scheduler. This will immediately abort the subscription and cancel both the parent and child jobs without having to cancel each child job individually.
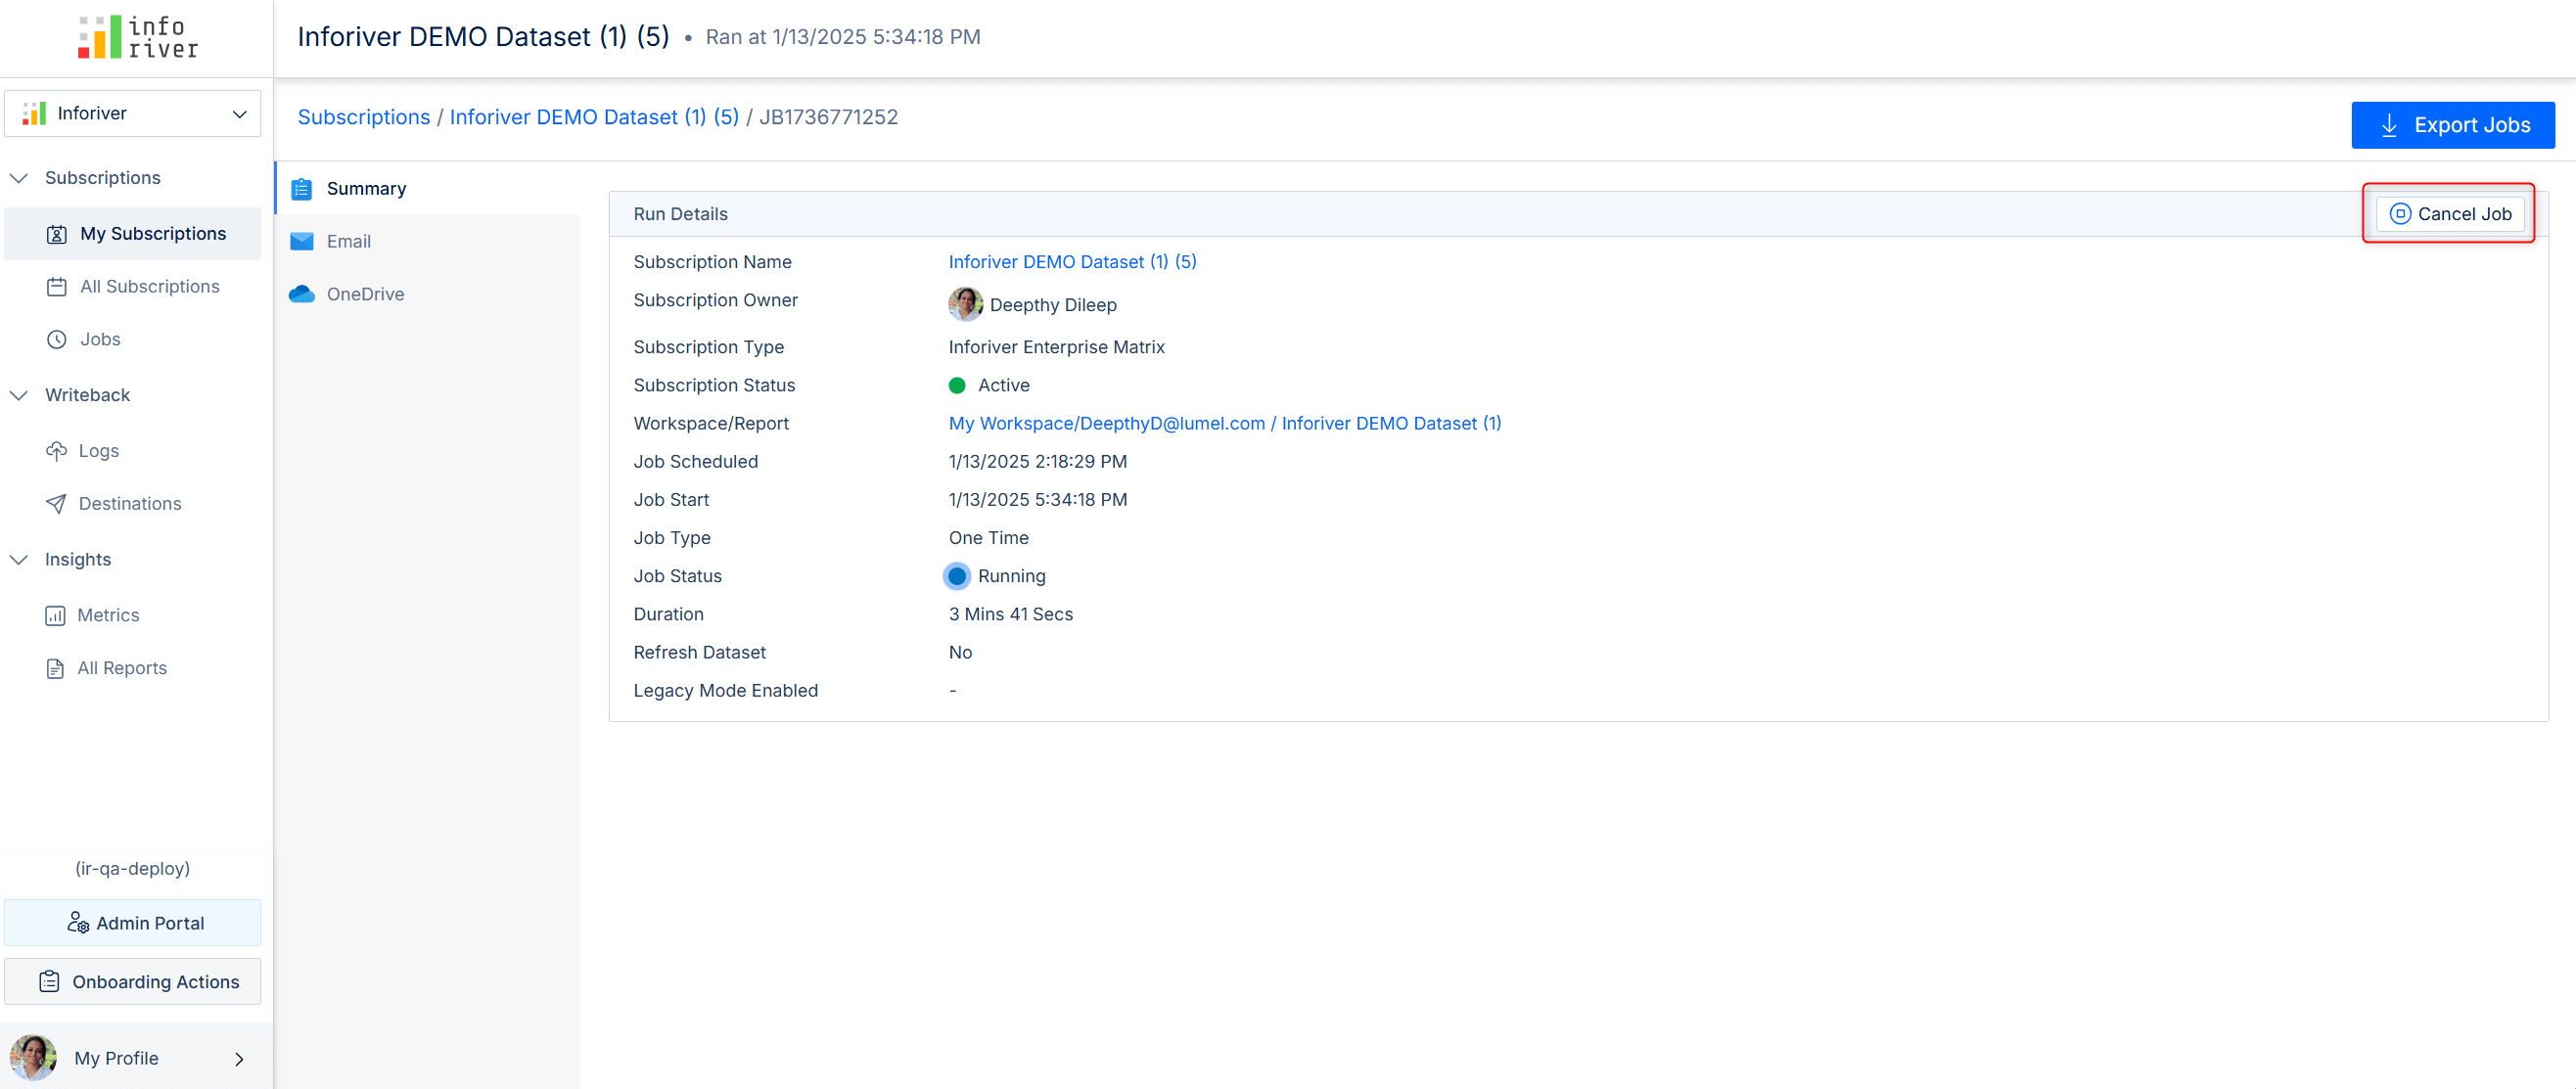
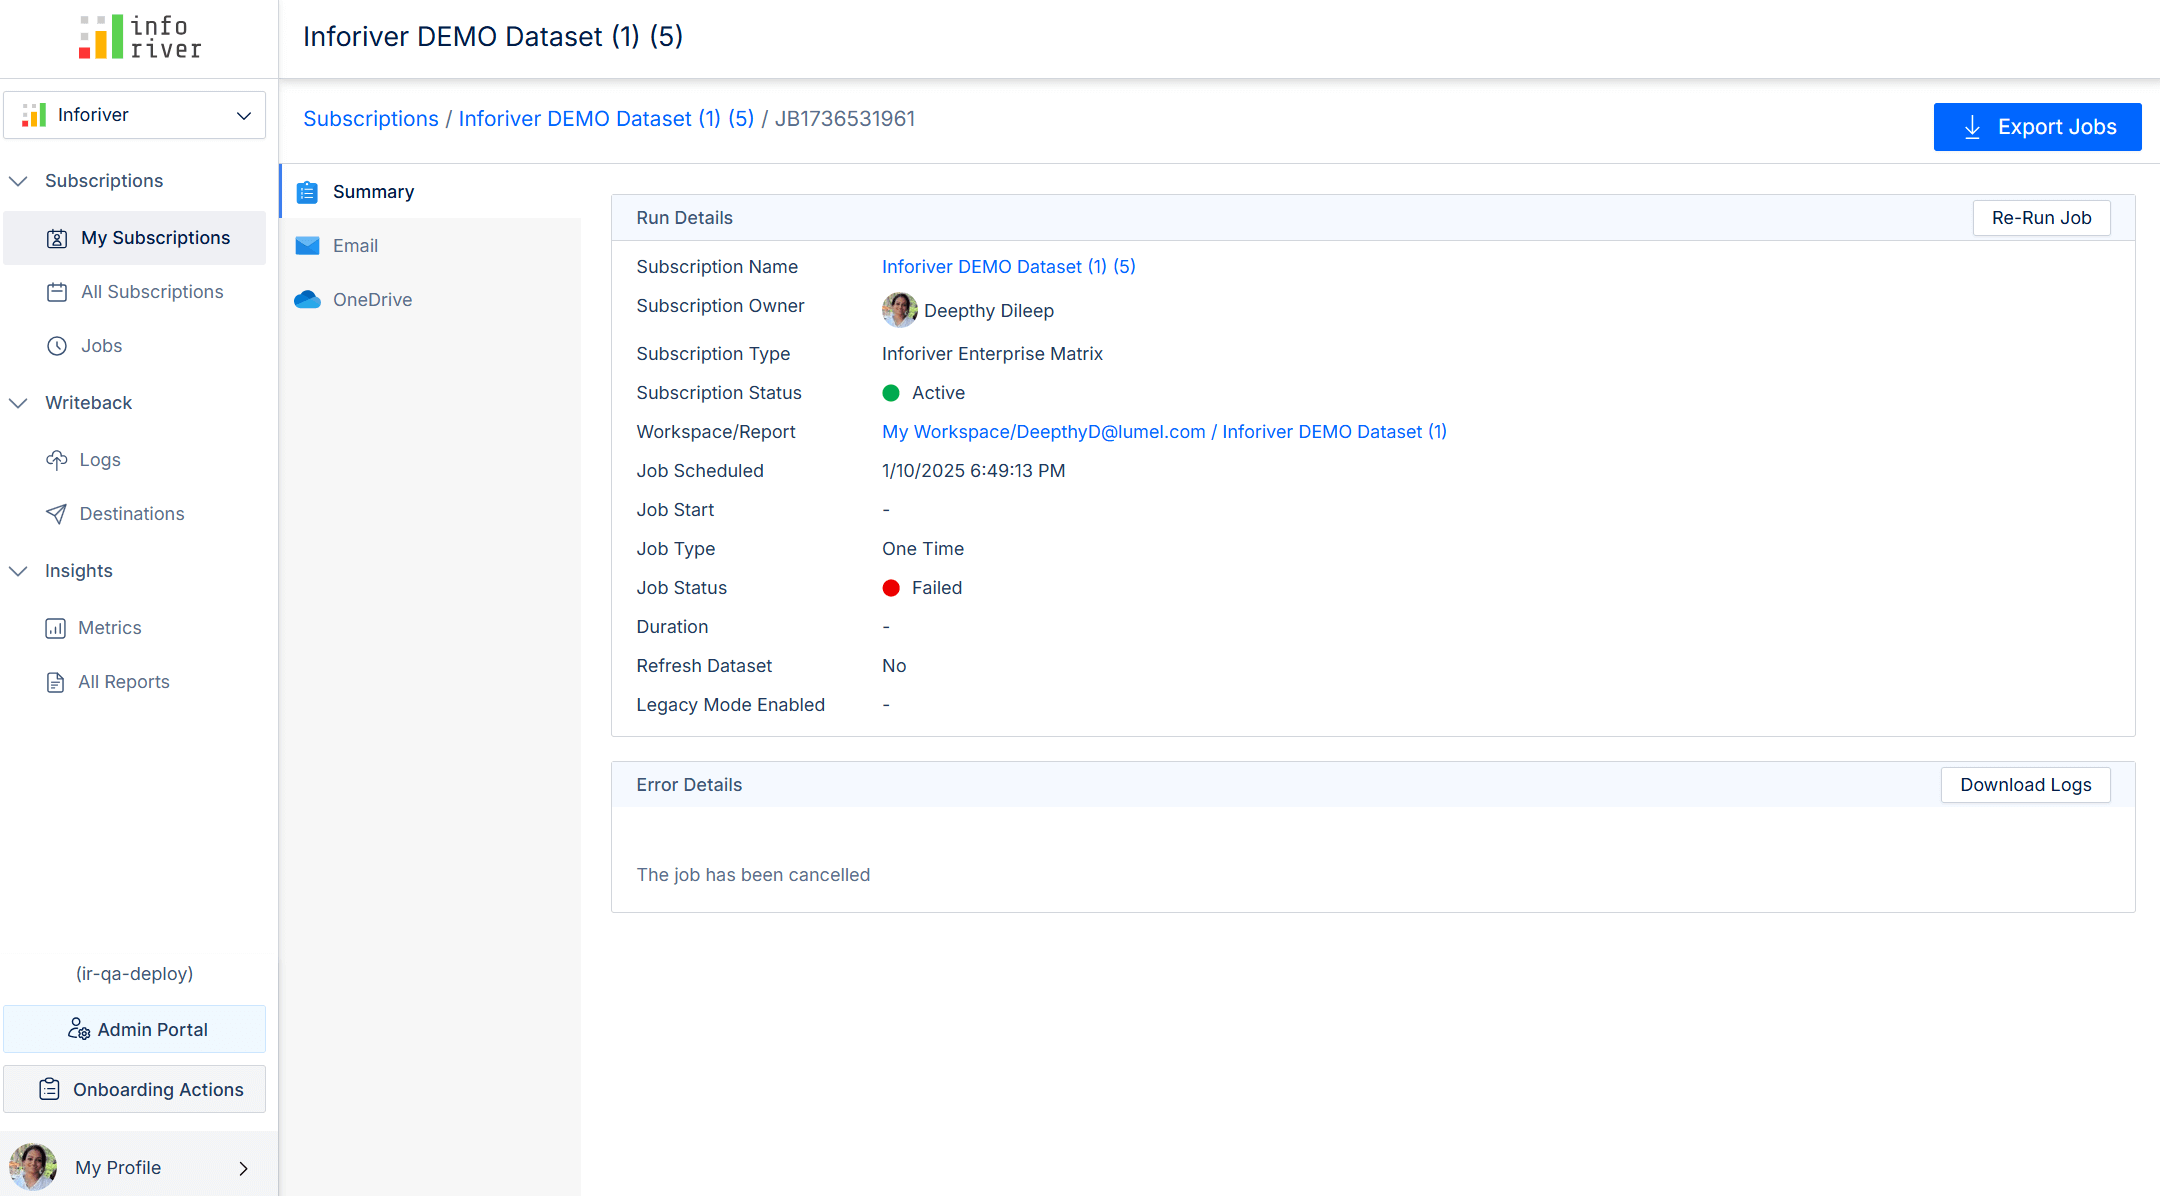
You’ll notice that the status of all your jobs is changed to Failed.
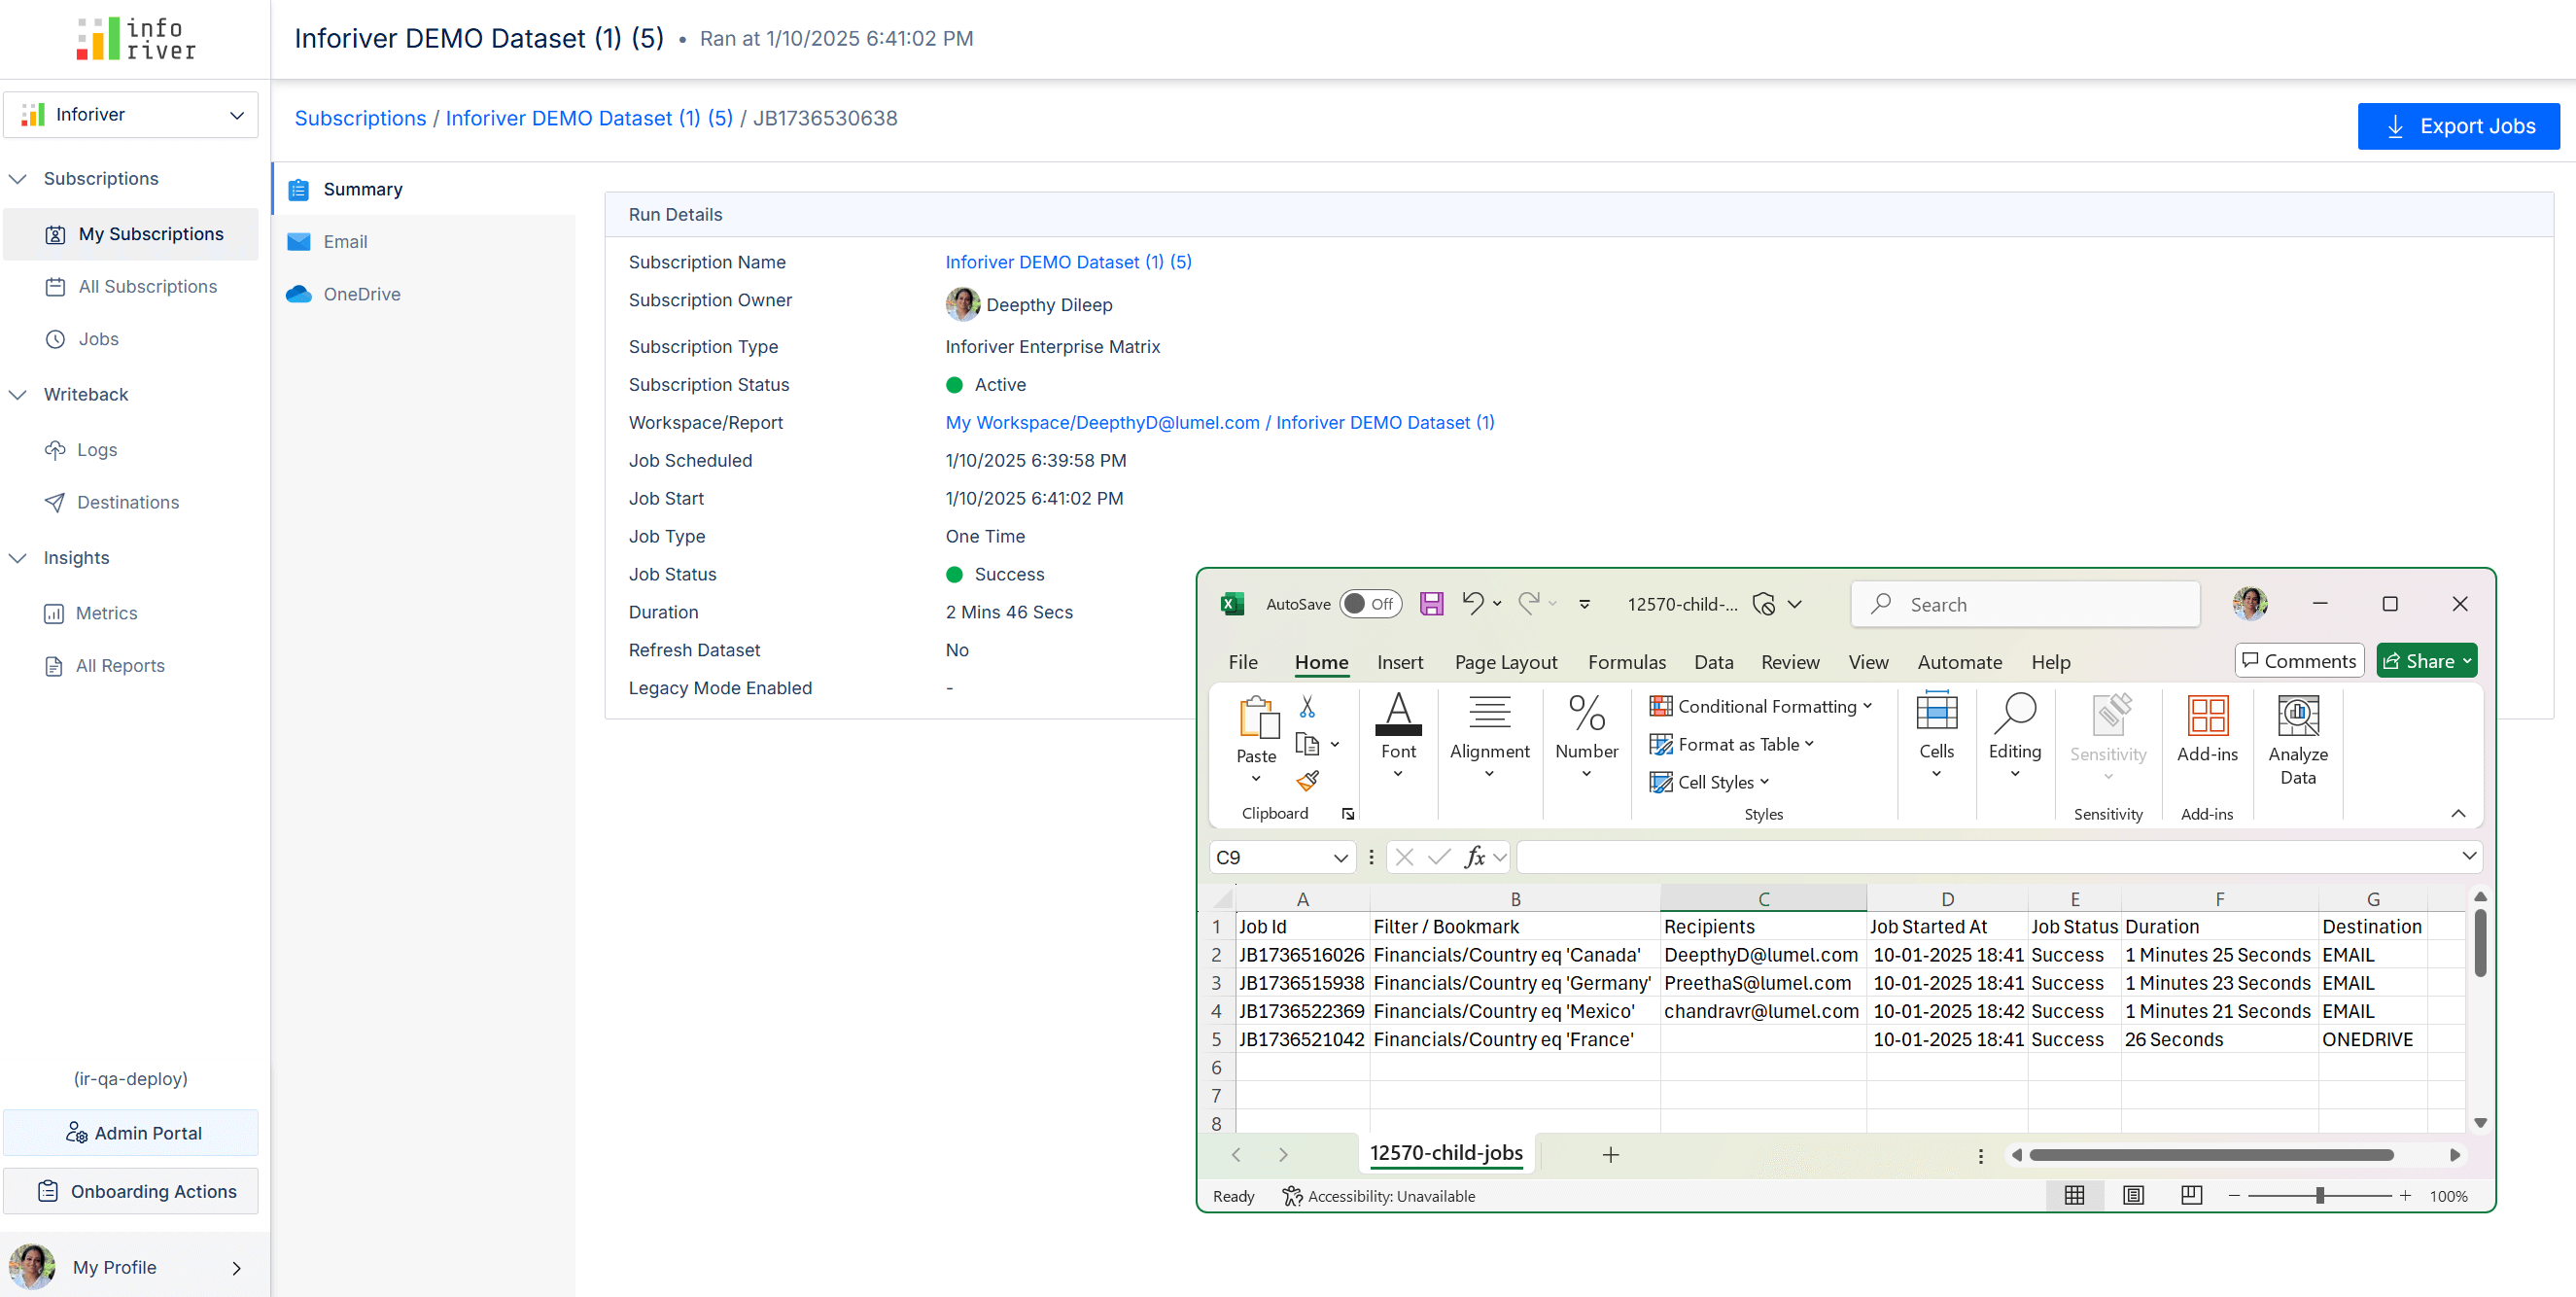
You can now download the status of your child job runs and save it to your desktop. Click the Export Jobs button to create an Excel extract.
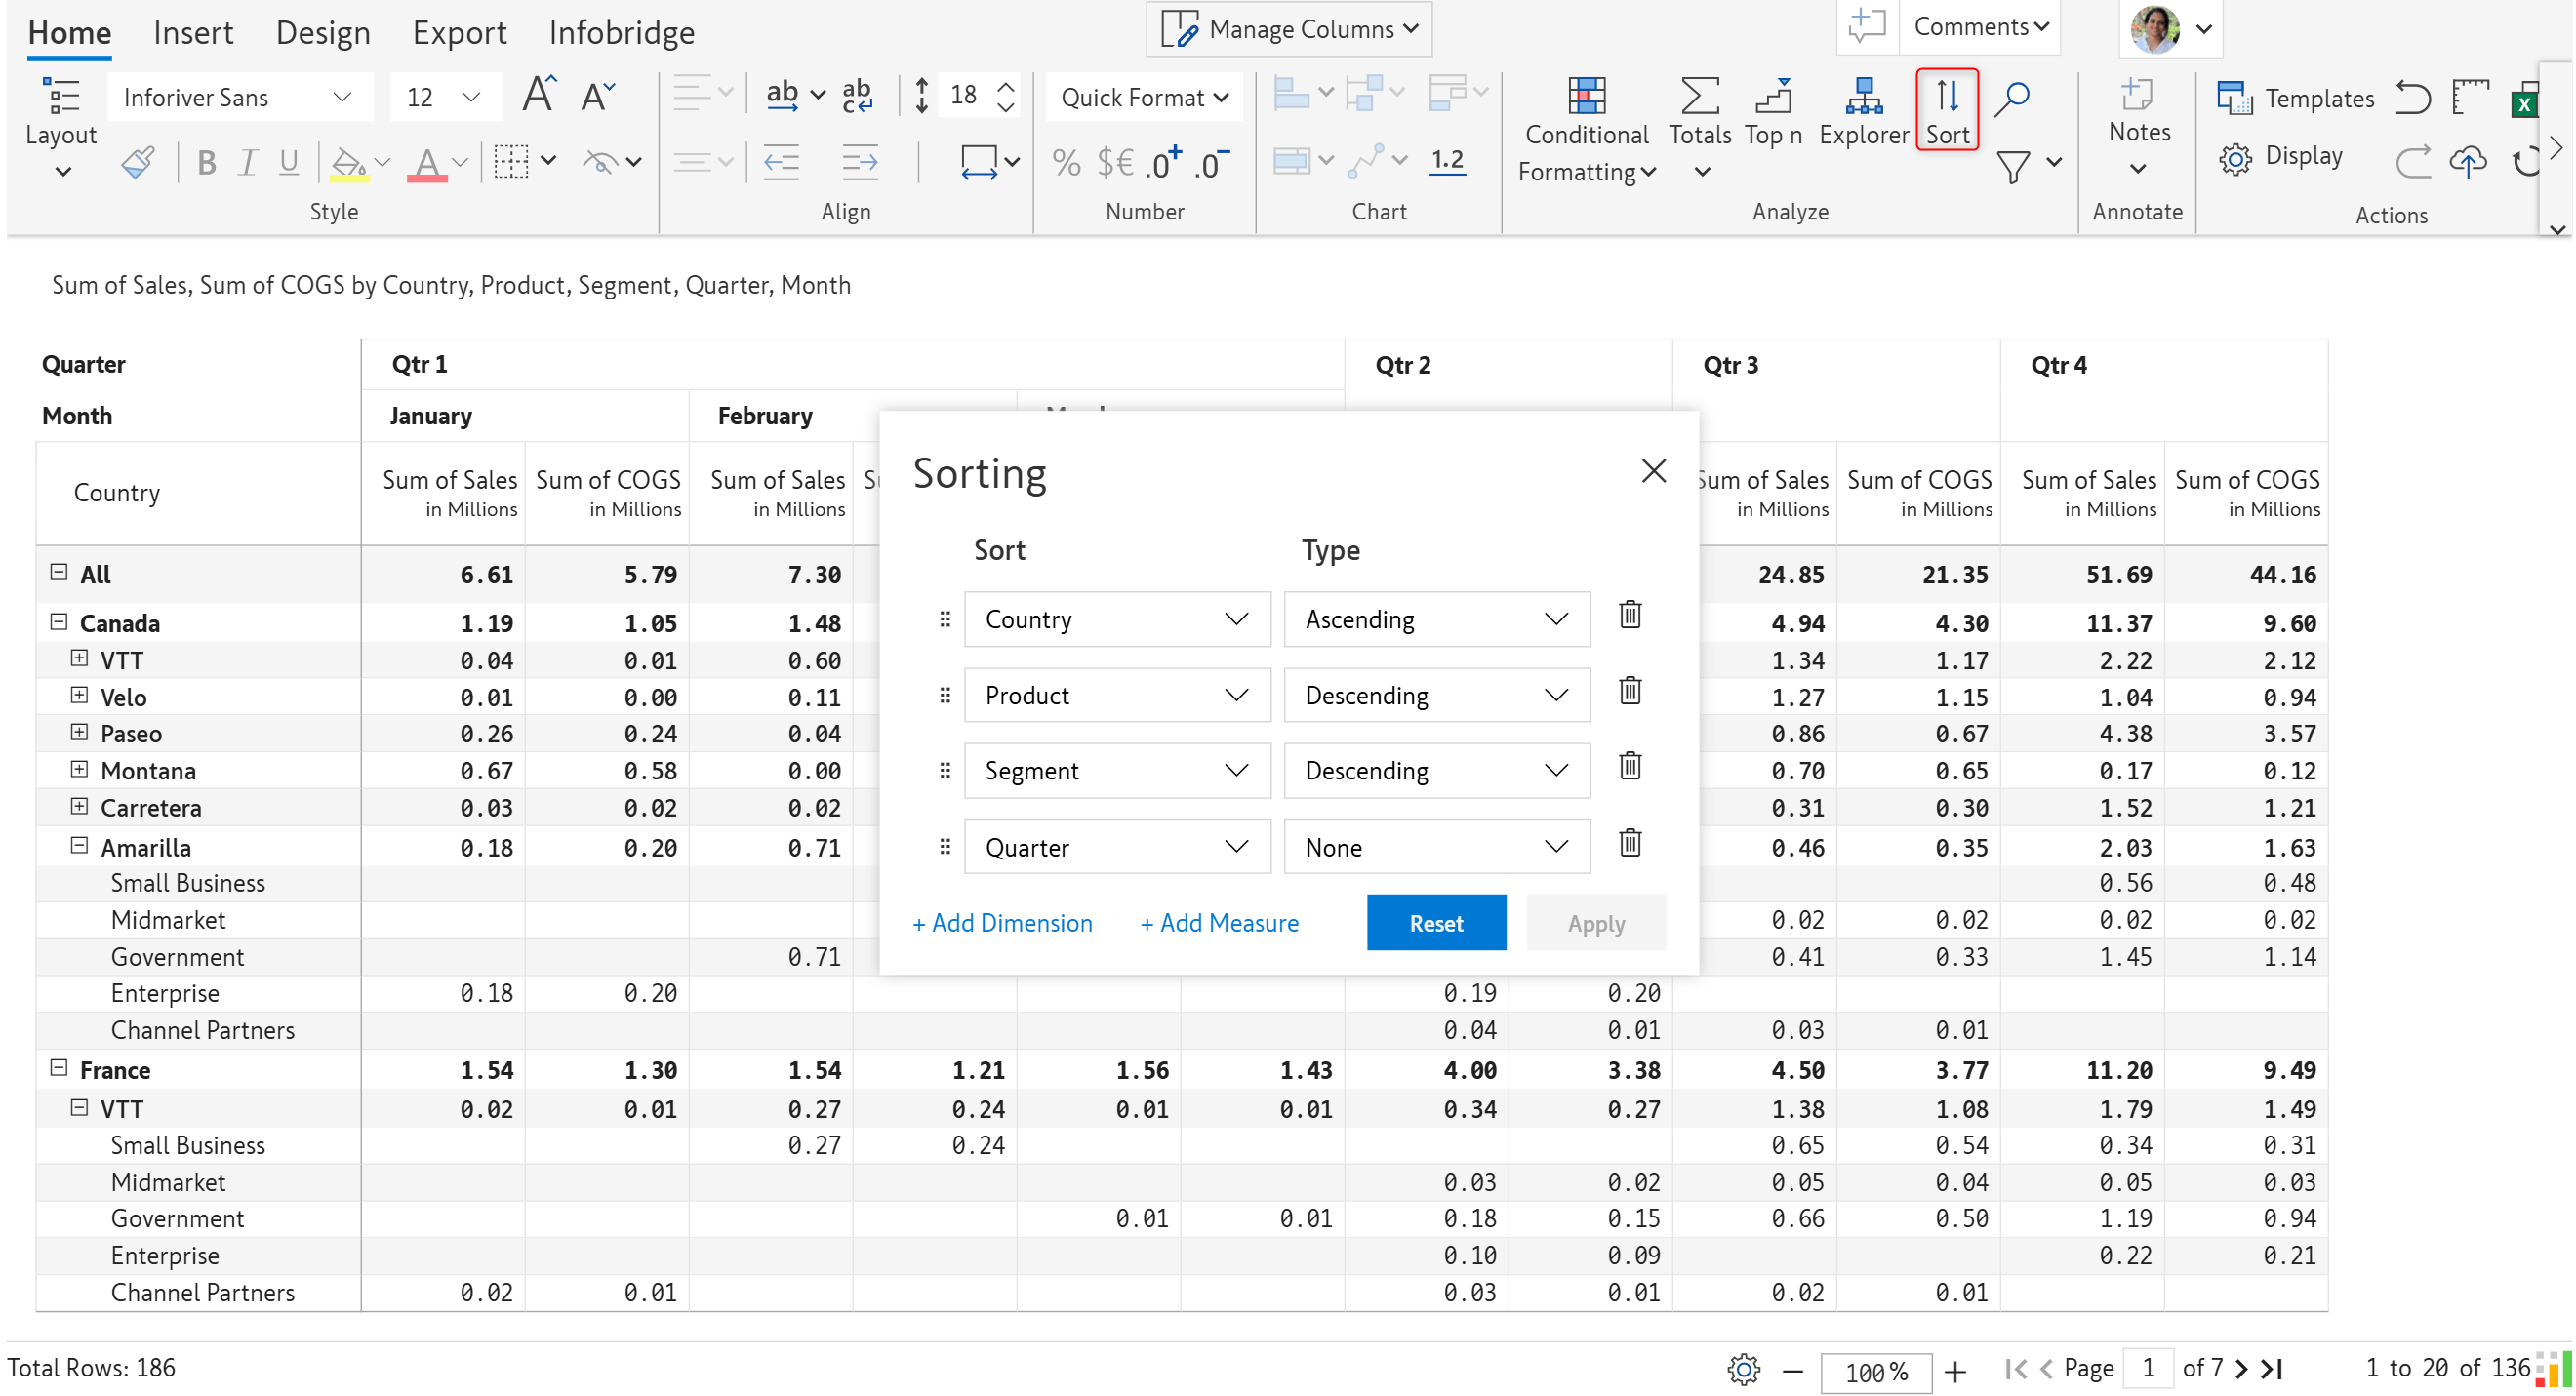
We’ve enhanced the Inforiver Sorting algorithm to provide advanced nested sorting options. You can sort your data based on multiple dimensions or measures. Please note that you can either sort based on row dimensions or based on measures, not both together.
With Inforiver’s Comments feature, you can allow users to collaborate and add more context to your reports. It doesn’t stop there – you can set priorities for comments, post replies, schedule comment digests, and assign permissions. In this version, the Comment settings have been re-structured to enhance accessibility.
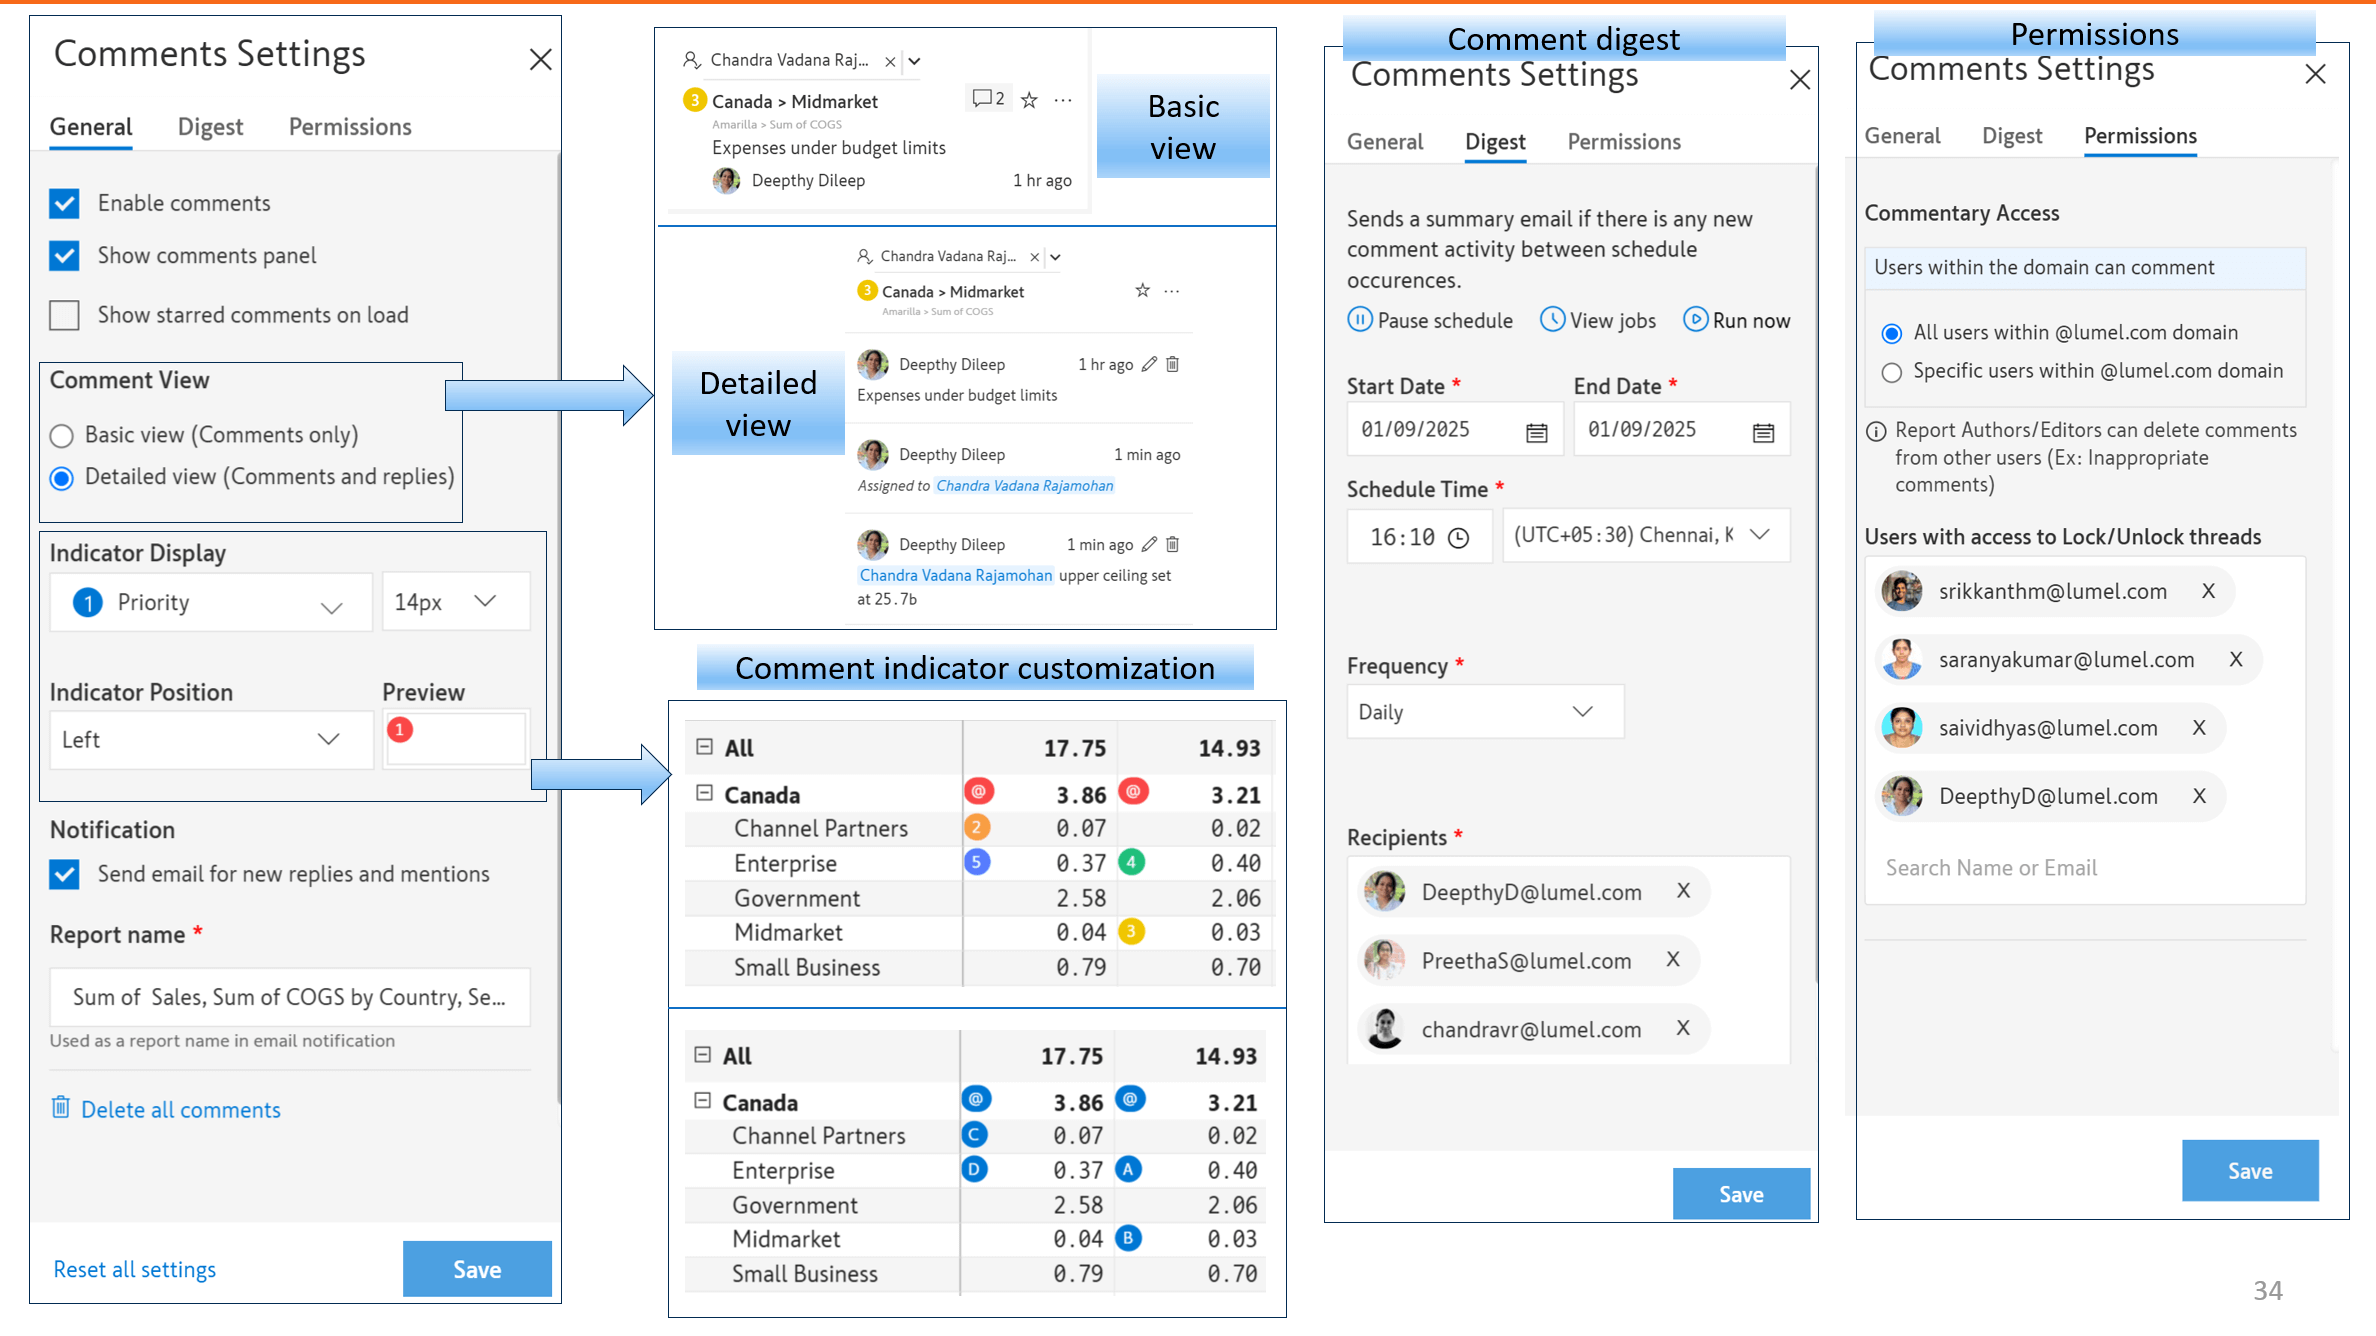
You can create starred comments, filter based on resolved/starred/your threads, and sort comments on priority/creation time from the View All Comments side pane.
To efficiently analyze extensive hierarchical datasets without compromising on performance, we recommend switching to the new Performance Table layout. You can seamlessly input data even when complex row hierarchies are involved.
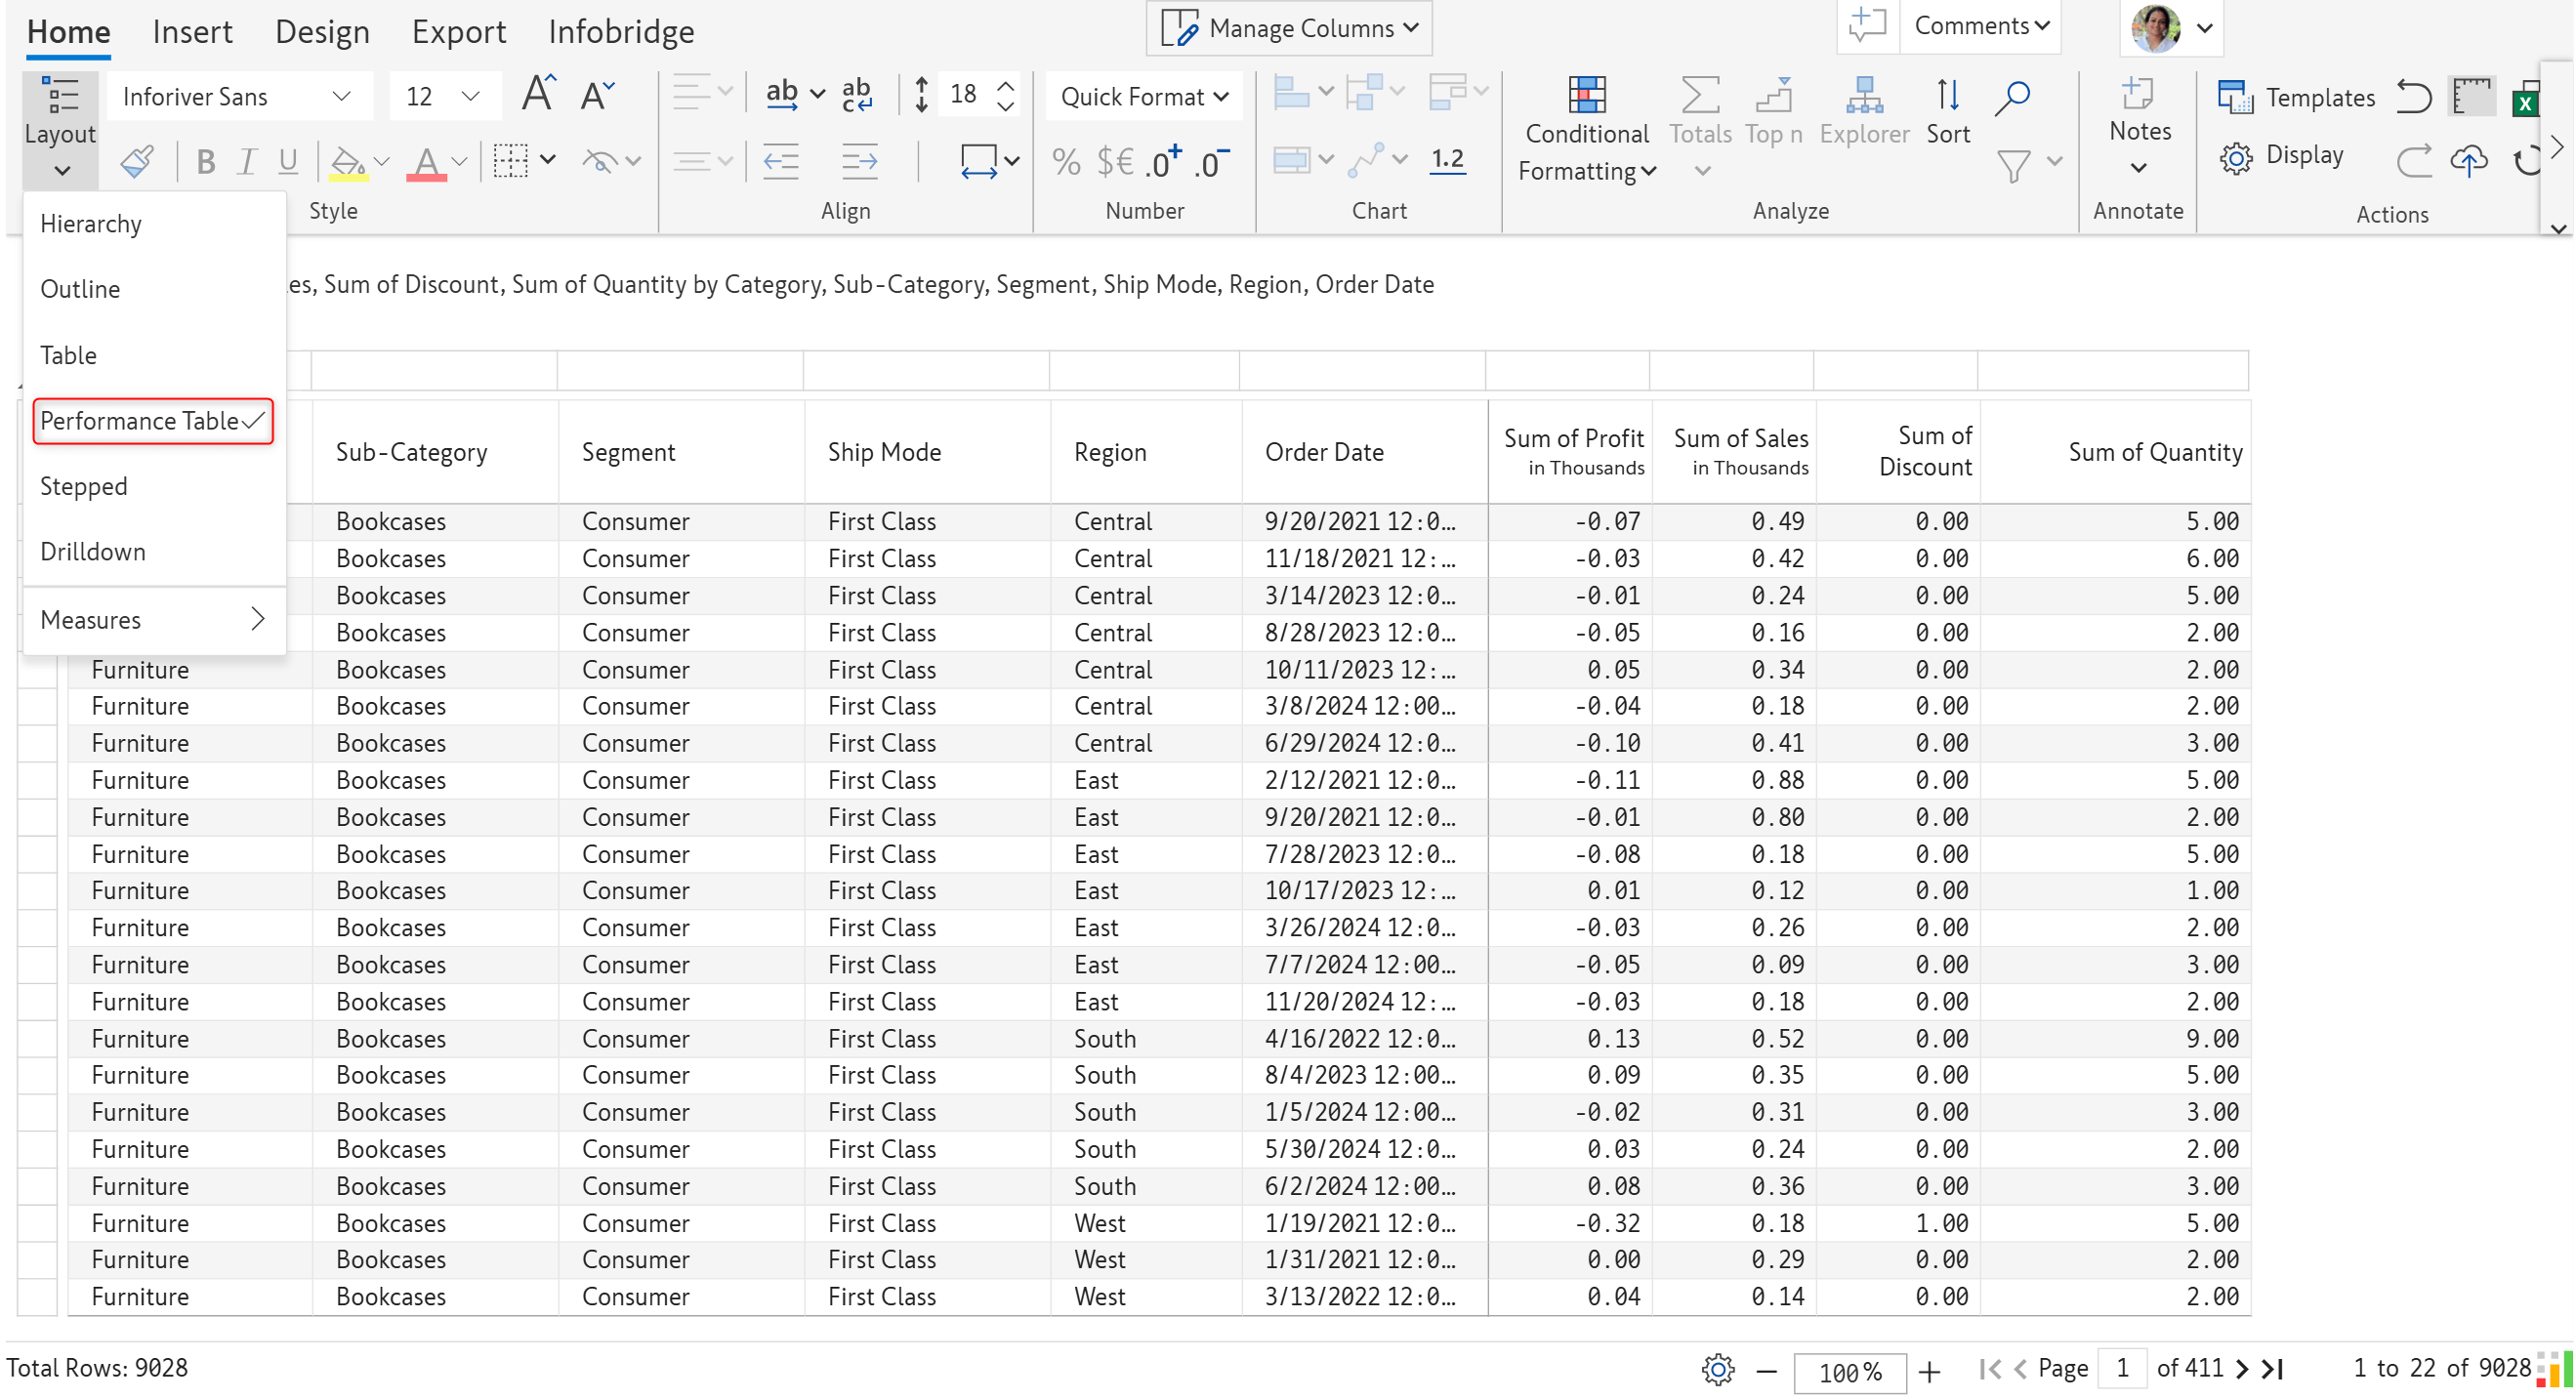
Note: This layout can be applied only when the report does not contain any column dimensions.
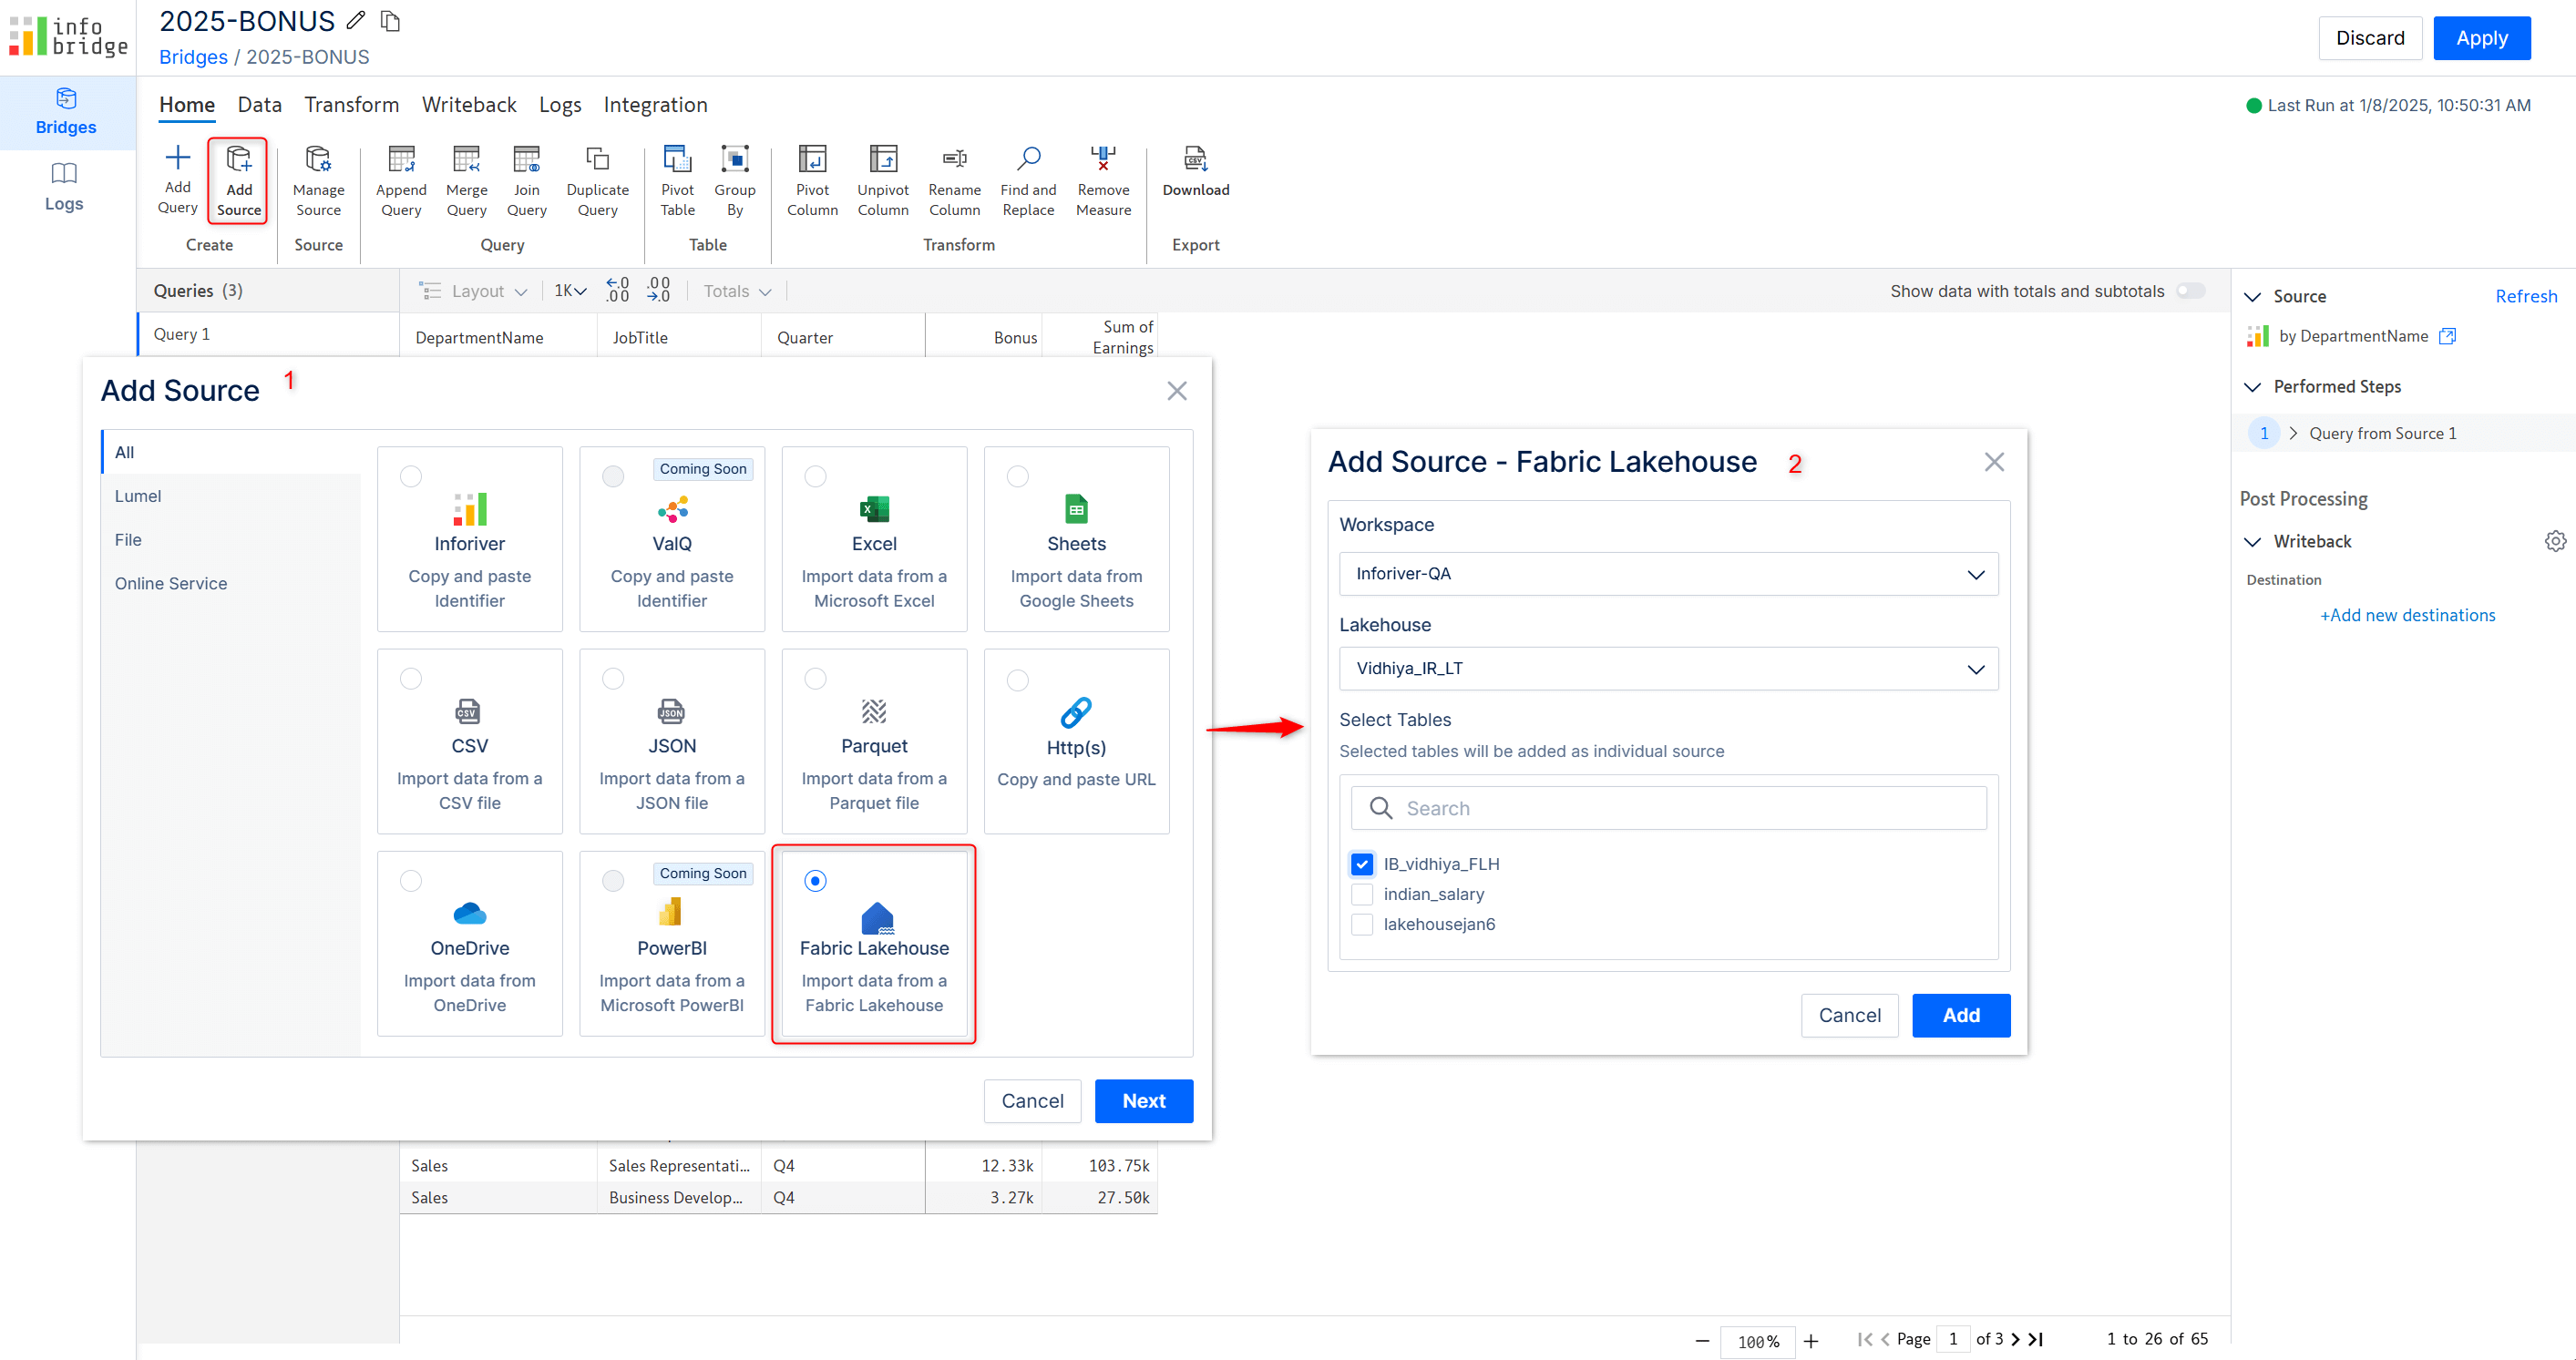
We’ve expanded Infobridge data integration capabilities – you can now import Fabric Lakehouse tables and cascade them into your connected planning reports in Inforiver.
Enter the workspace, Lakehouse, and table name to integrate the Lakehouse source. Please bear in mind that Fabric Lakehouse and Azure Data Lake Storage need to be in “Connected” state in the Admin console > My Integrations section.
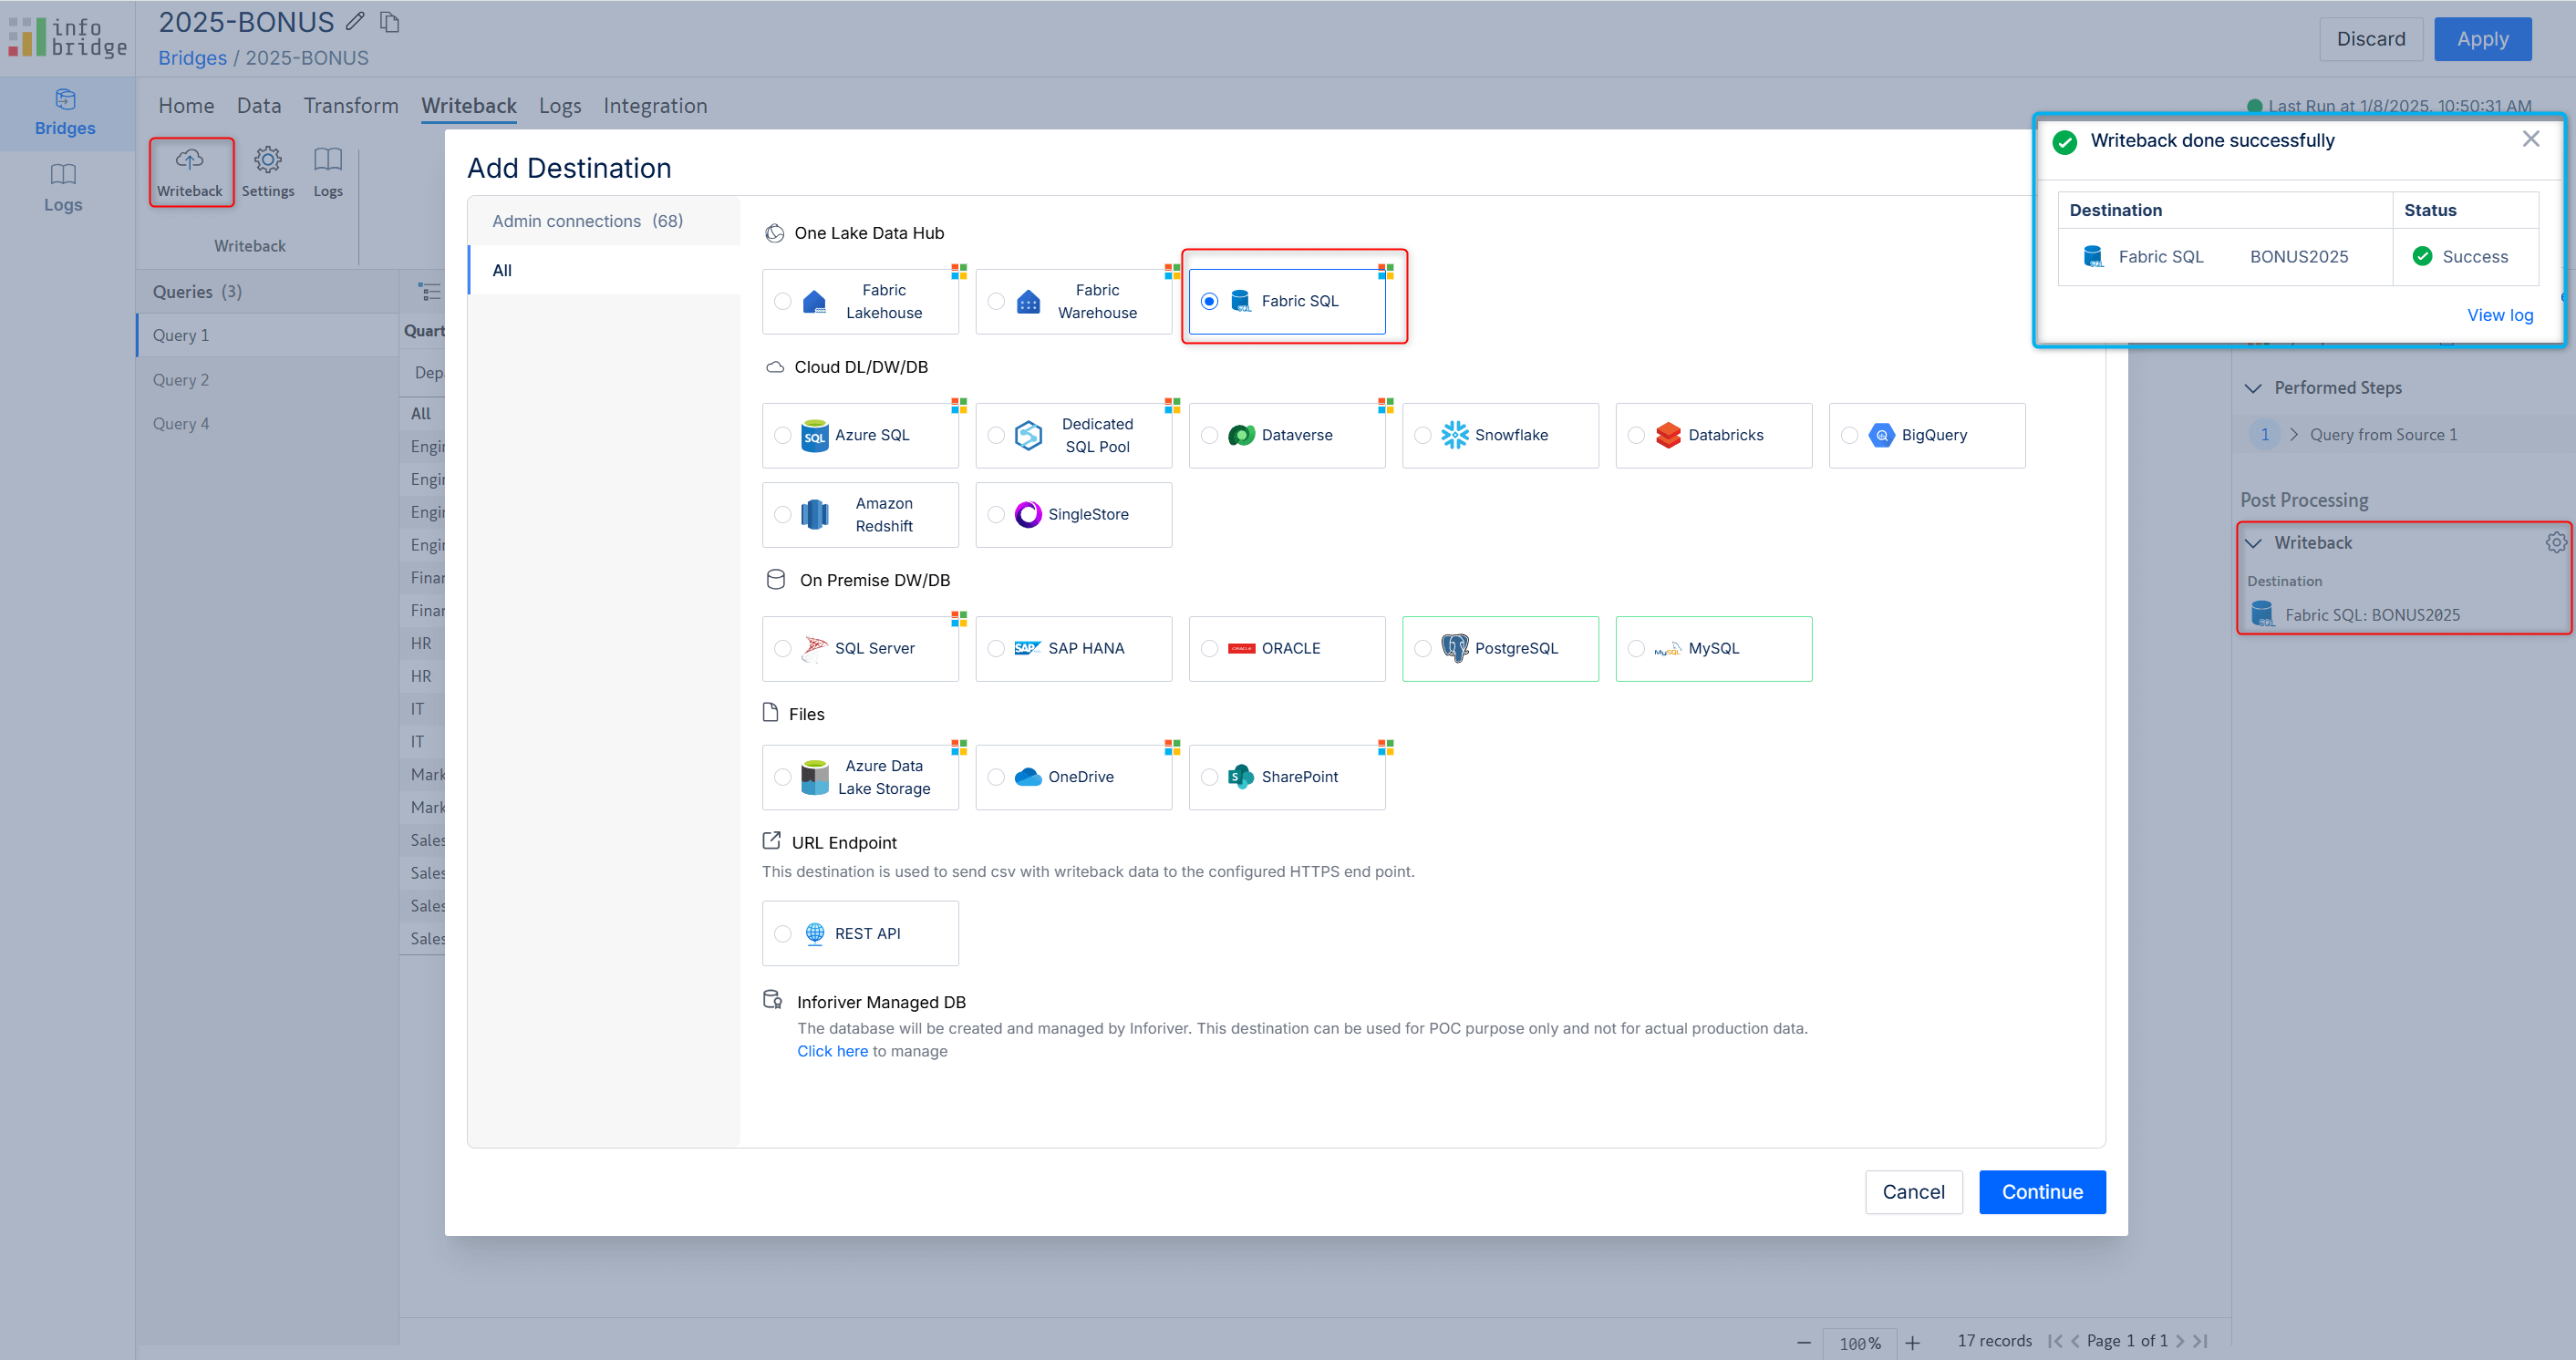
In the latest version, you’ll be able to configure and writeback to Fabric SQL destinations from Infobridge and Inforiver.
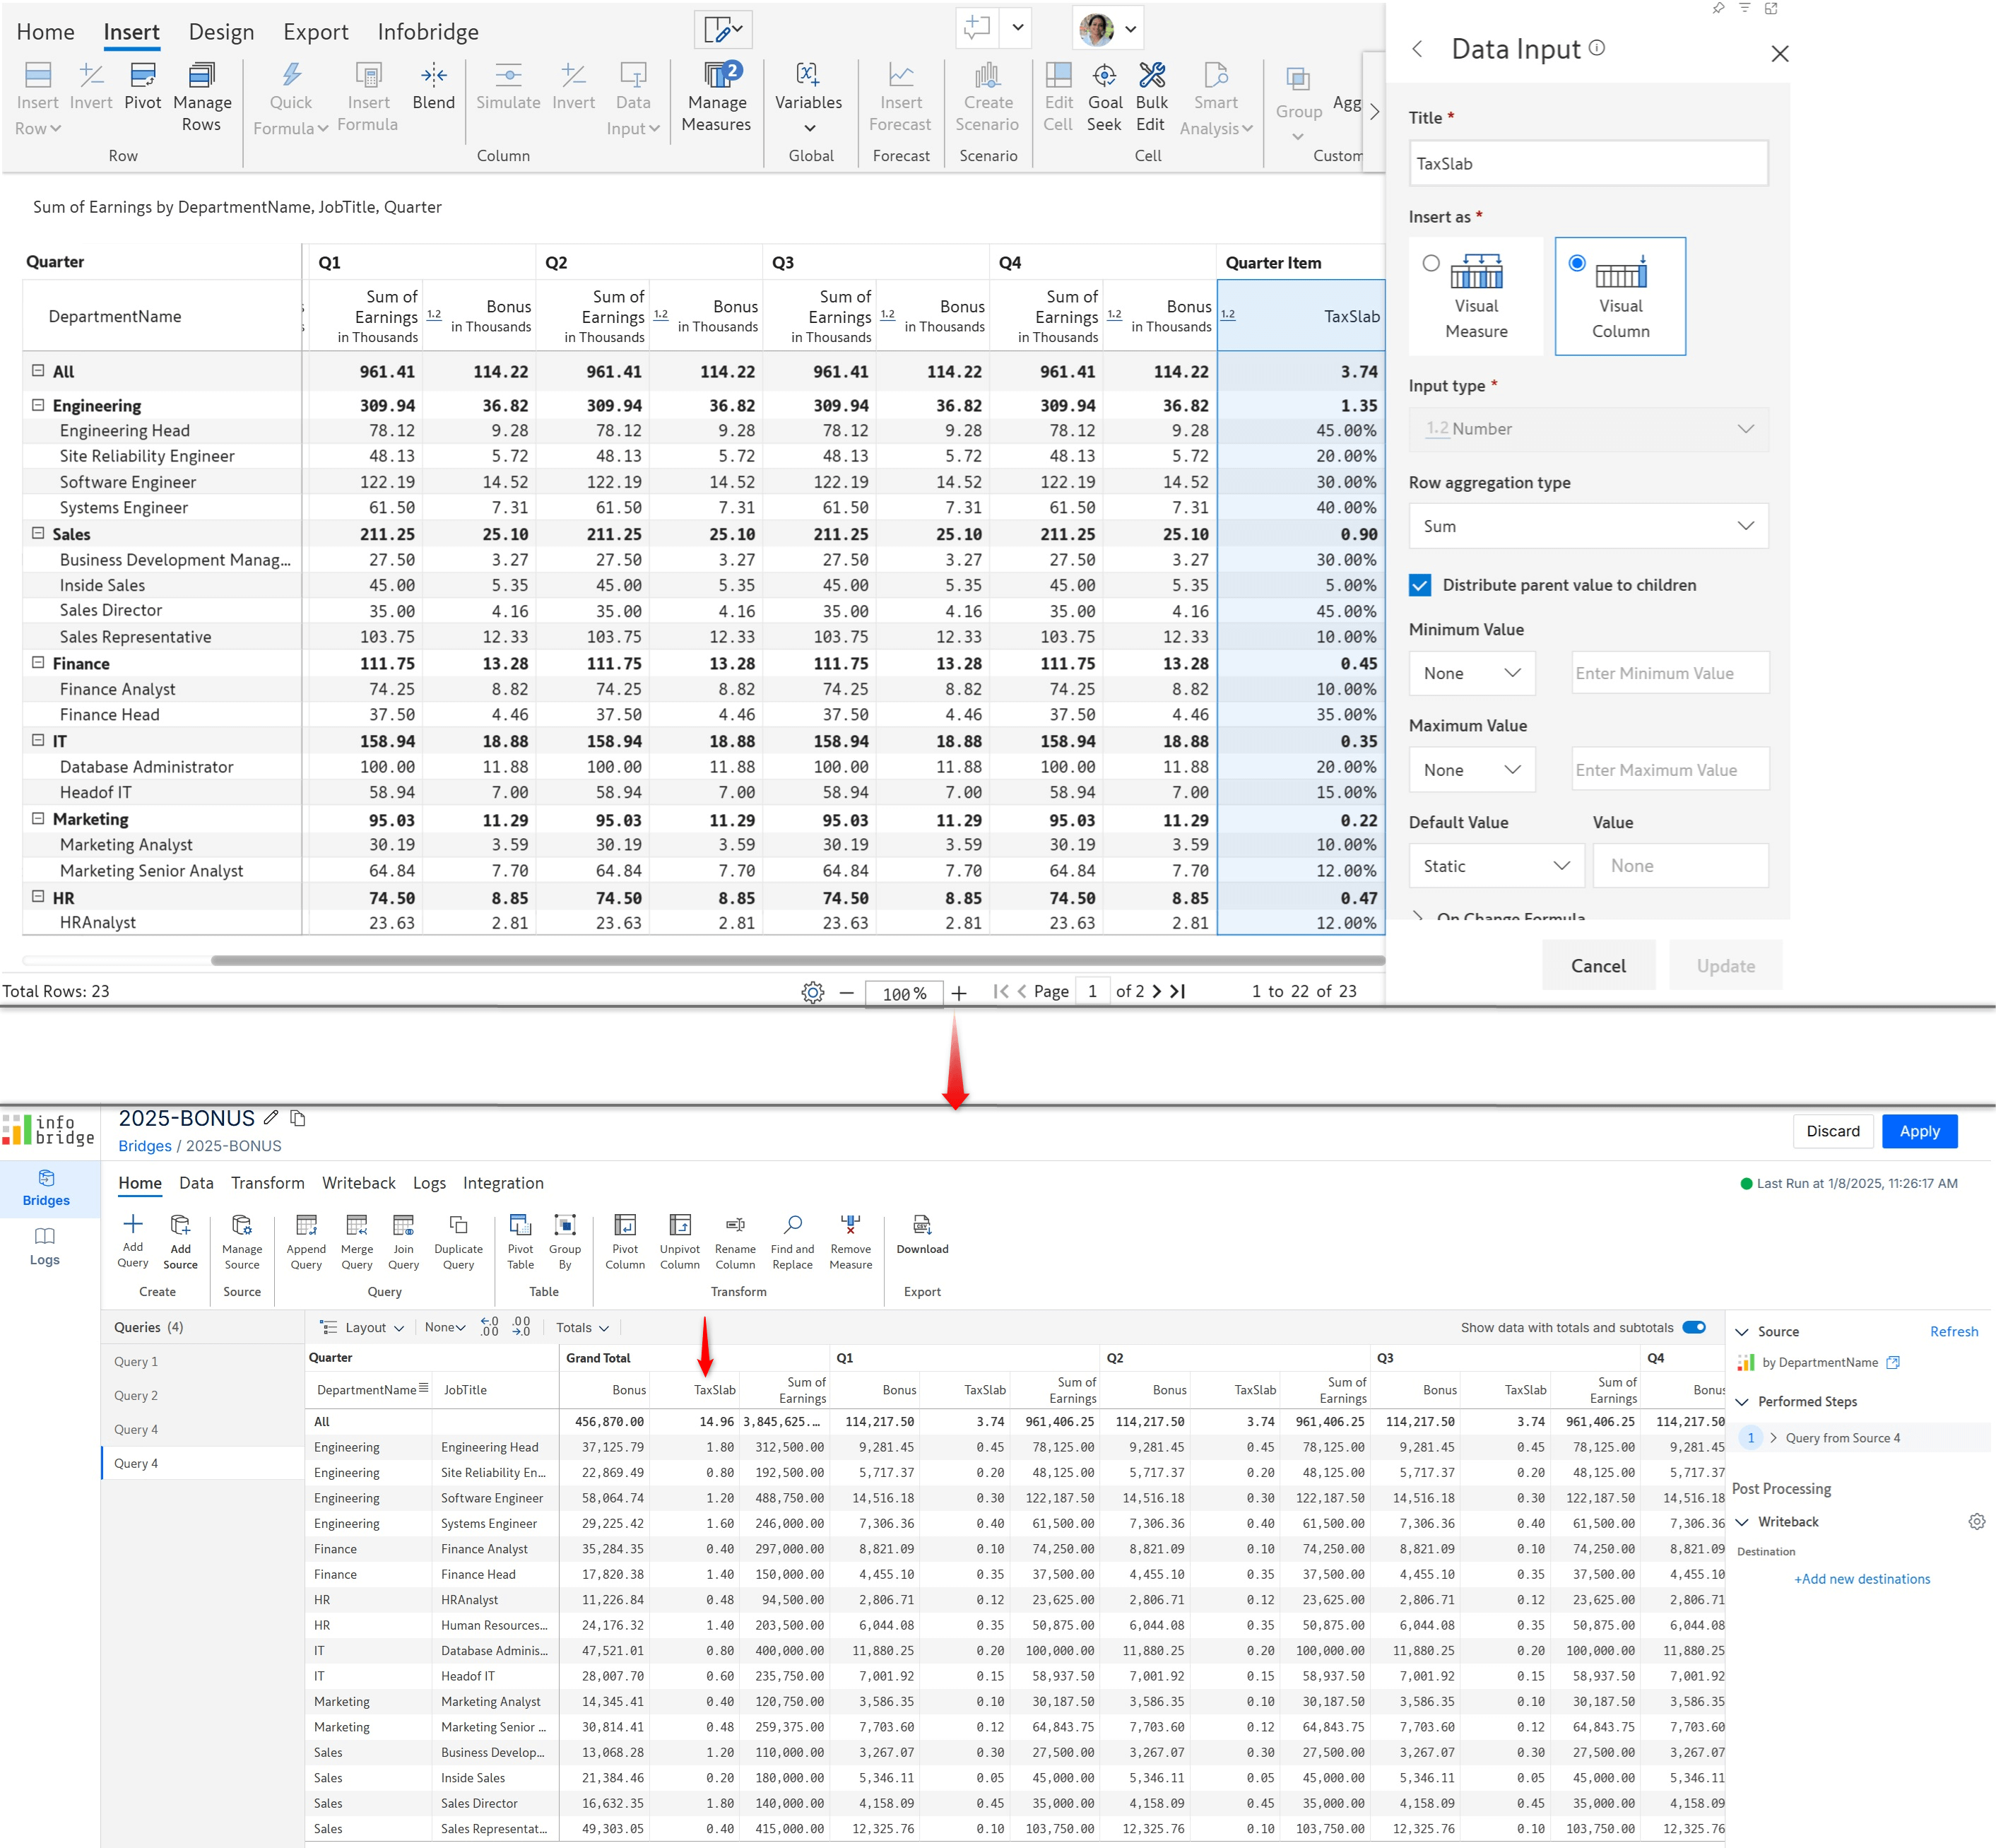
Inforiver reports frequently contain visual columns like tax rates or multiplier factors. Infobridge supports visual columns as well – you can integrate visual columns into your connected planning reports. The visual column will be treated as a visual measure within Infobridge, with the same values repeated for each column dimension category.
Inforiver’s built-in context awareness has been extended to Infobridge sources - enabling context-aware connected planning. Let’s look at a quick demonstration. Our bridge contains quarterly discounts that we need to integrate into our yearly profitability report.
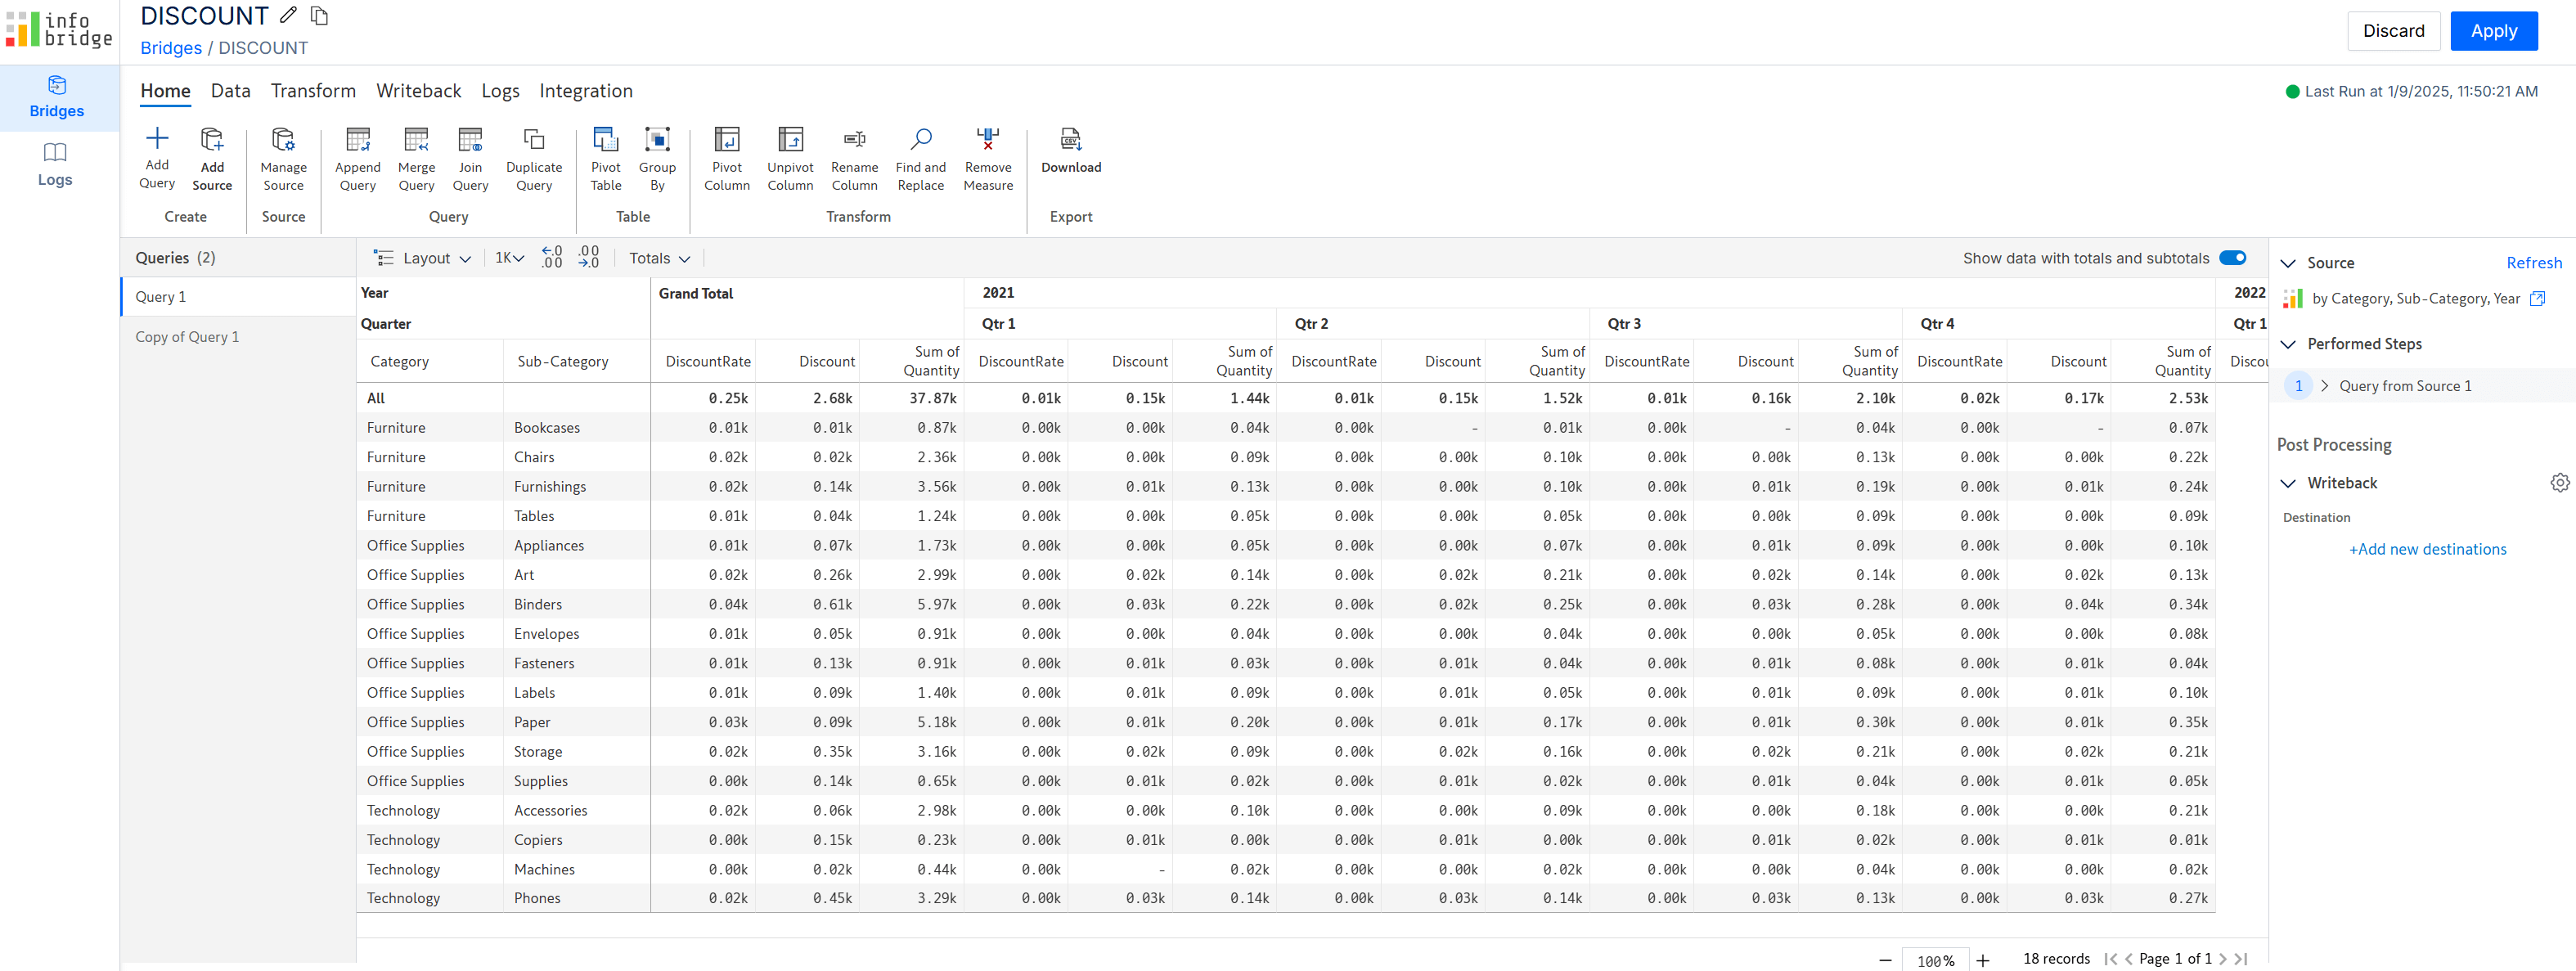
The target Yearly Profitability report contains data at year-level. Before integrating the discounts from Infobridge, let’s use Inforiver’s Super Filter visual to set up context awareness in the target. Learn more about the Super Filter here.
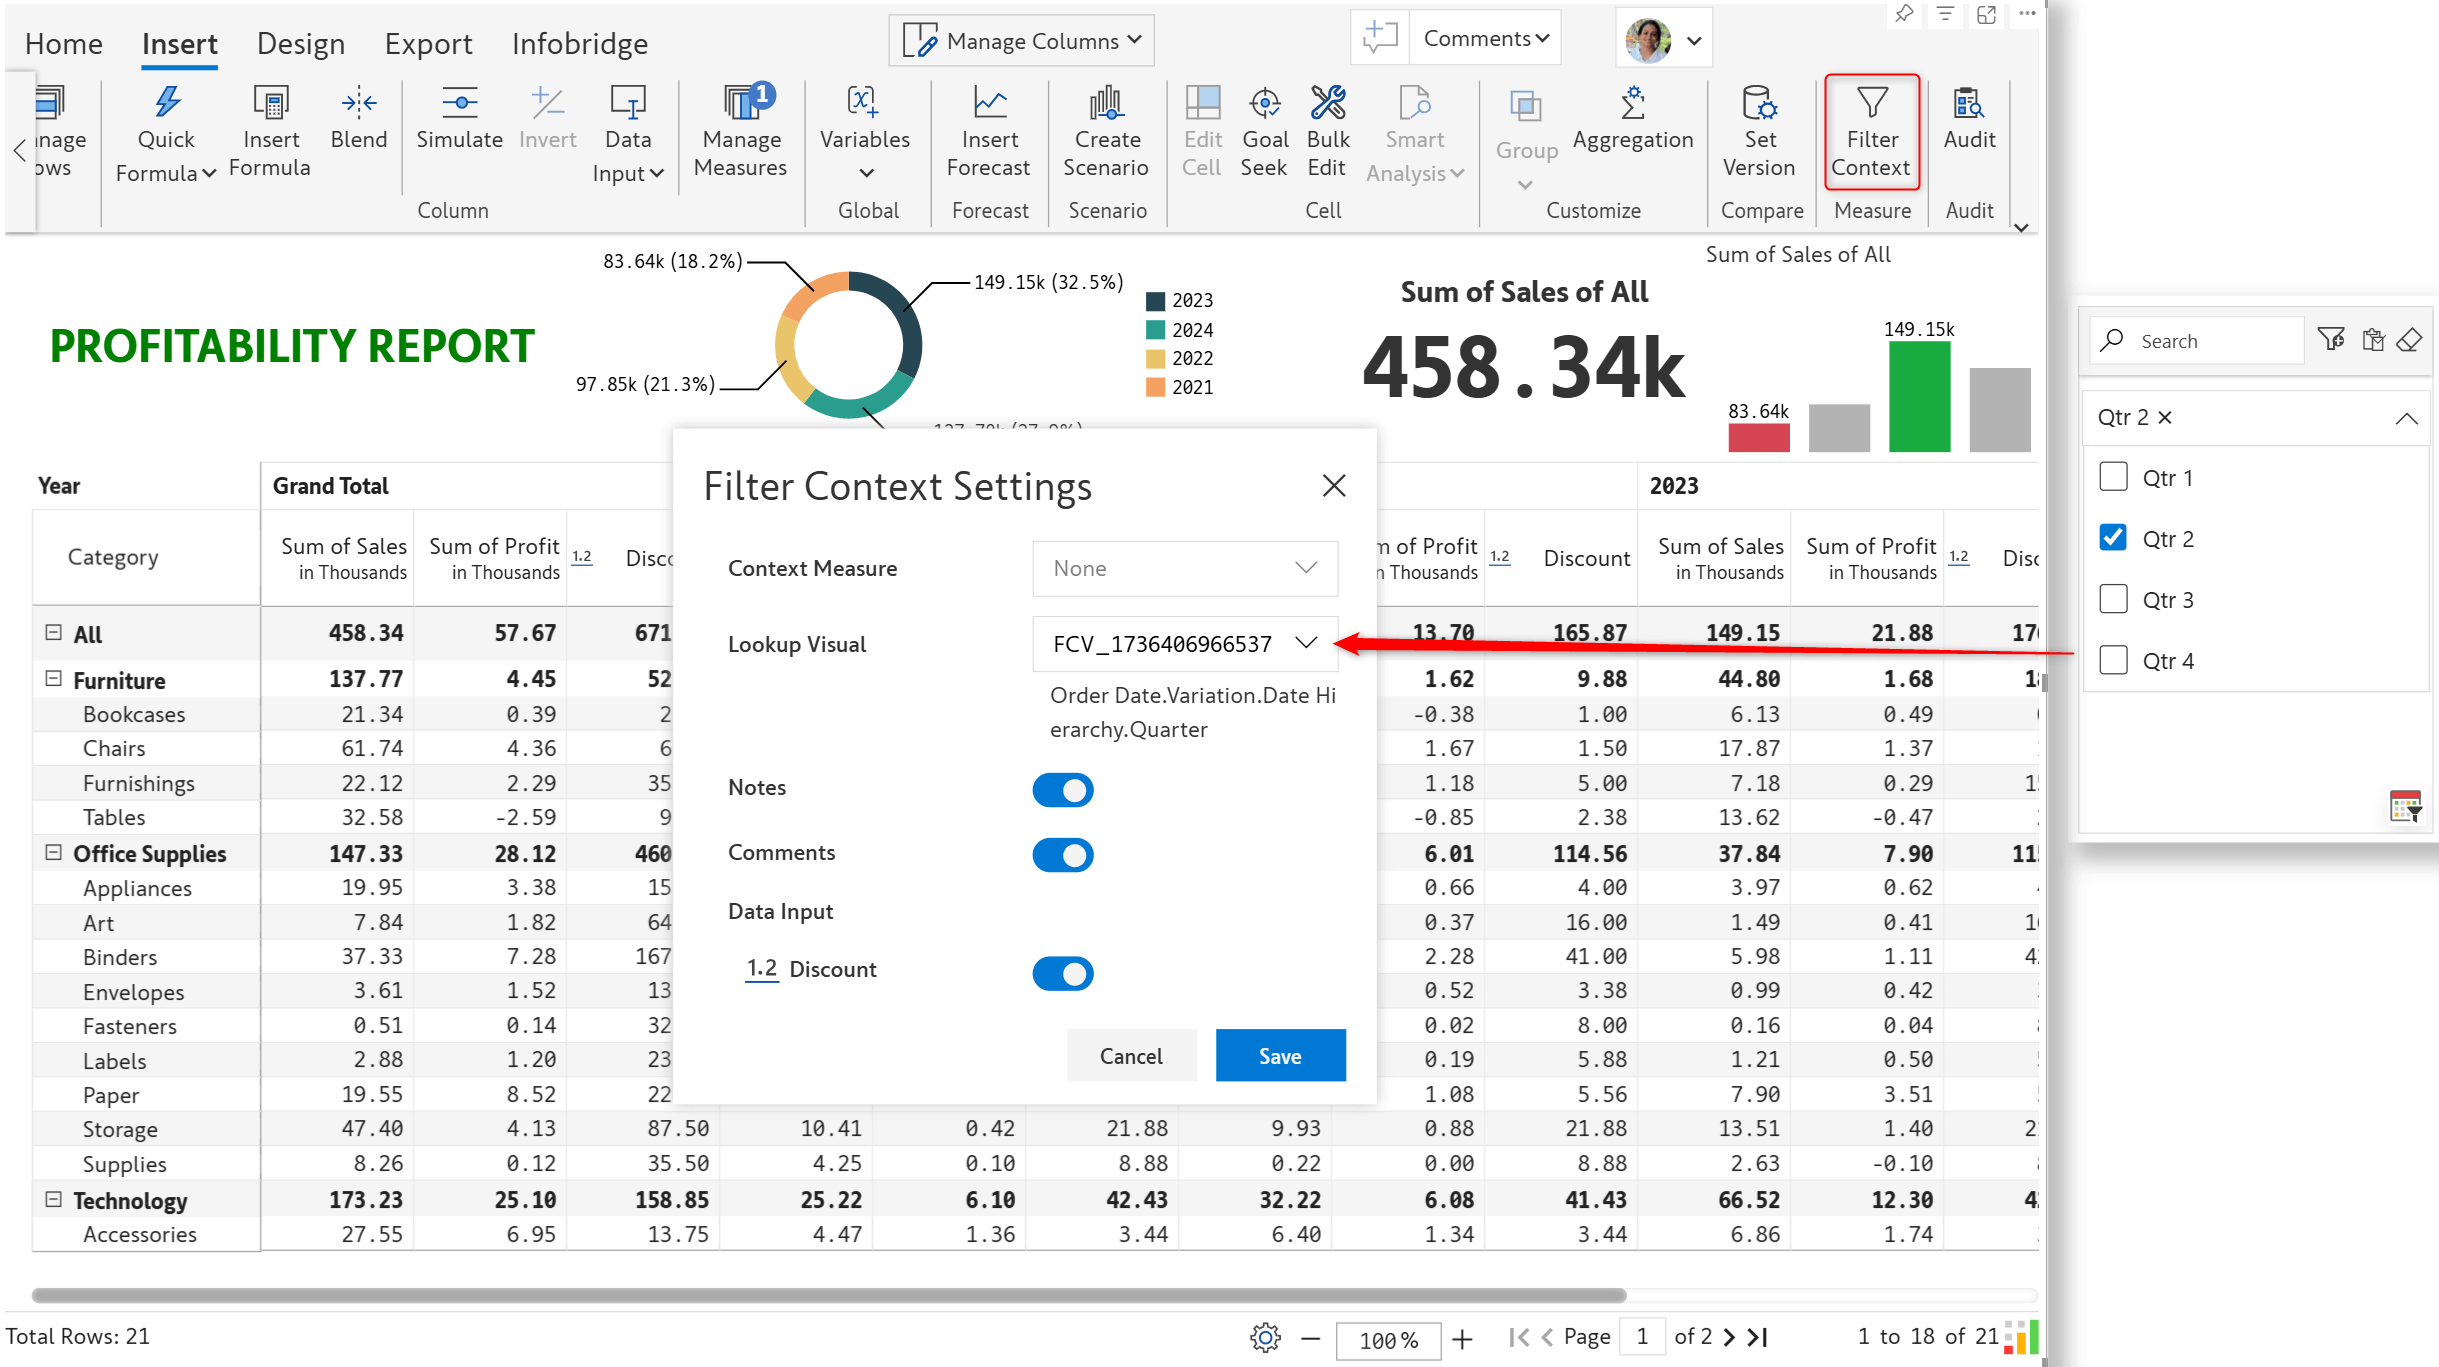
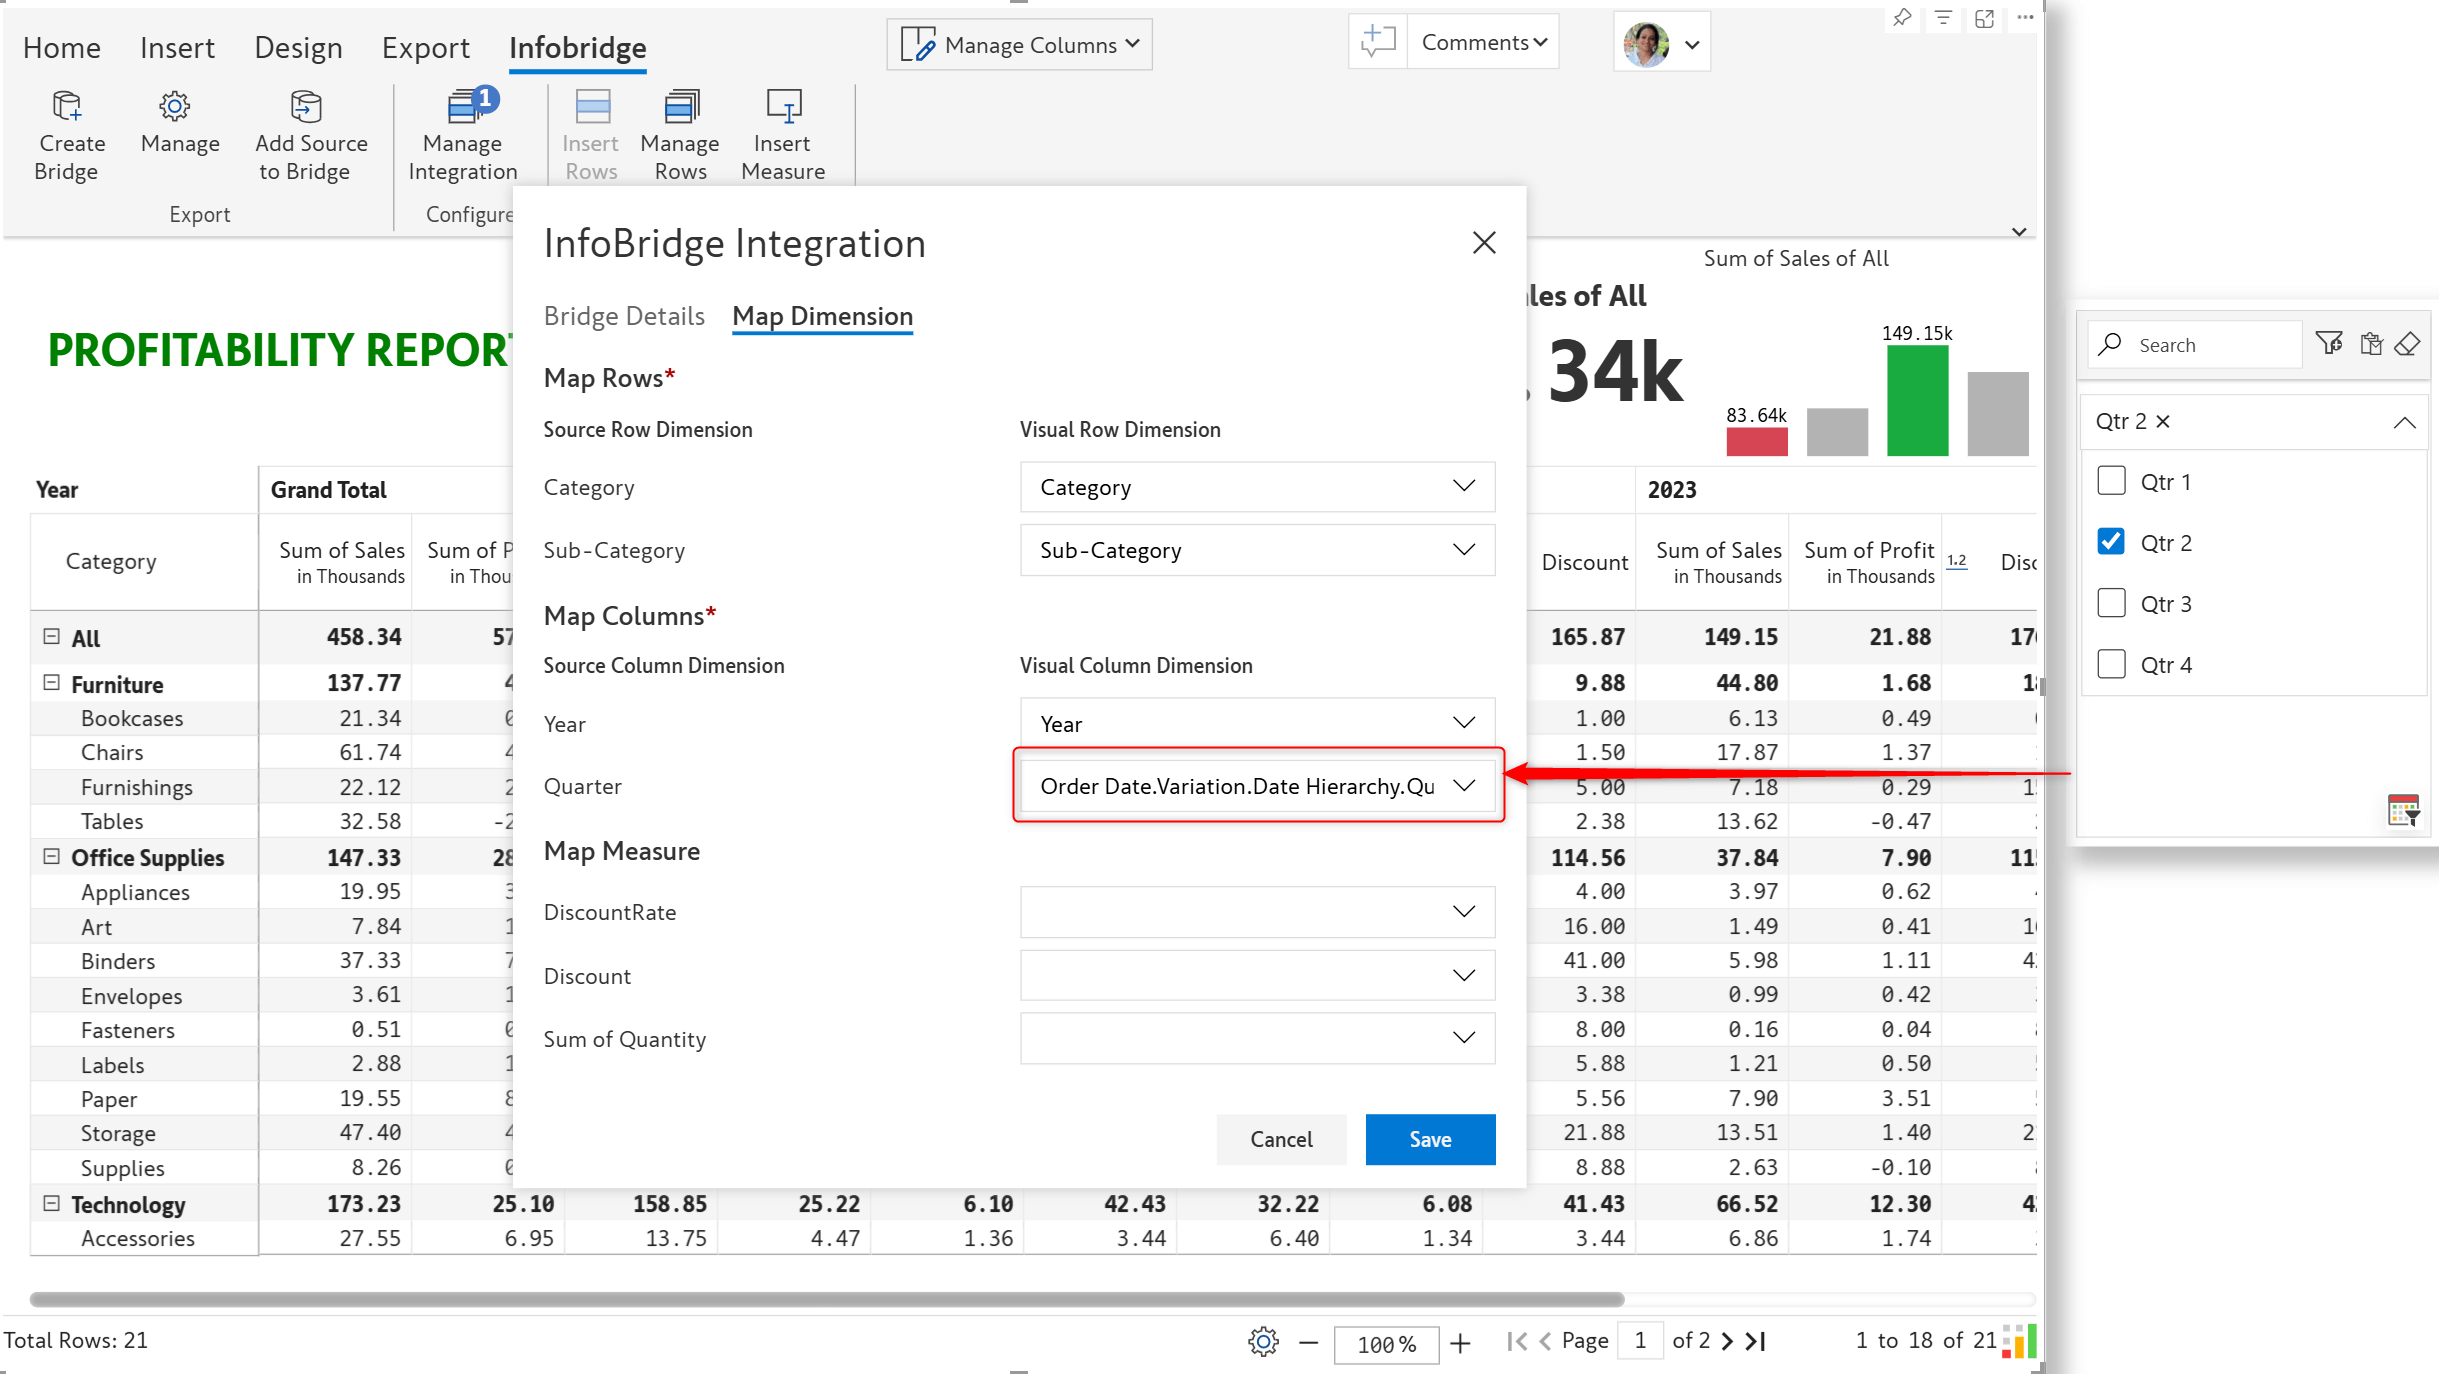
The target visual has data at a higher granularity, i.e. year-level and the source bridge has quarterly data. When we create an integration to the discount bridge, we need to map the quarter dimension to the filter context measure in the target profitability visual.
Notice how the Infobridge measure, Discount, also changes in response to slicer selections.
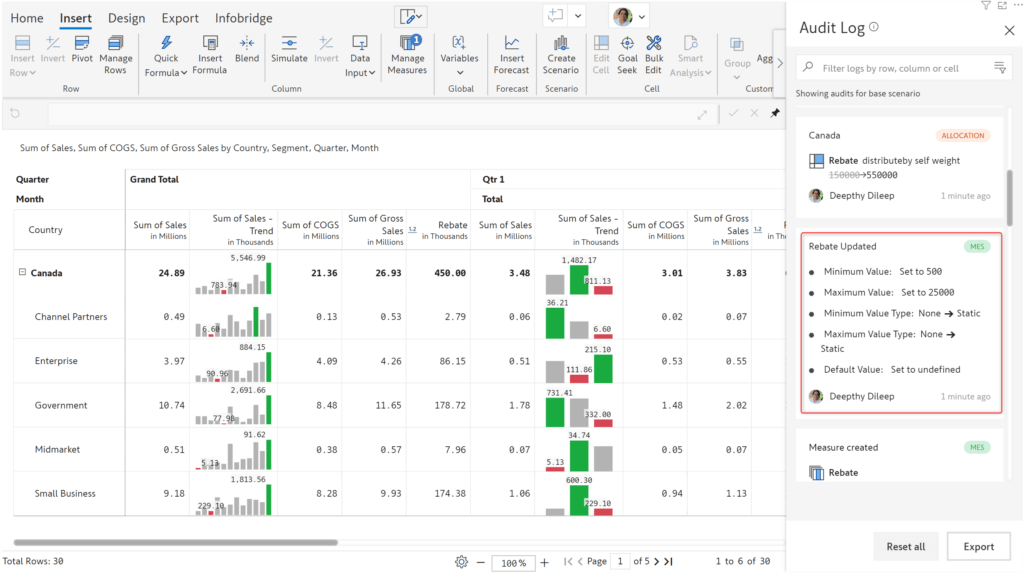
Inforiver’s audit log feature now captures a much higher level of information:
Normal distribution is widely used in financial reports and analysis for performance benchmarking, portfolio risk management, interest rate modeling, and other purposes. The latest version allows you to use normal and inverse distribution formulae.
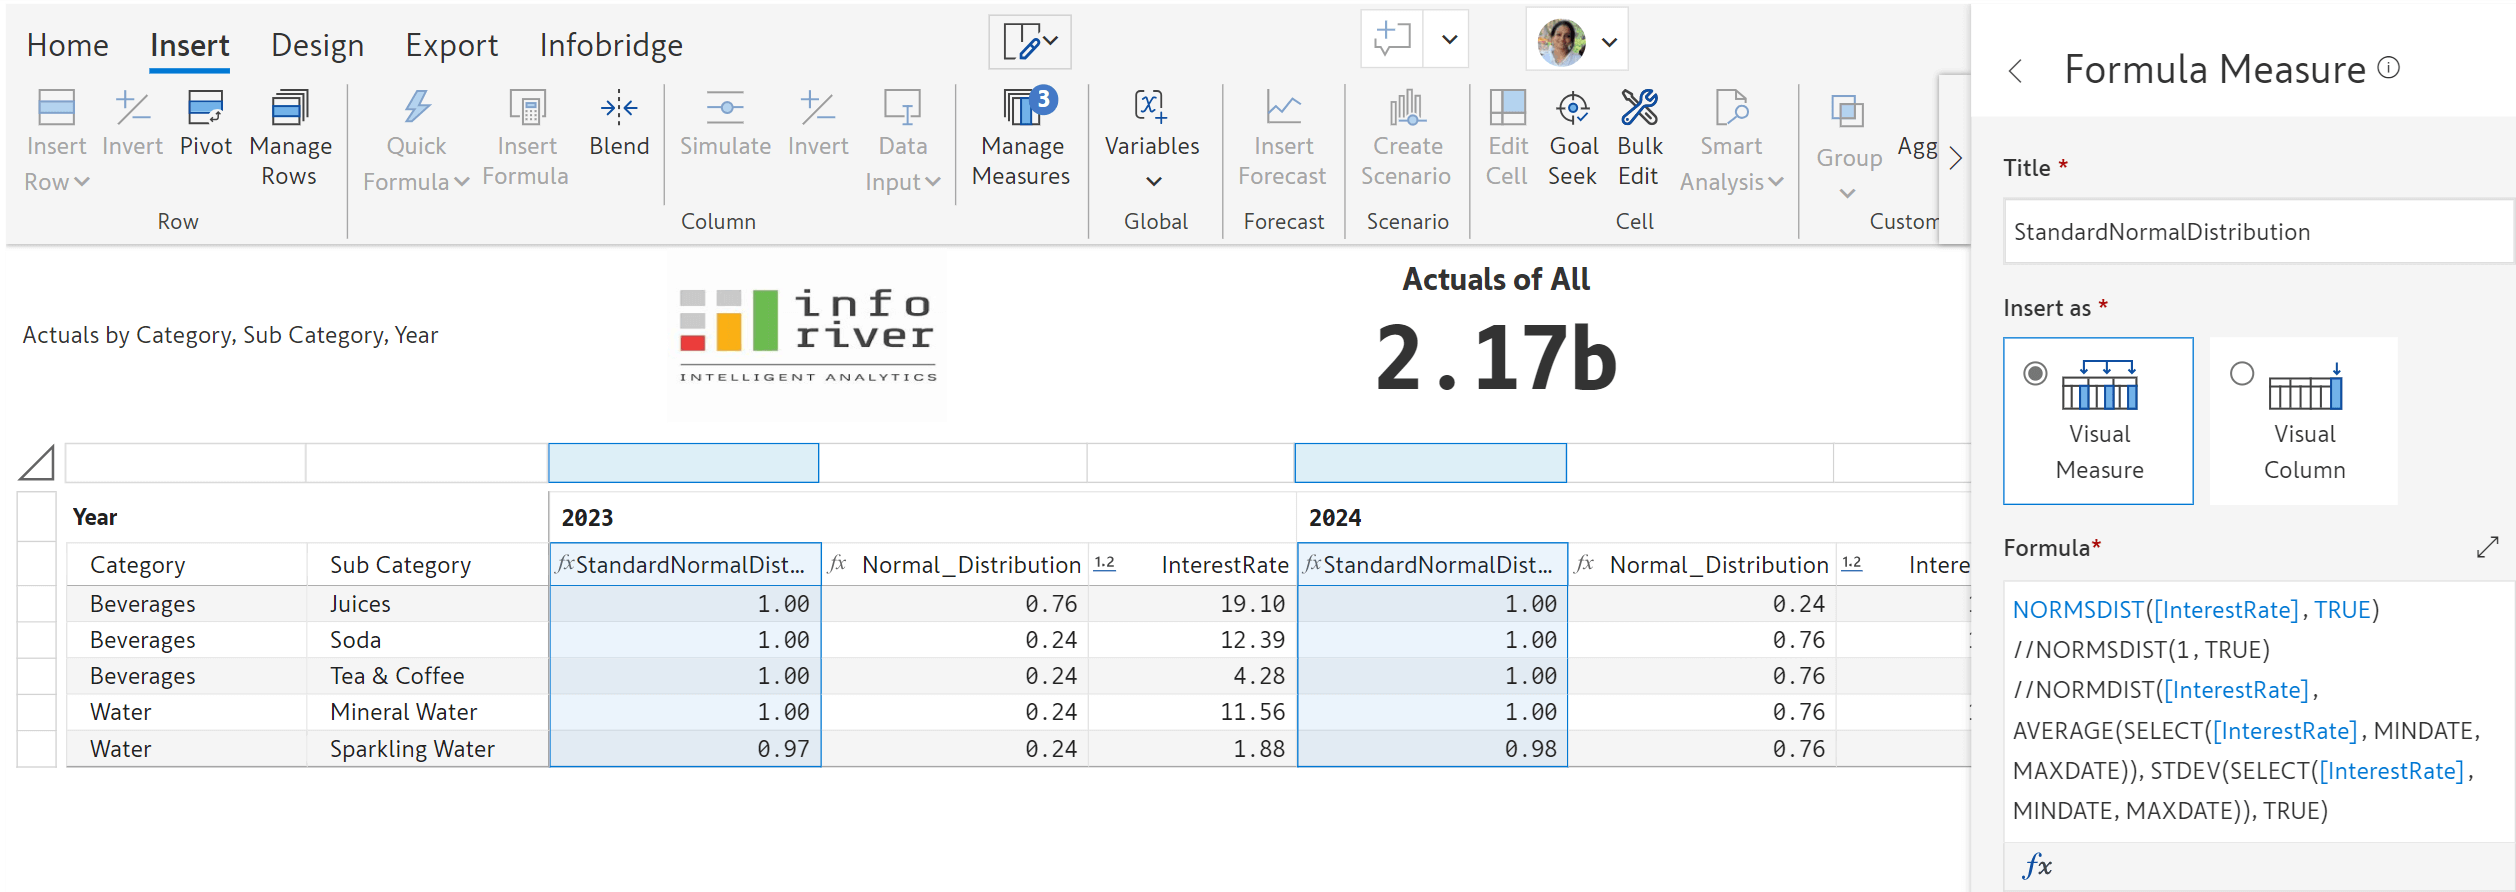
Supported formulae:
Infobridge, Inforiver, and Editable can now work together with client-side Web Application Firewalls (WAF) to stay secure. Learn more about WAF compatibility in Inforiver.
Significant performance optimizations will enable you to seamlessly distribute and allocate forecasts/data inputs for up to 1 million cells.
Report users will be able to lock and unlock cells in read view. They will not however be able to unlock cells that were locked by the report author.
Report authors can choose to give users access to certain display settings like ragged hierarchy, semantic formatting, and null/zero handling with scripts. When used with variables, users will be able to turn these settings on or off although they cannot directly access display settings.
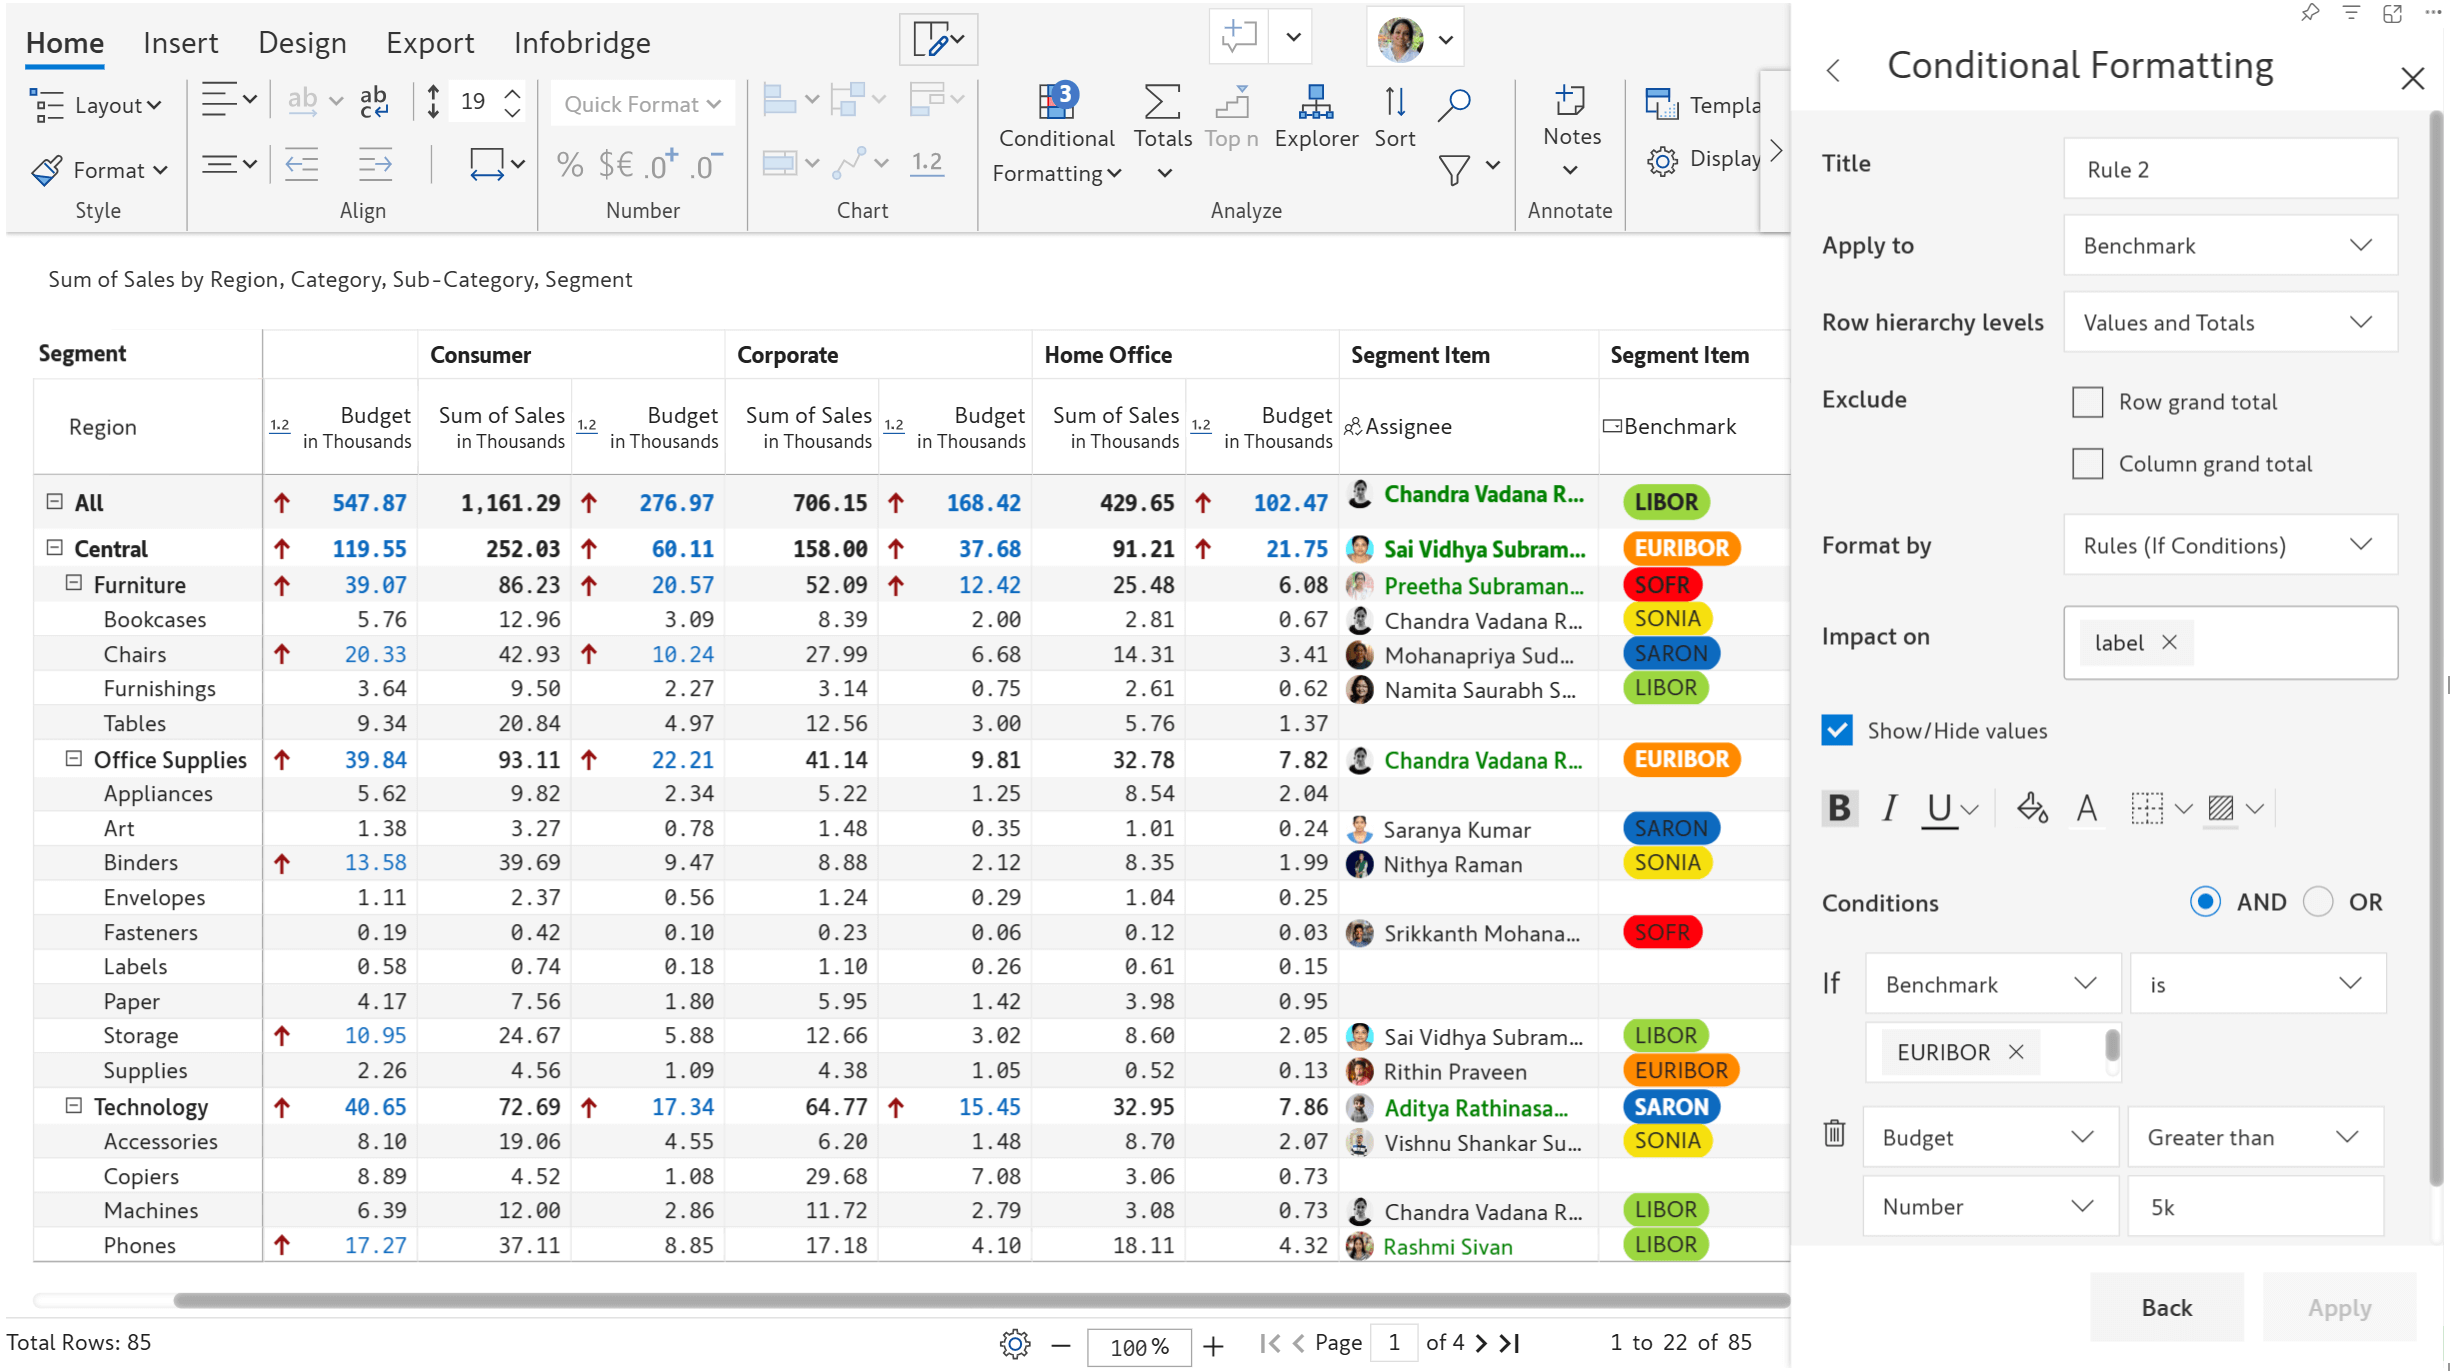
Highlight your data input fields like number, dropdown and person columns with conditional formatting. When users enter values, you can specify rules to automatically apply formatting when the rules are satisfied e.g. spotlight the cells when the budget entered exceeds a certain limit.
Learn more and get started with Inforiver
To learn more about the latest from Inforiver and why we are garnering recognition from industry experts, check out our newest brochure.
Inforiver and all our planning and analytics products continue to be updated to provide a diverse range of users with optimal performance. With continual improvements and innovations planned, we welcome your feedback.
Visit the Inforiver Community to share your ideas, vote on others’ submissions, and interact with other users.
If you’re ready to level up your planning, reporting, and analytics, try it for free today.

Inforiver helps enterprises consolidate planning, reporting & analytics on a single platform (Power BI). The no-code, self-service award-winning platform has been recognized as the industry’s best and is adopted by many Fortune 100 firms.
Inforiver is a product of Lumel, the #1 Power BI AppSource Partner. The firm serves over 3,000 customers worldwide through its portfolio of products offered under the brands Inforiver, EDITable, ValQ, and xViz.