
Upcoming webinar on 'Inforiver Charts : The fastest way to deliver stories in Power BI', Aug 29th , Monday, 10.30 AM CST. Register Now
Upcoming webinar on 'Inforiver Charts : The fastest way to deliver stories in Power BI', Aug 29th , Monday, 10.30 AM CST. Register Now
Inforiver continuously enhances features and capabilities to provide users with powerful tools that help illuminate their data. We’re excited to share our newest 3.5.2 release, loaded with highly requested features and performance improvements. Inforiver remains the ultimate solution for advanced reporting, writeback functionalities, analytics, and data visualizations.
Infobridge, our innovative add-on to Inforiver for real-time transformation, collaboration, and data consolidation, now supports text and person measures, making it even more powerful. We’ve also added a handy LOOKUP function that can fetch values from your bridges.
Other key features in this release include:
Let’s explore them:
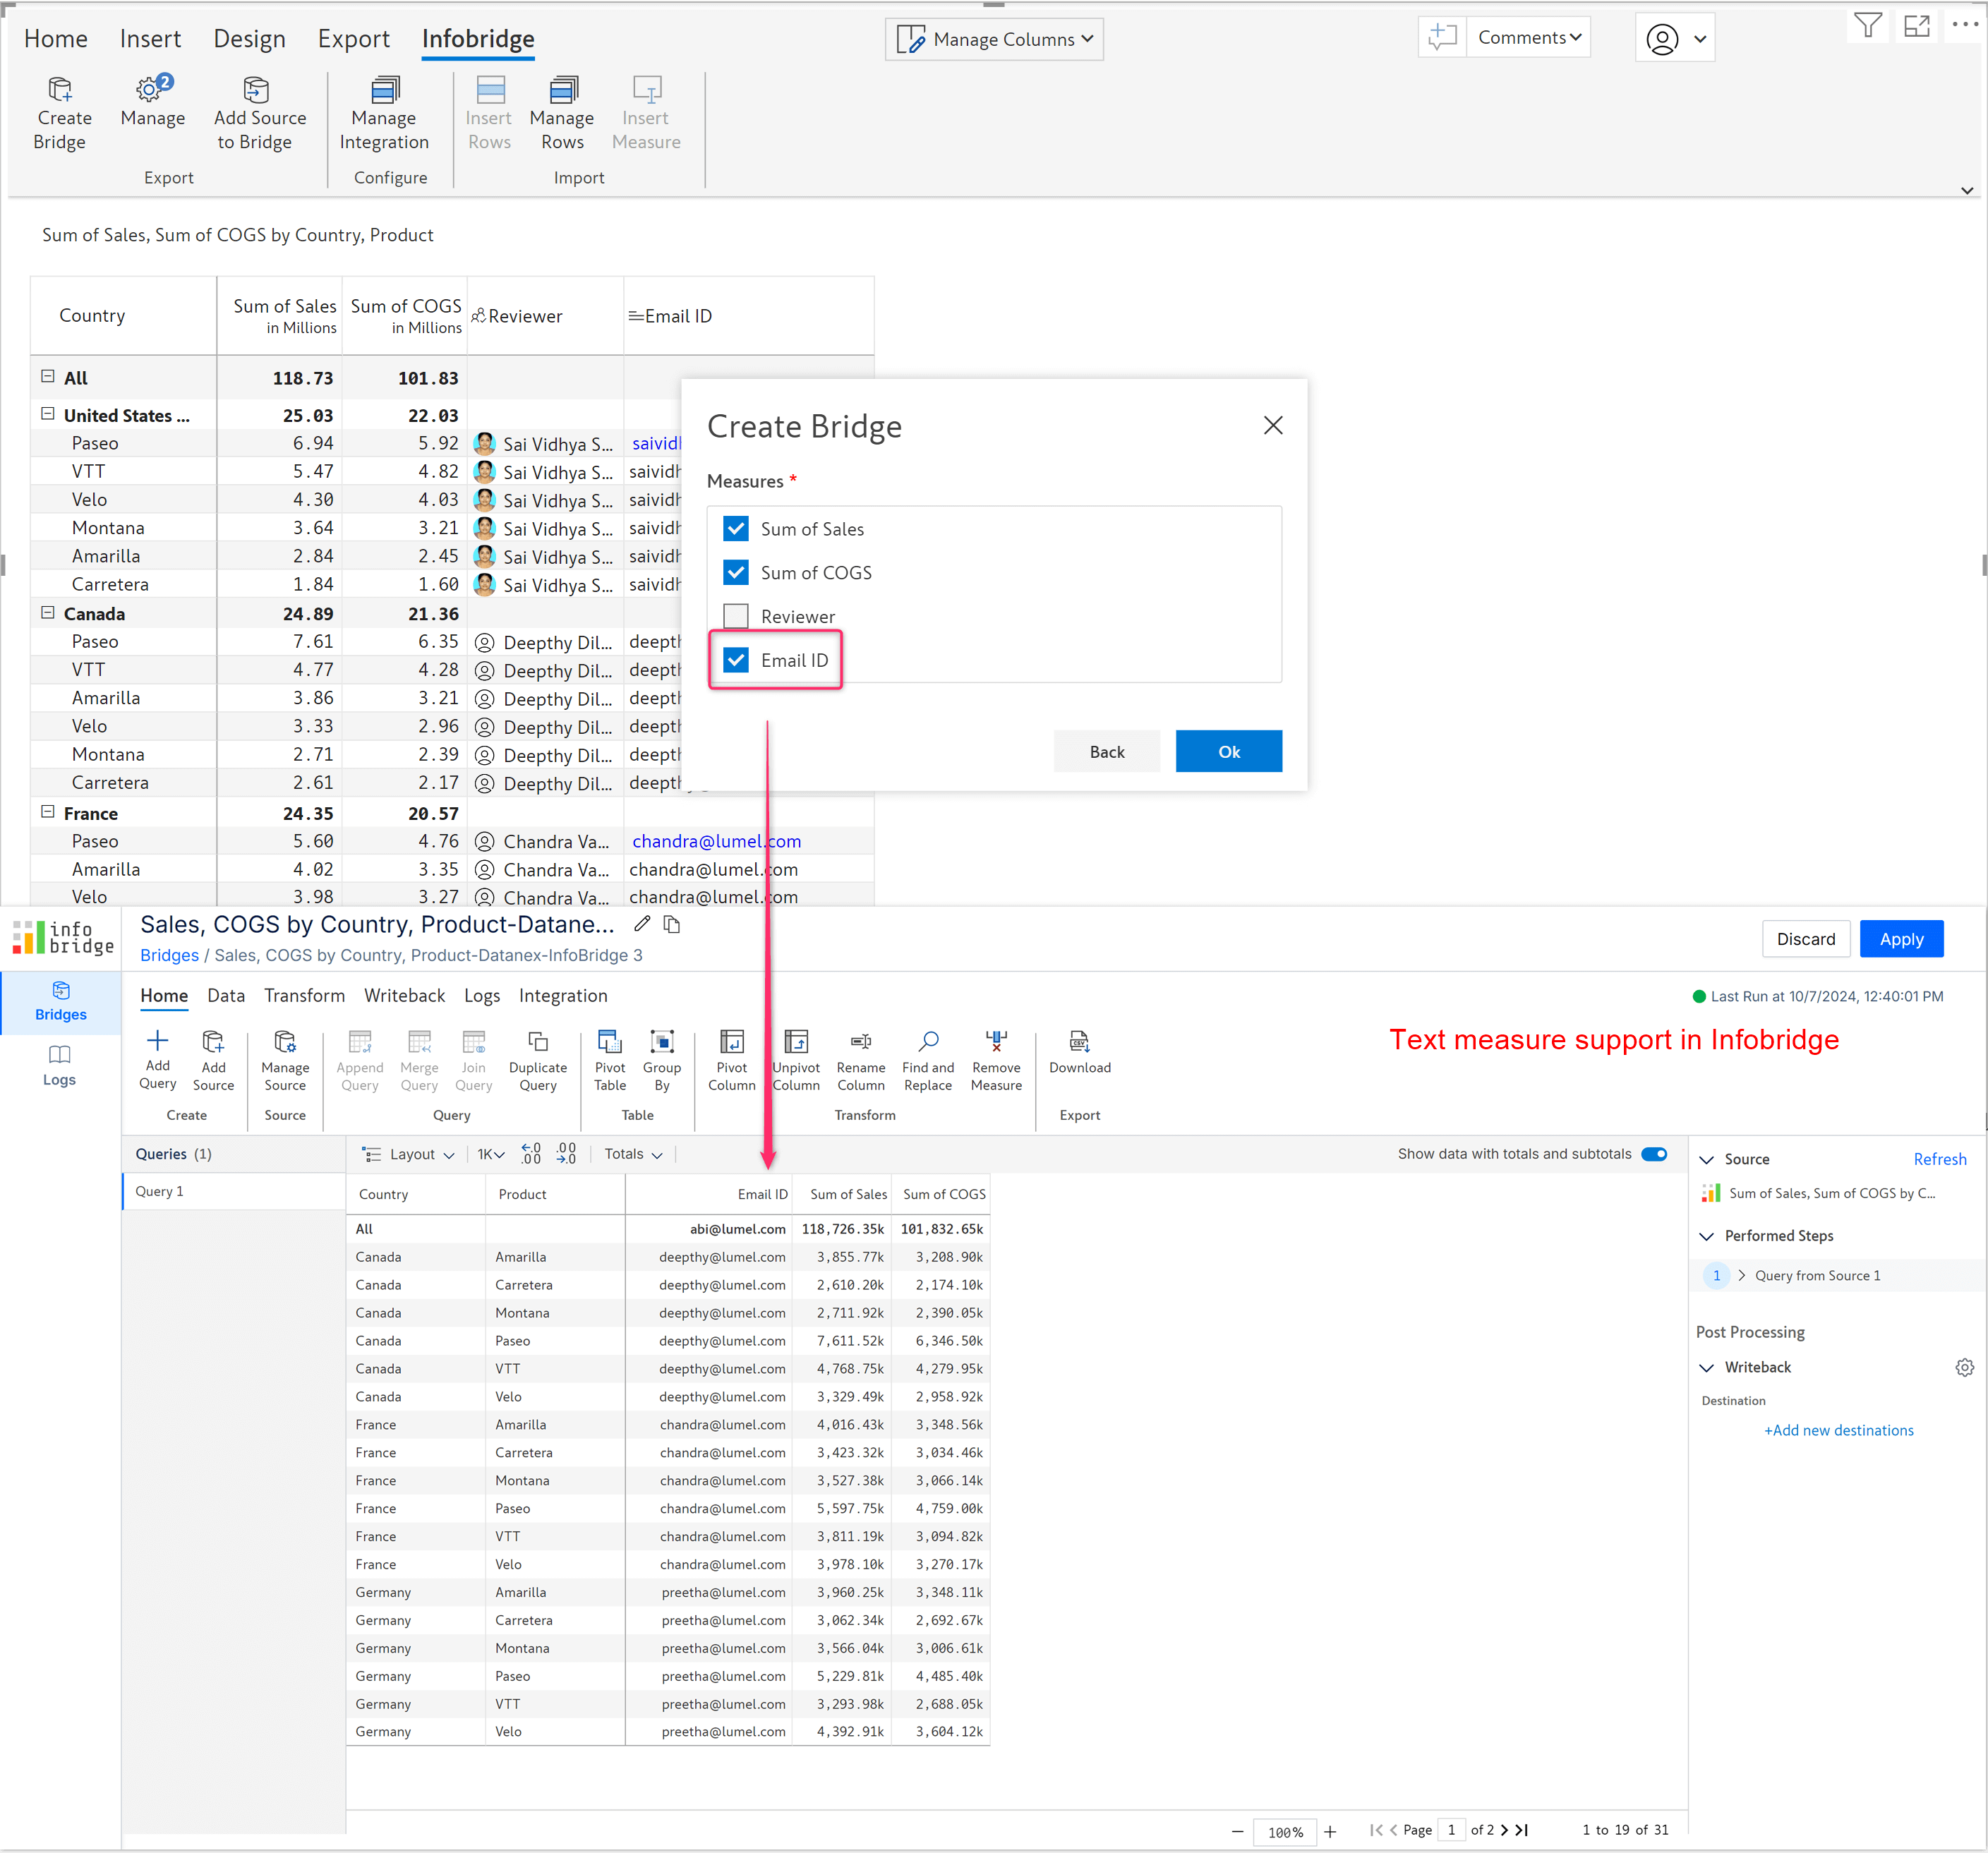
Infobridge can now support text measures, which means you can live stream text data between Inforiver visuals. Consider the example below, where the text measure containing the email IDs is selected to be imported into a bridge and consumed in another visual as inserted measures.
Importing text measure to a bridge:
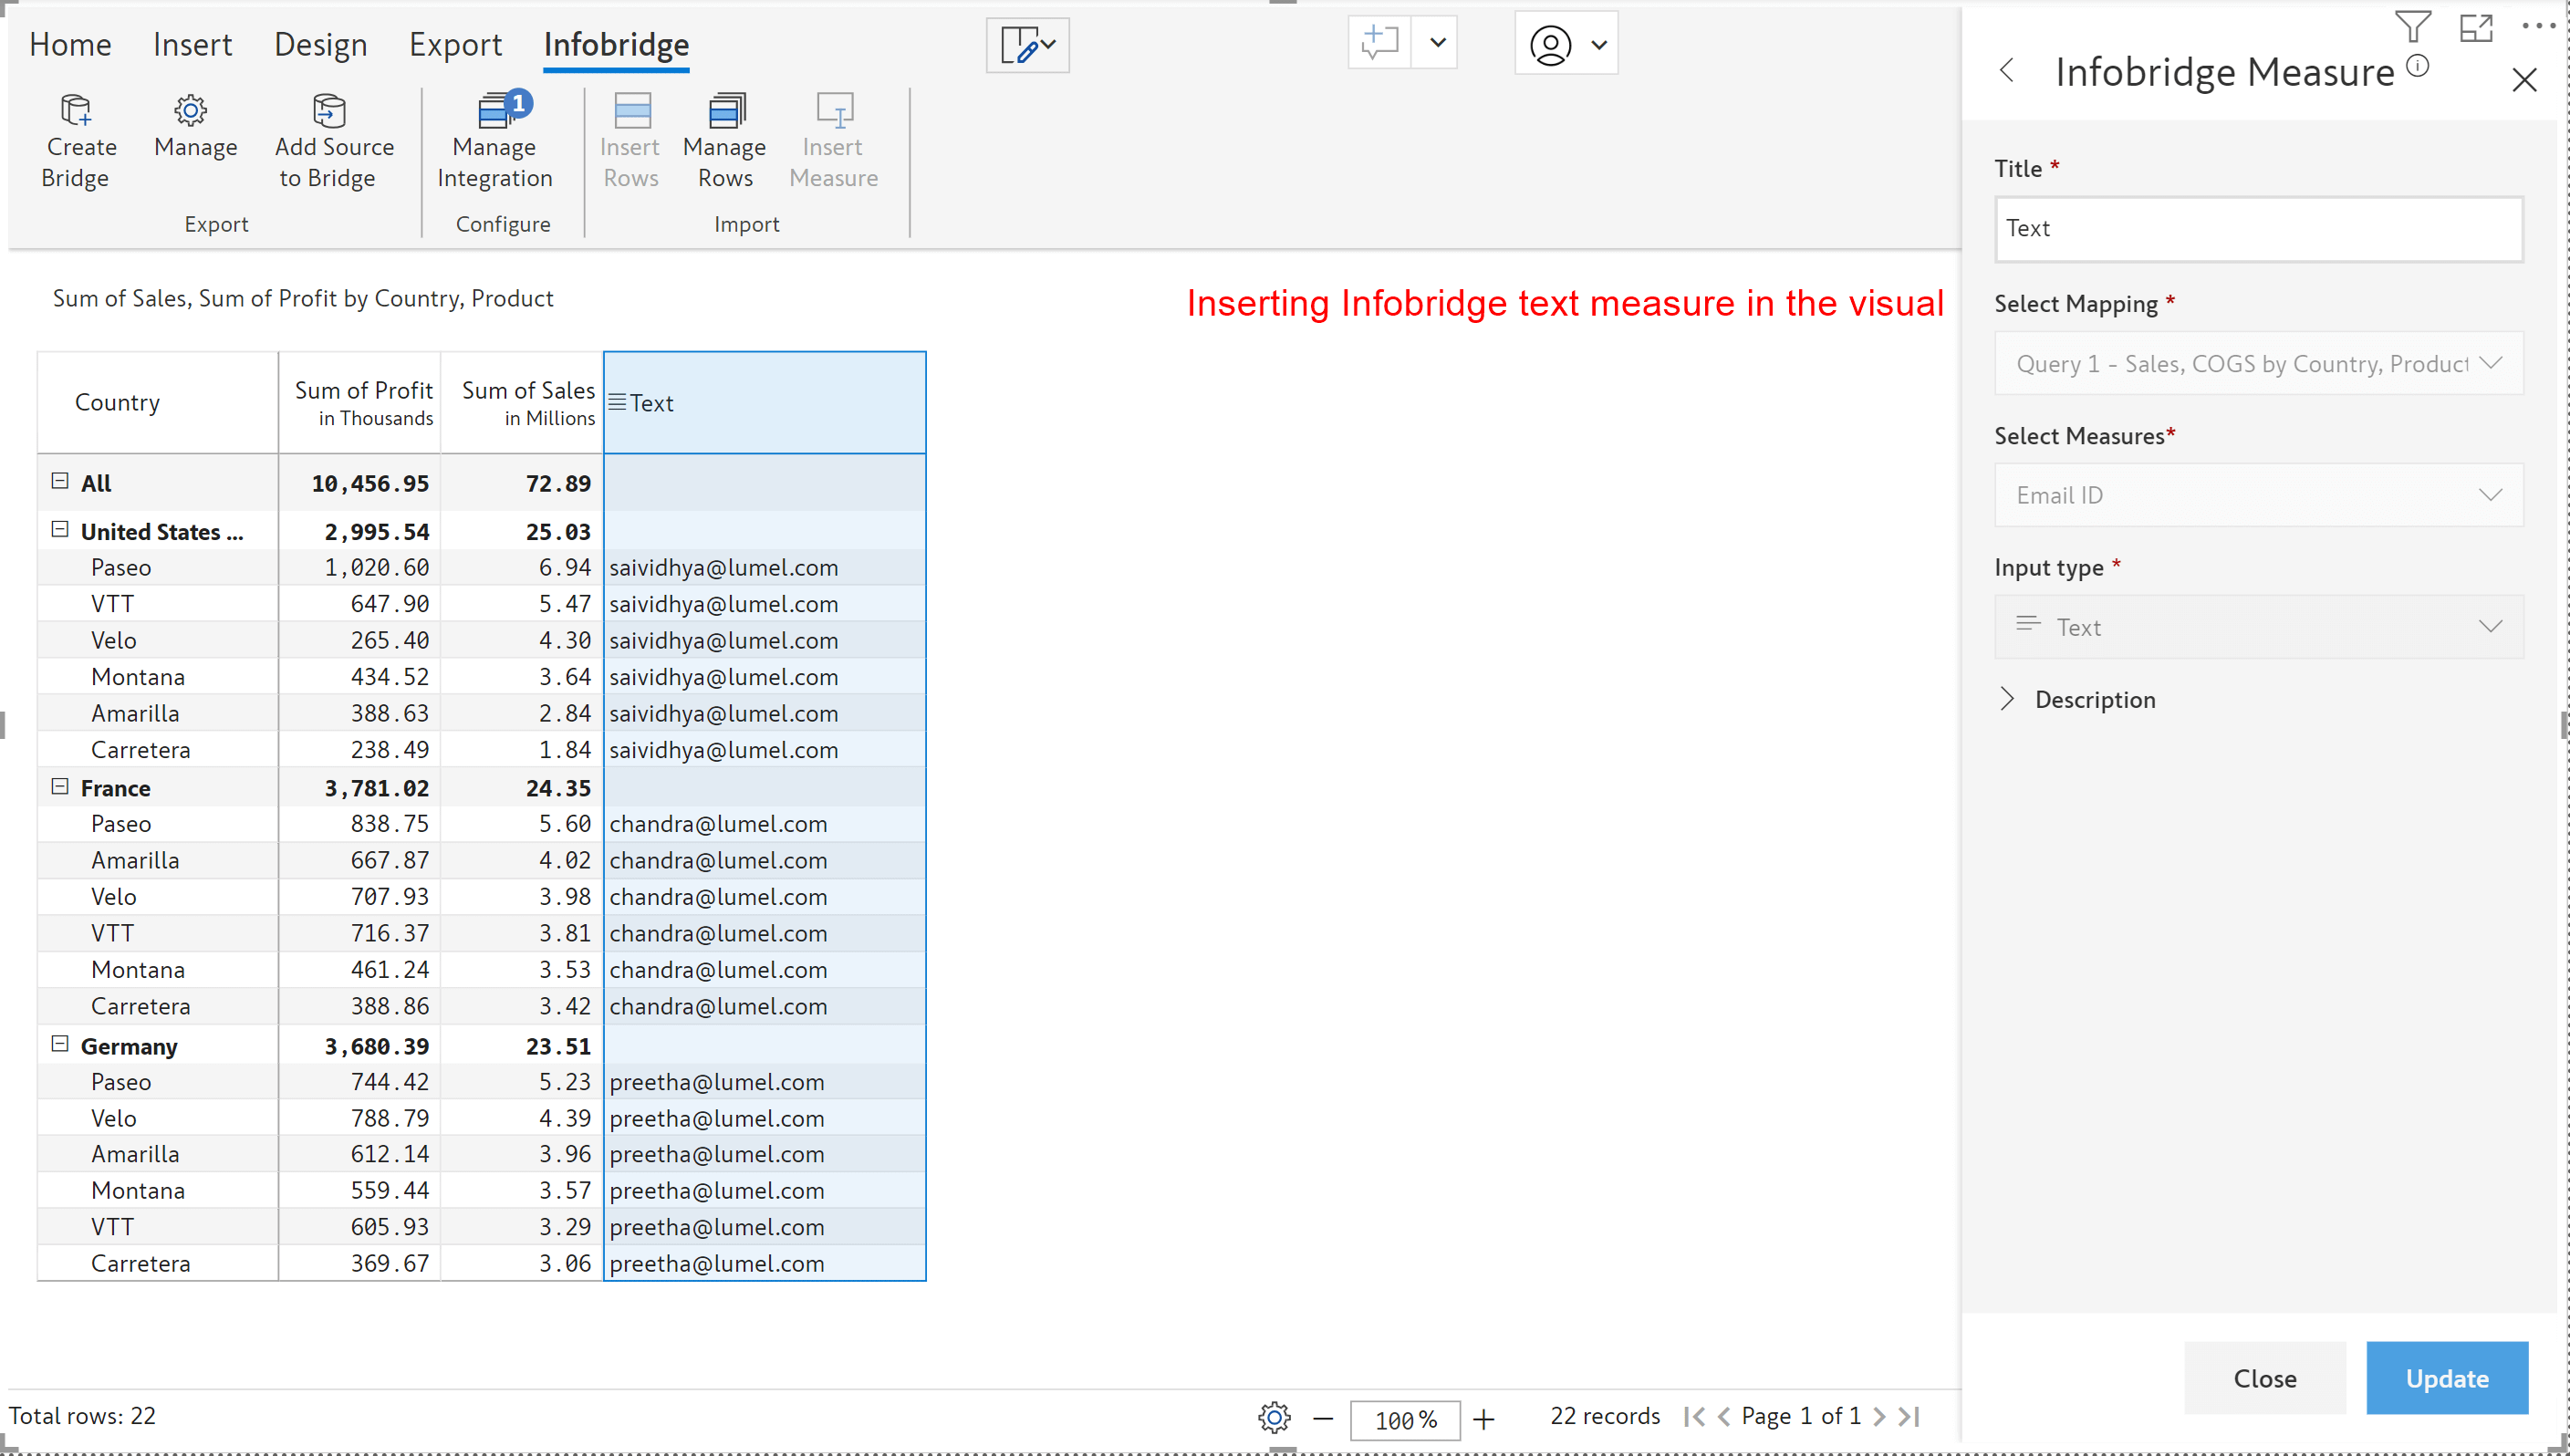
Adding text measure from the bridge:
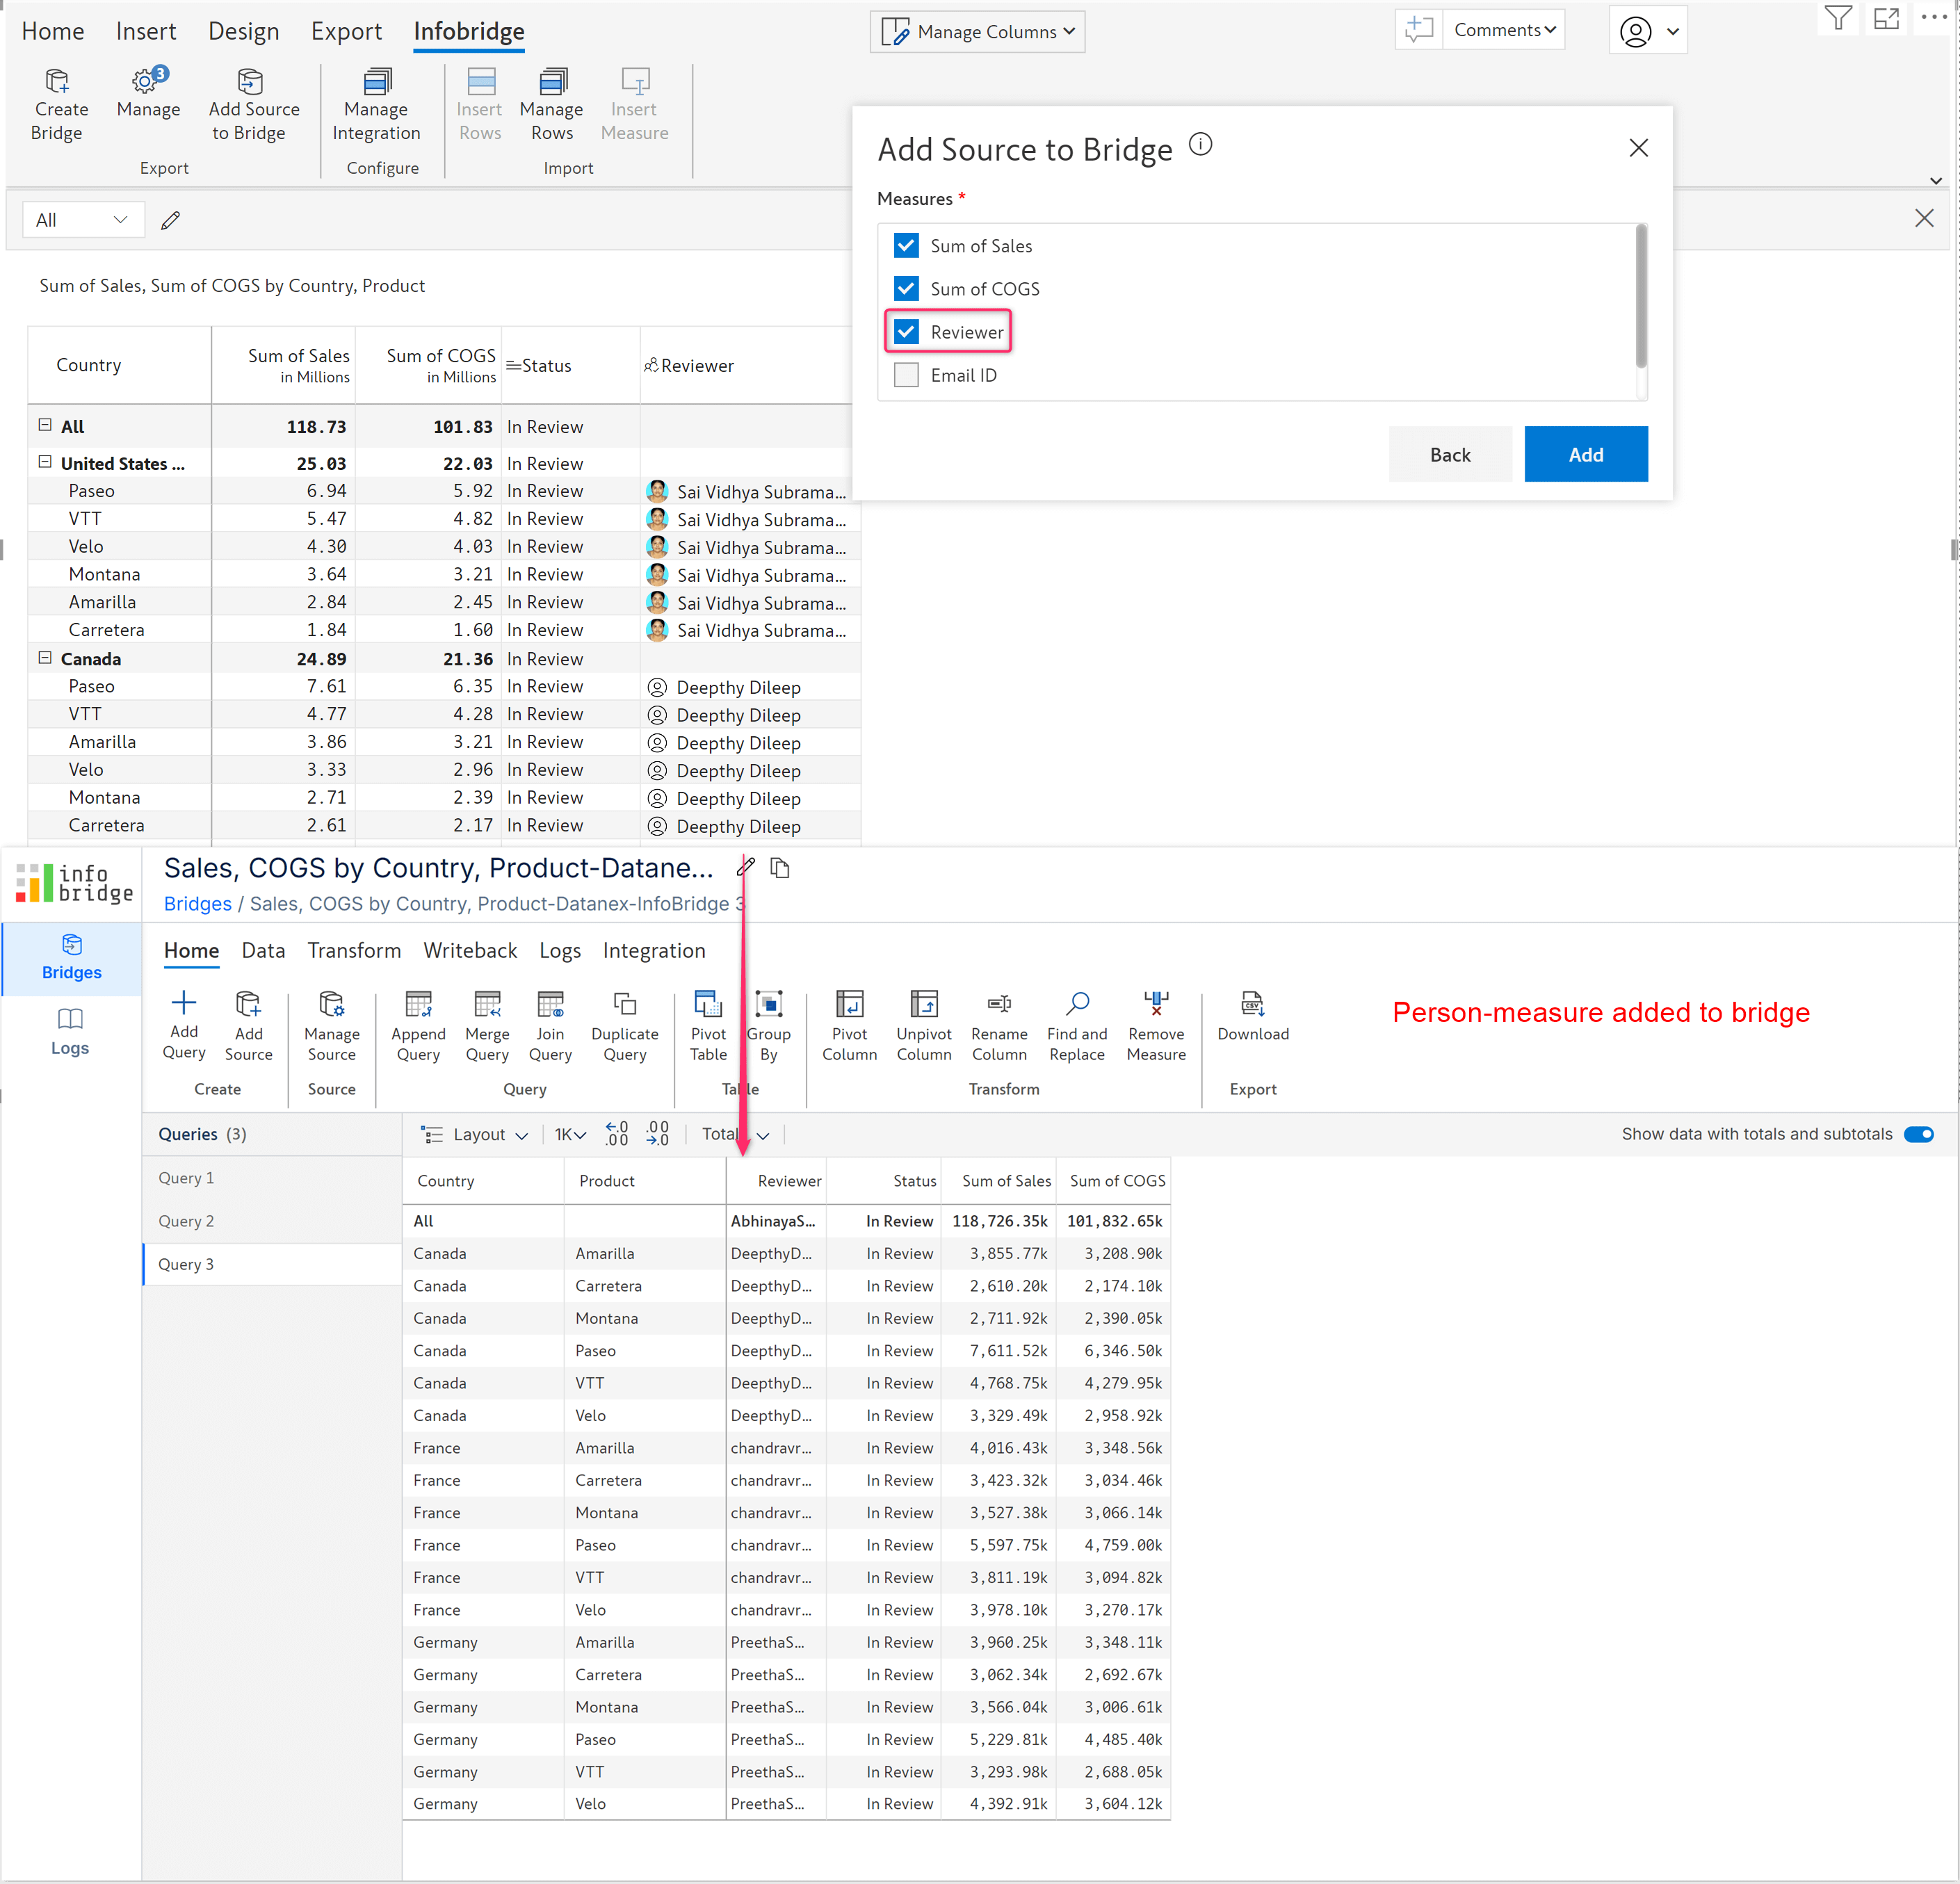
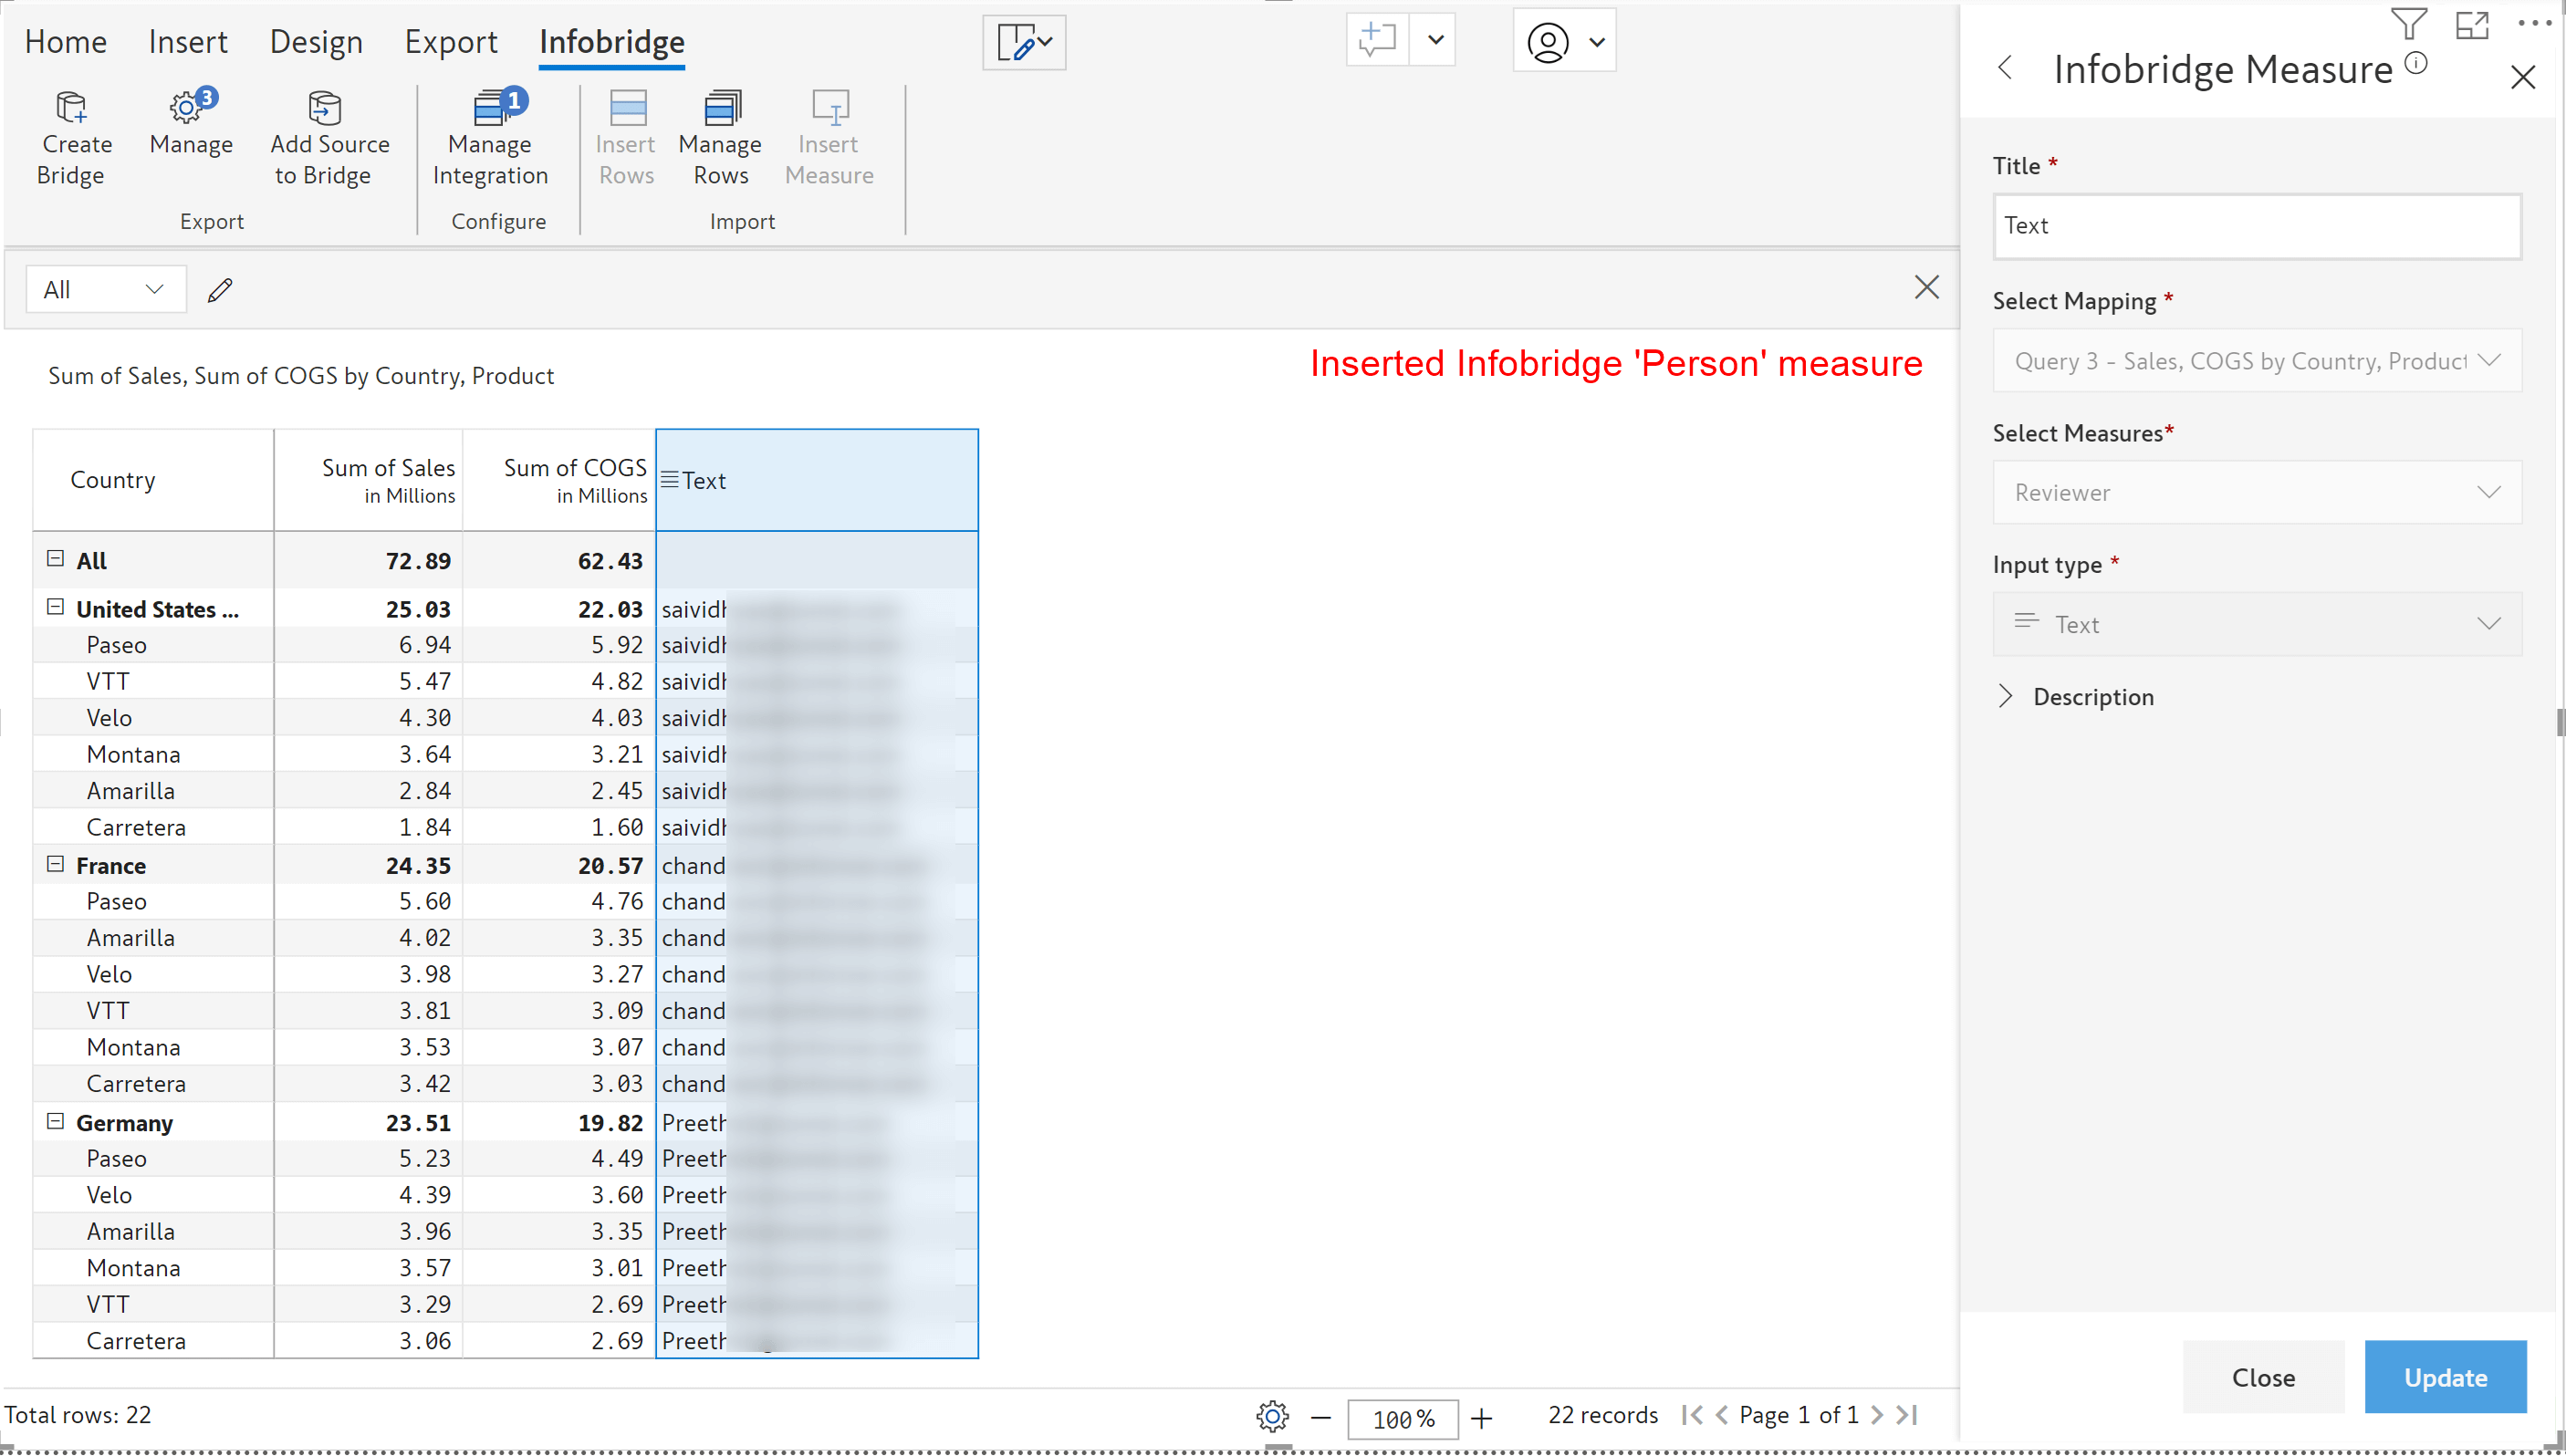
Infobridge now supports the ‘Person’ column import from the visual, and you can add the same from the bridge to another visual.
Integrating the ‘Person’ measure between the visuals:
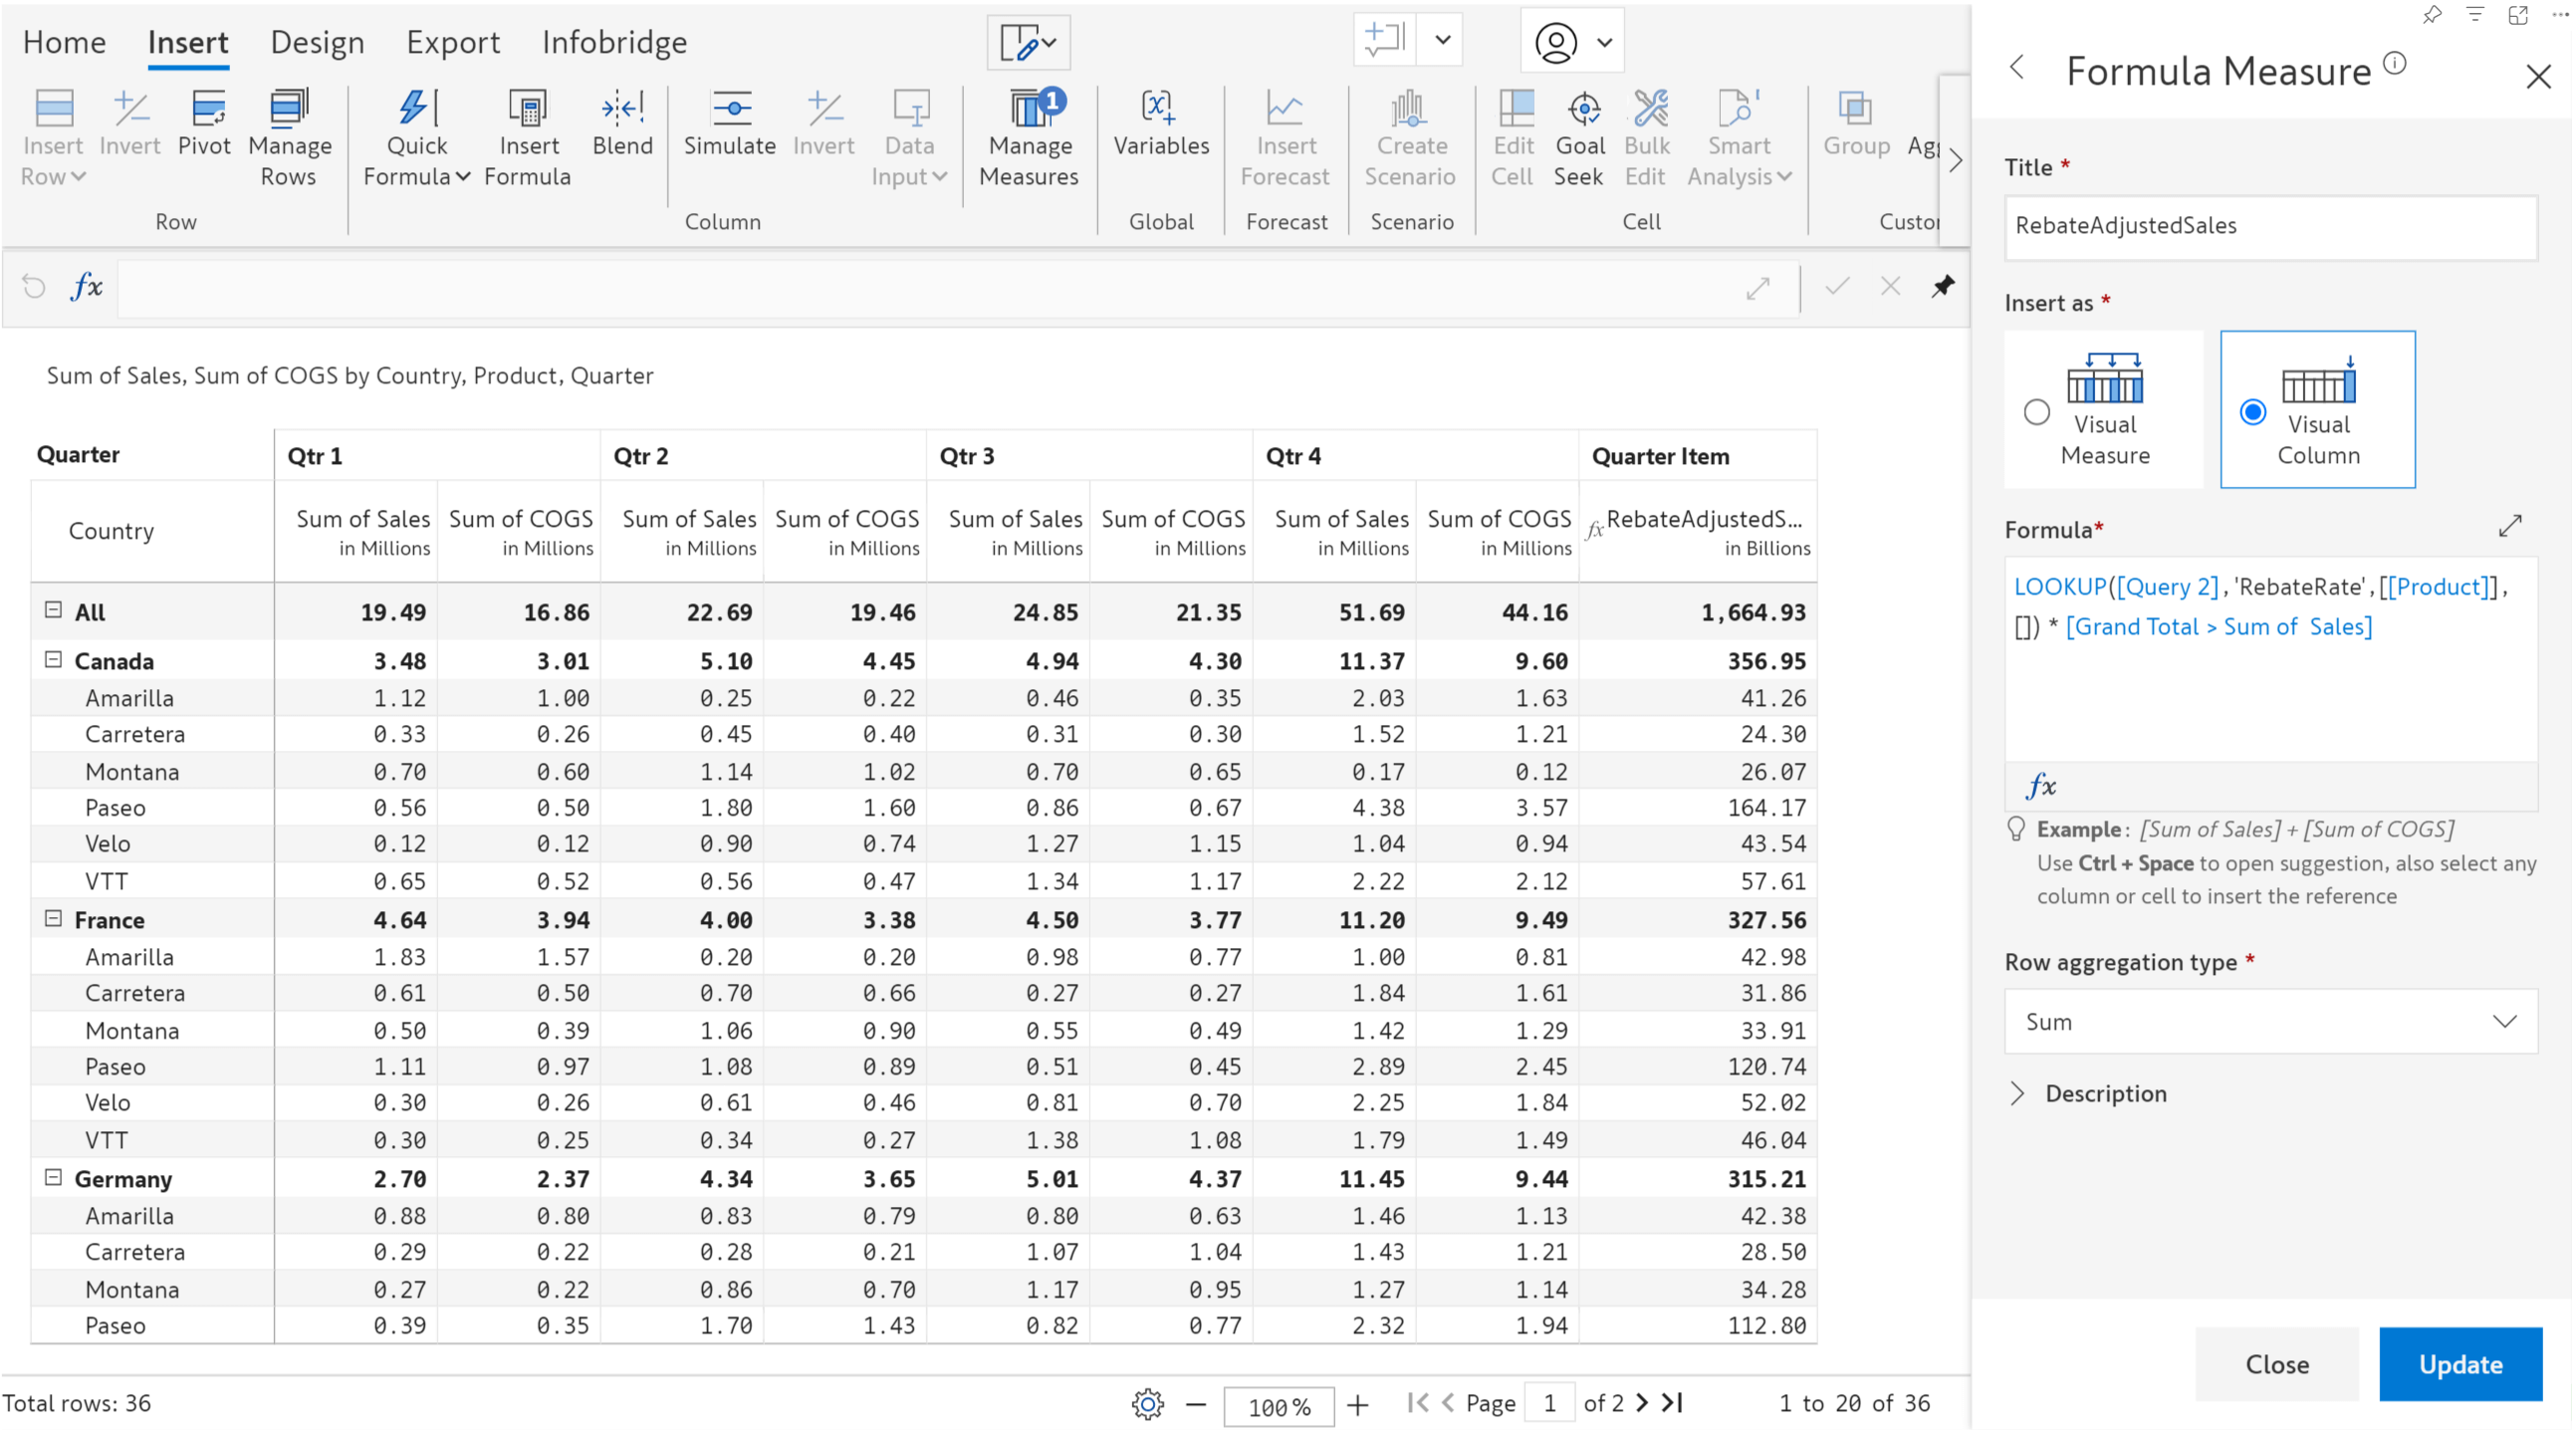
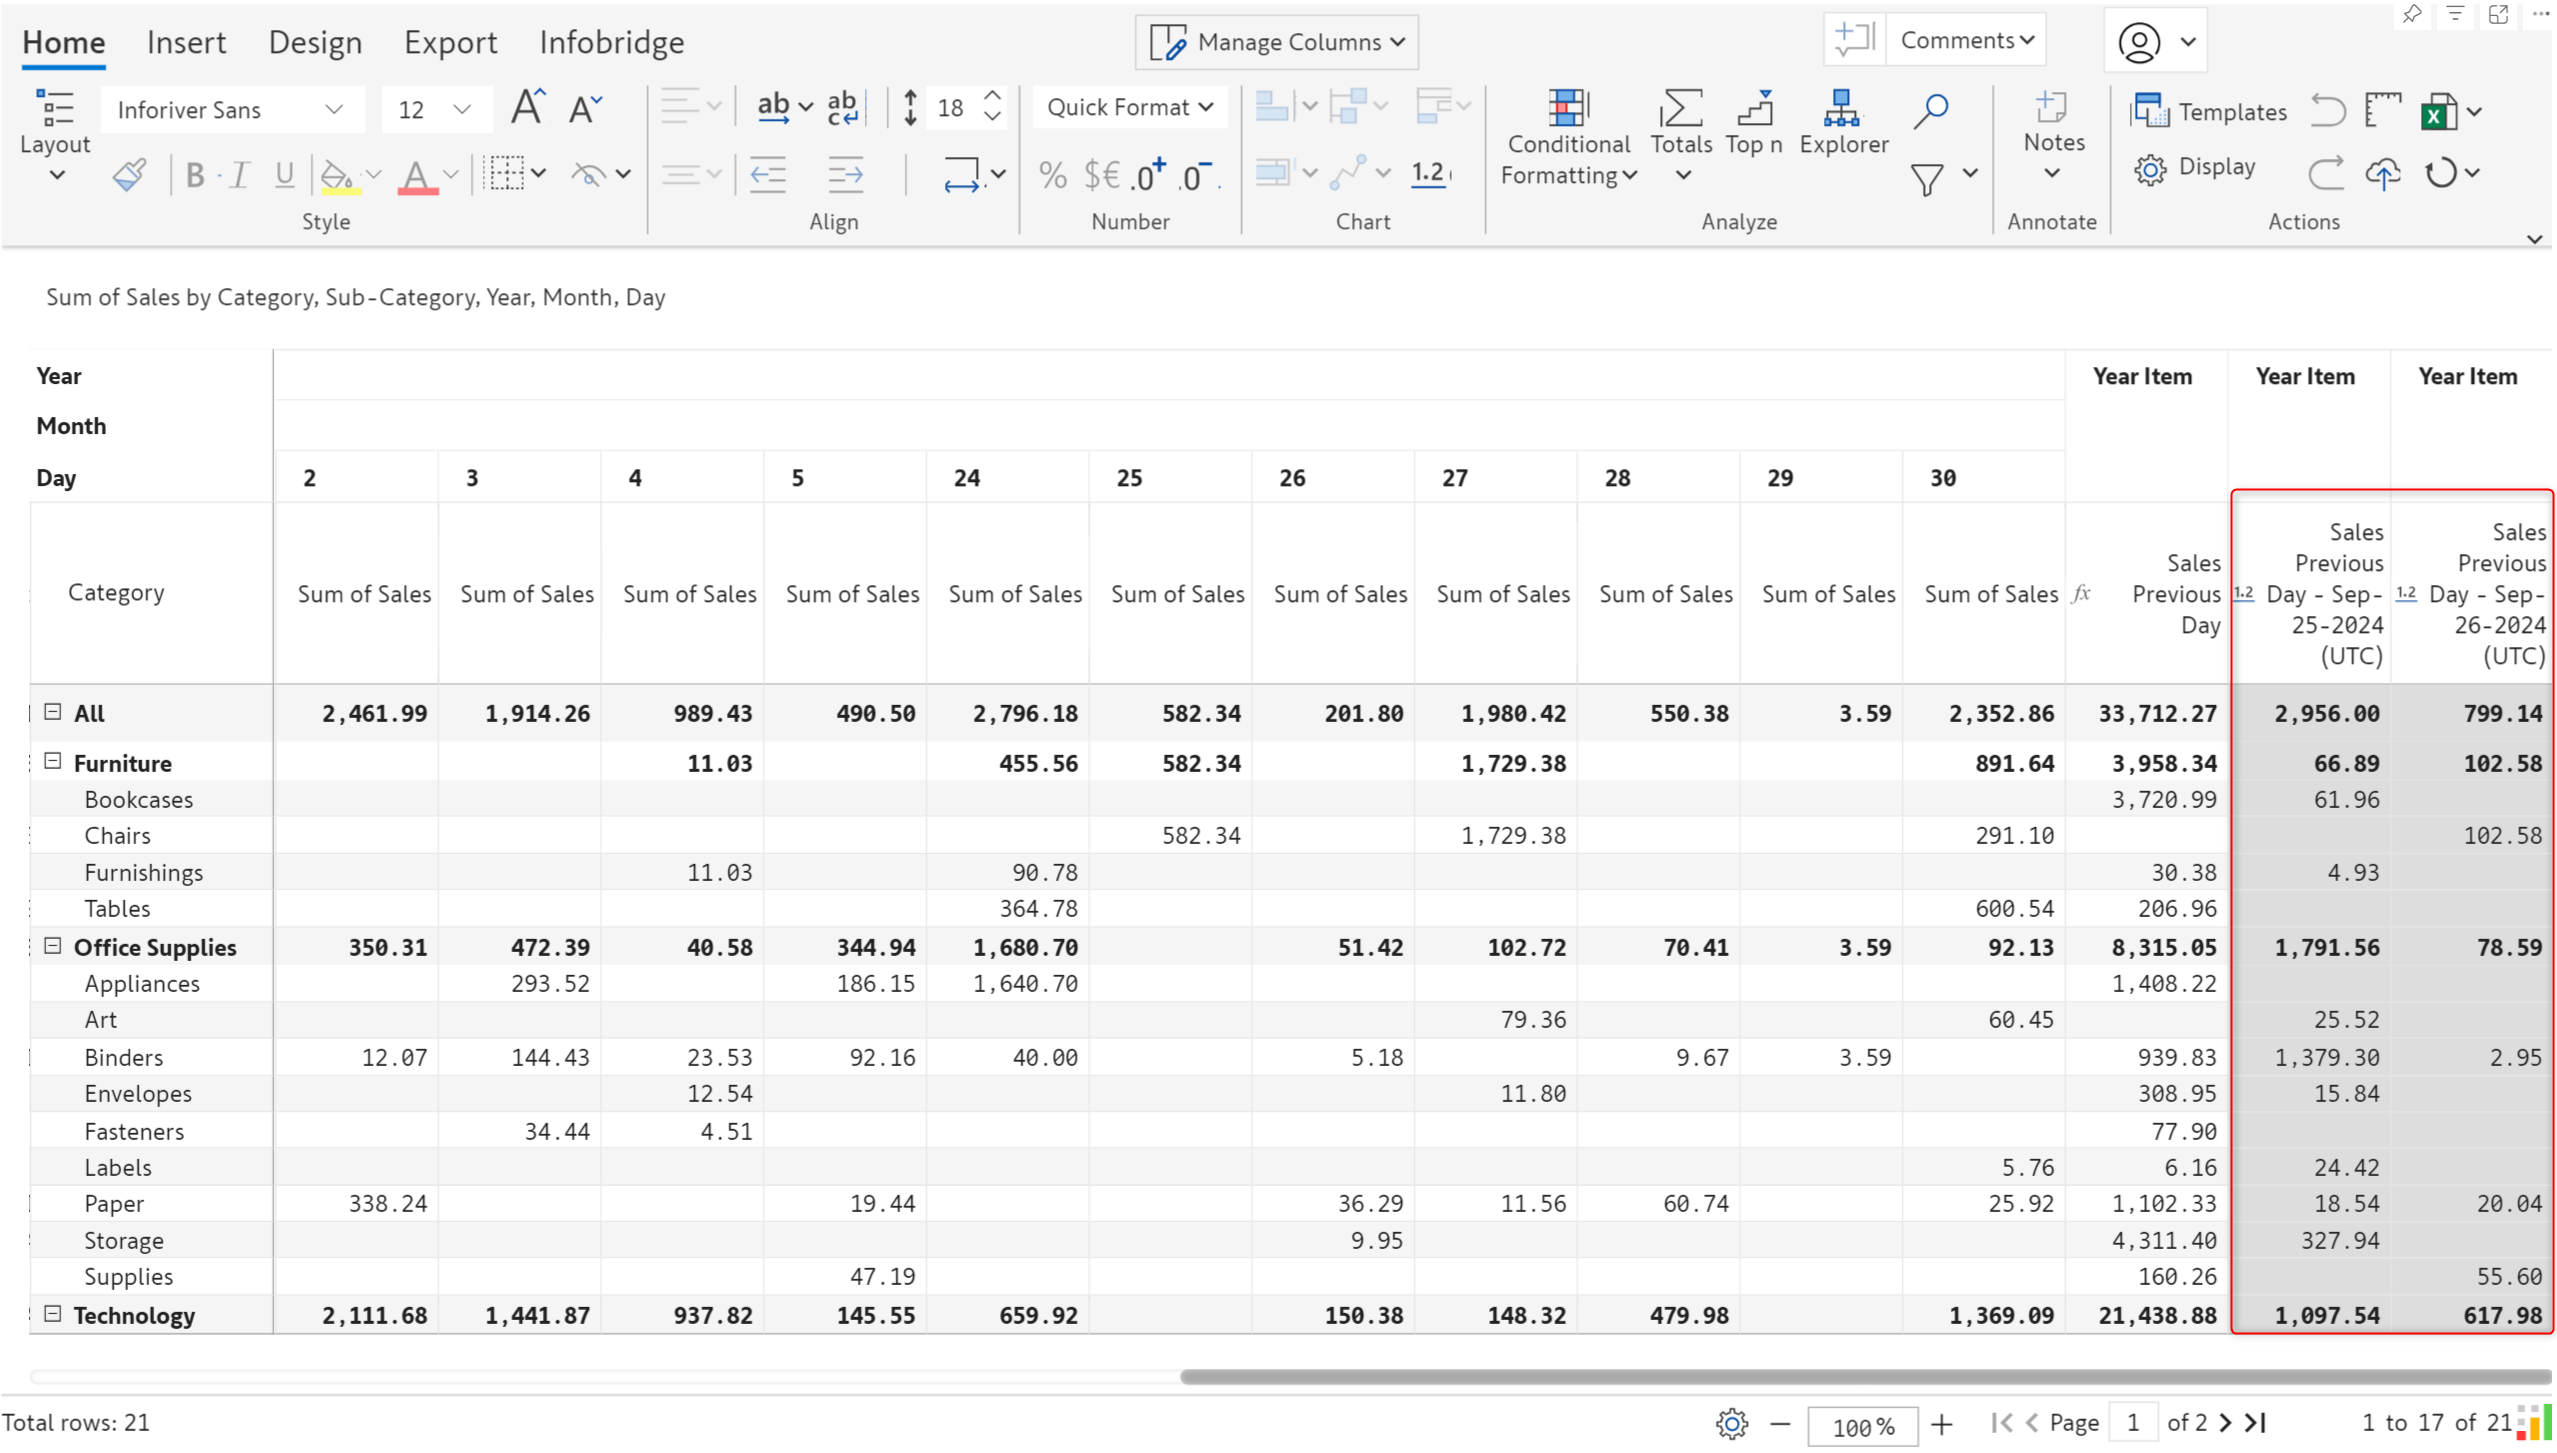
Inforiver, along with Infobridge, can now perform Excel-like VLOOKUP. Thus, the user can look up values from an Infobridge query and load them inside an Inforiver visual.
The LOOKUP formula can fetch measure values directly from Infobridge without creating an integration and importing measures/rows into your report.
We’ve used a bridge that stores product rebate rates to demonstrate this feature.
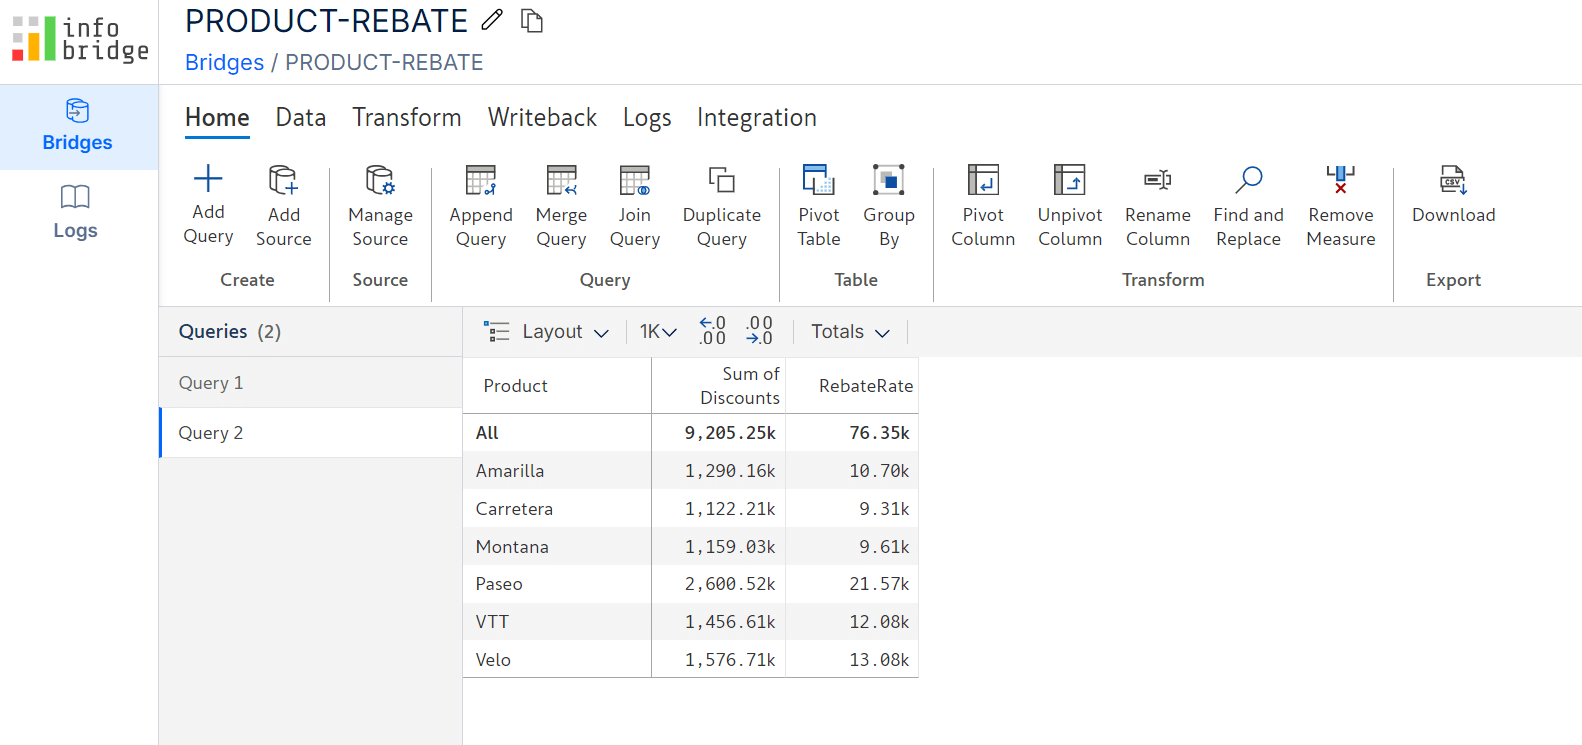
Notice how we can fetch the rebate rates directly from the bridge from within the formula without exposing them in the report or adding more fields/rows to the report.
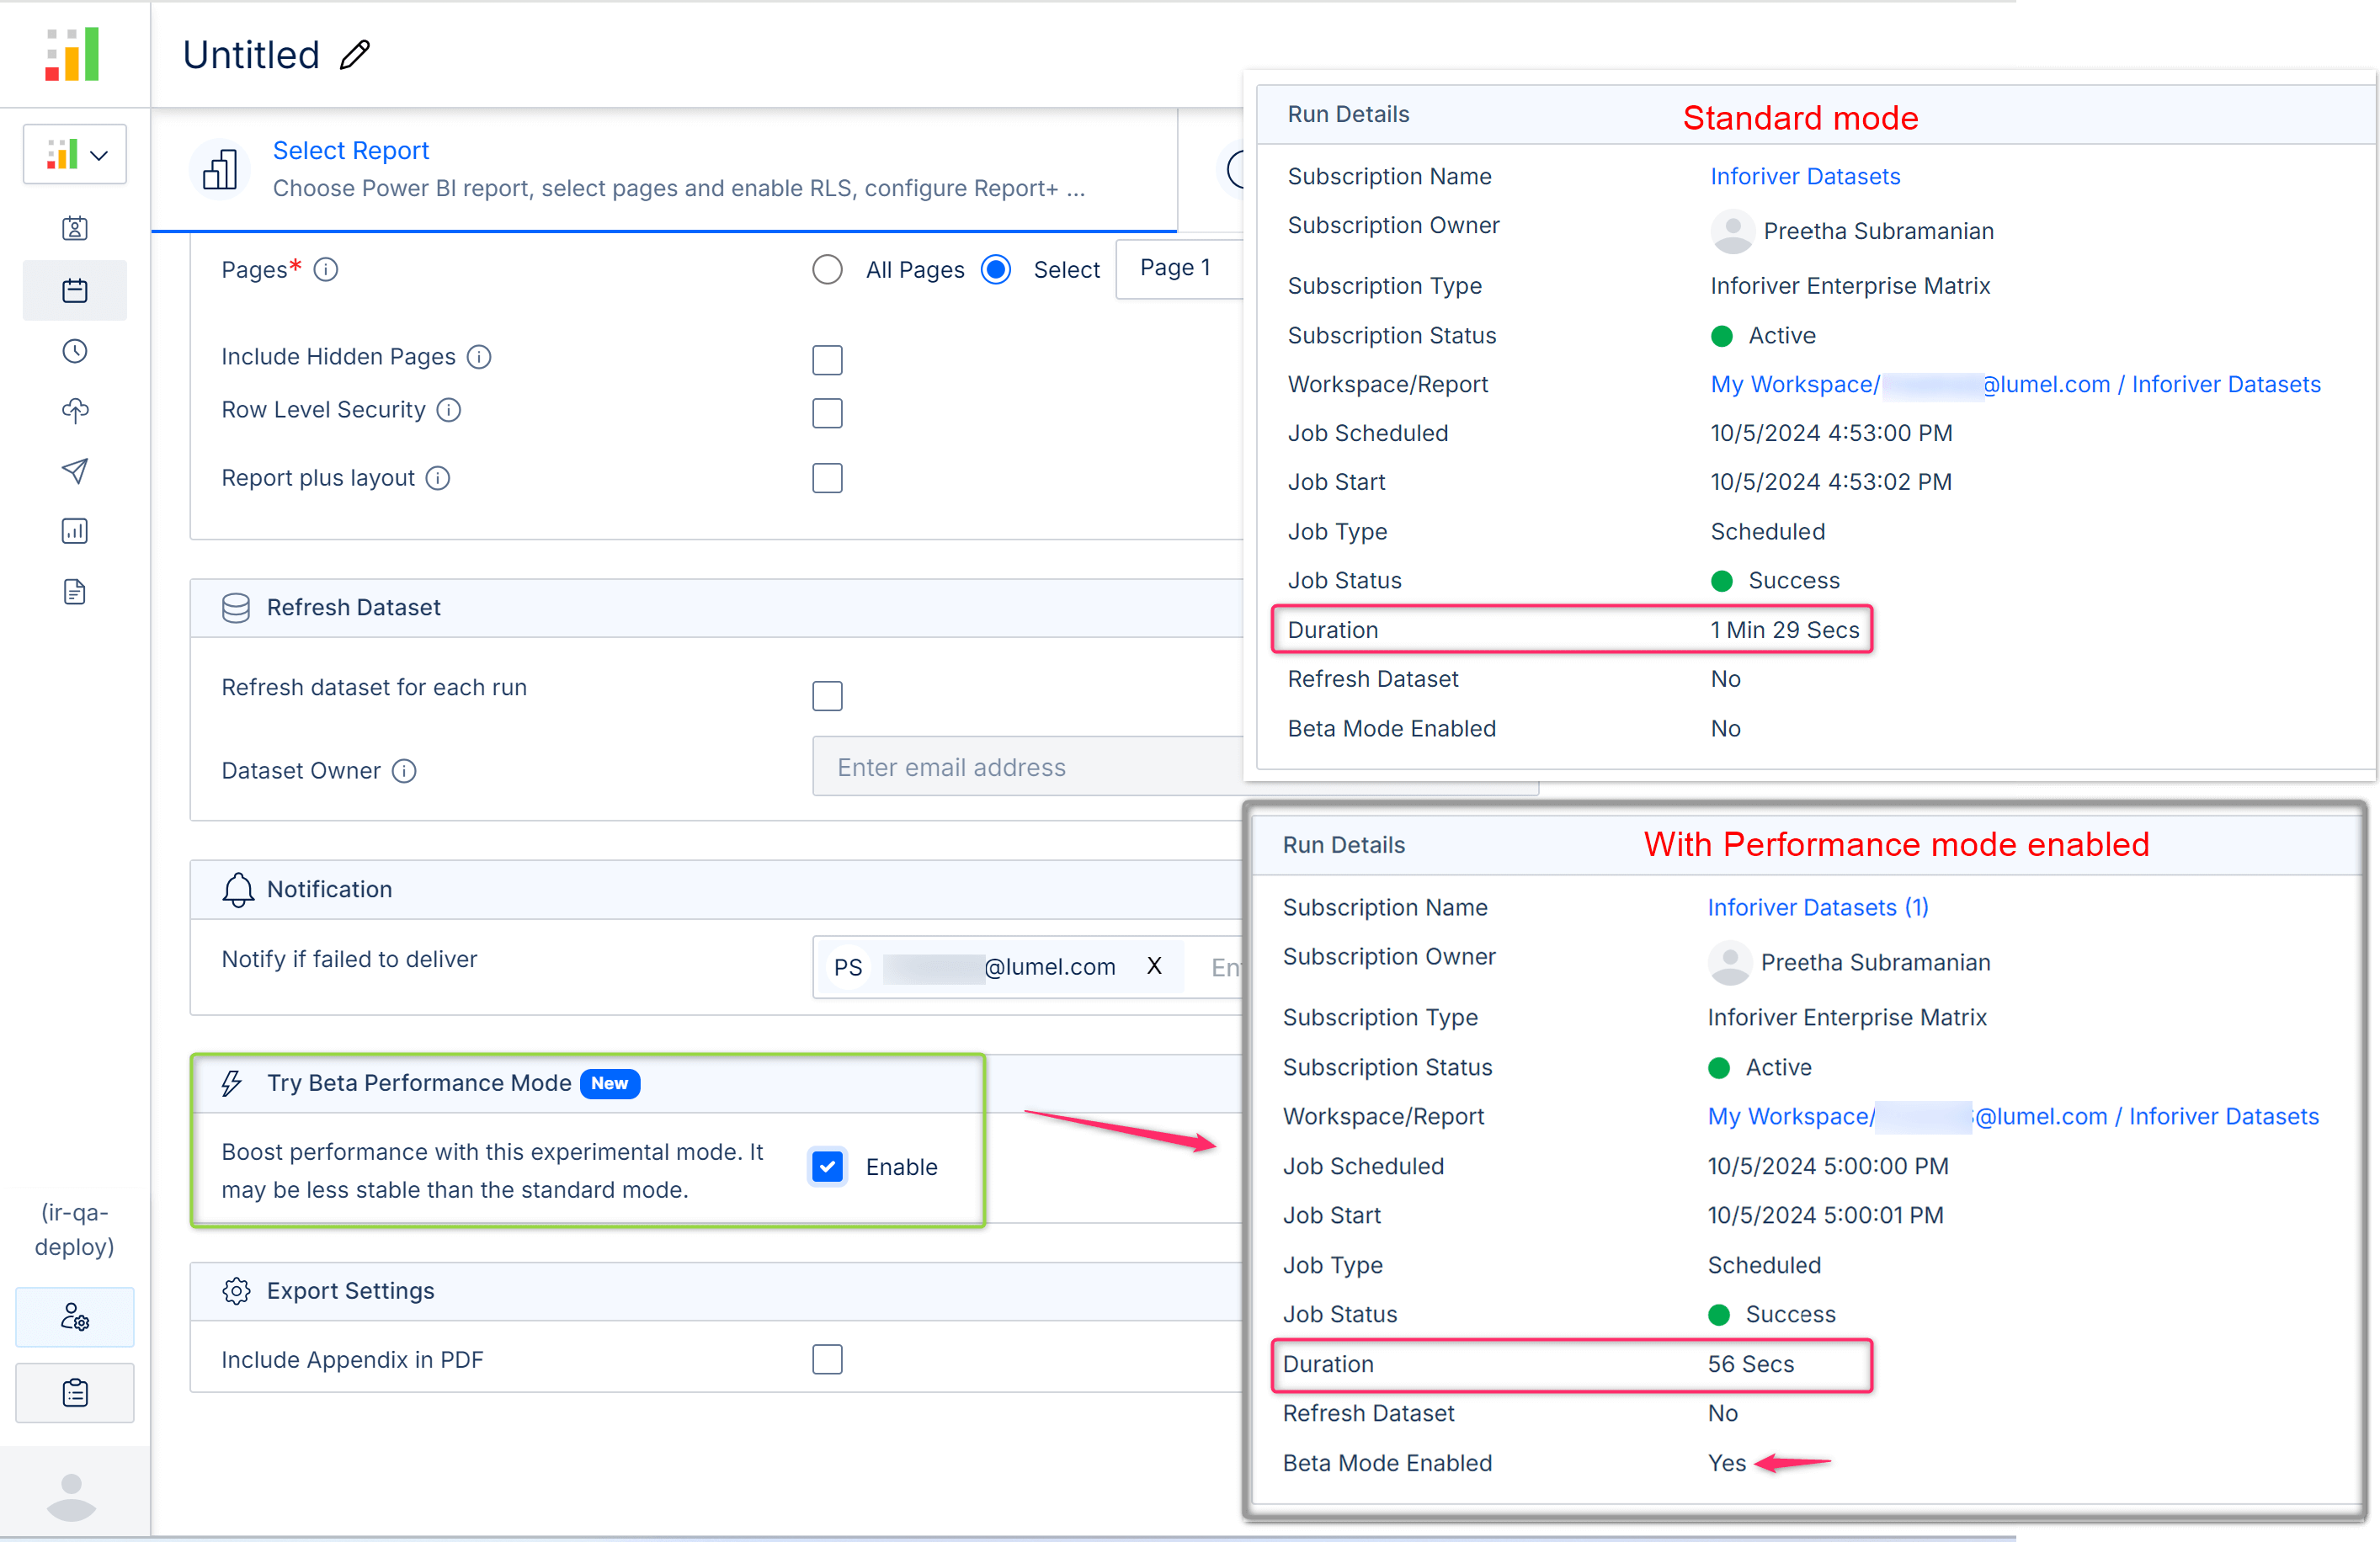
We have introduced the new Performance Mode in the subscription scheduler, which provides a significant performance boost even for high data volume reports. When enabled, you will notice improved scheduler job runtimes. This is currently available in the beta version.
In this release, we have refactored and optimized payloads so writeback processes complete significantly faster.
With this custom writeback filter, you can write back data based on the last updated date. For example, you can write back only the data that was updated after, before, or on a specific date.
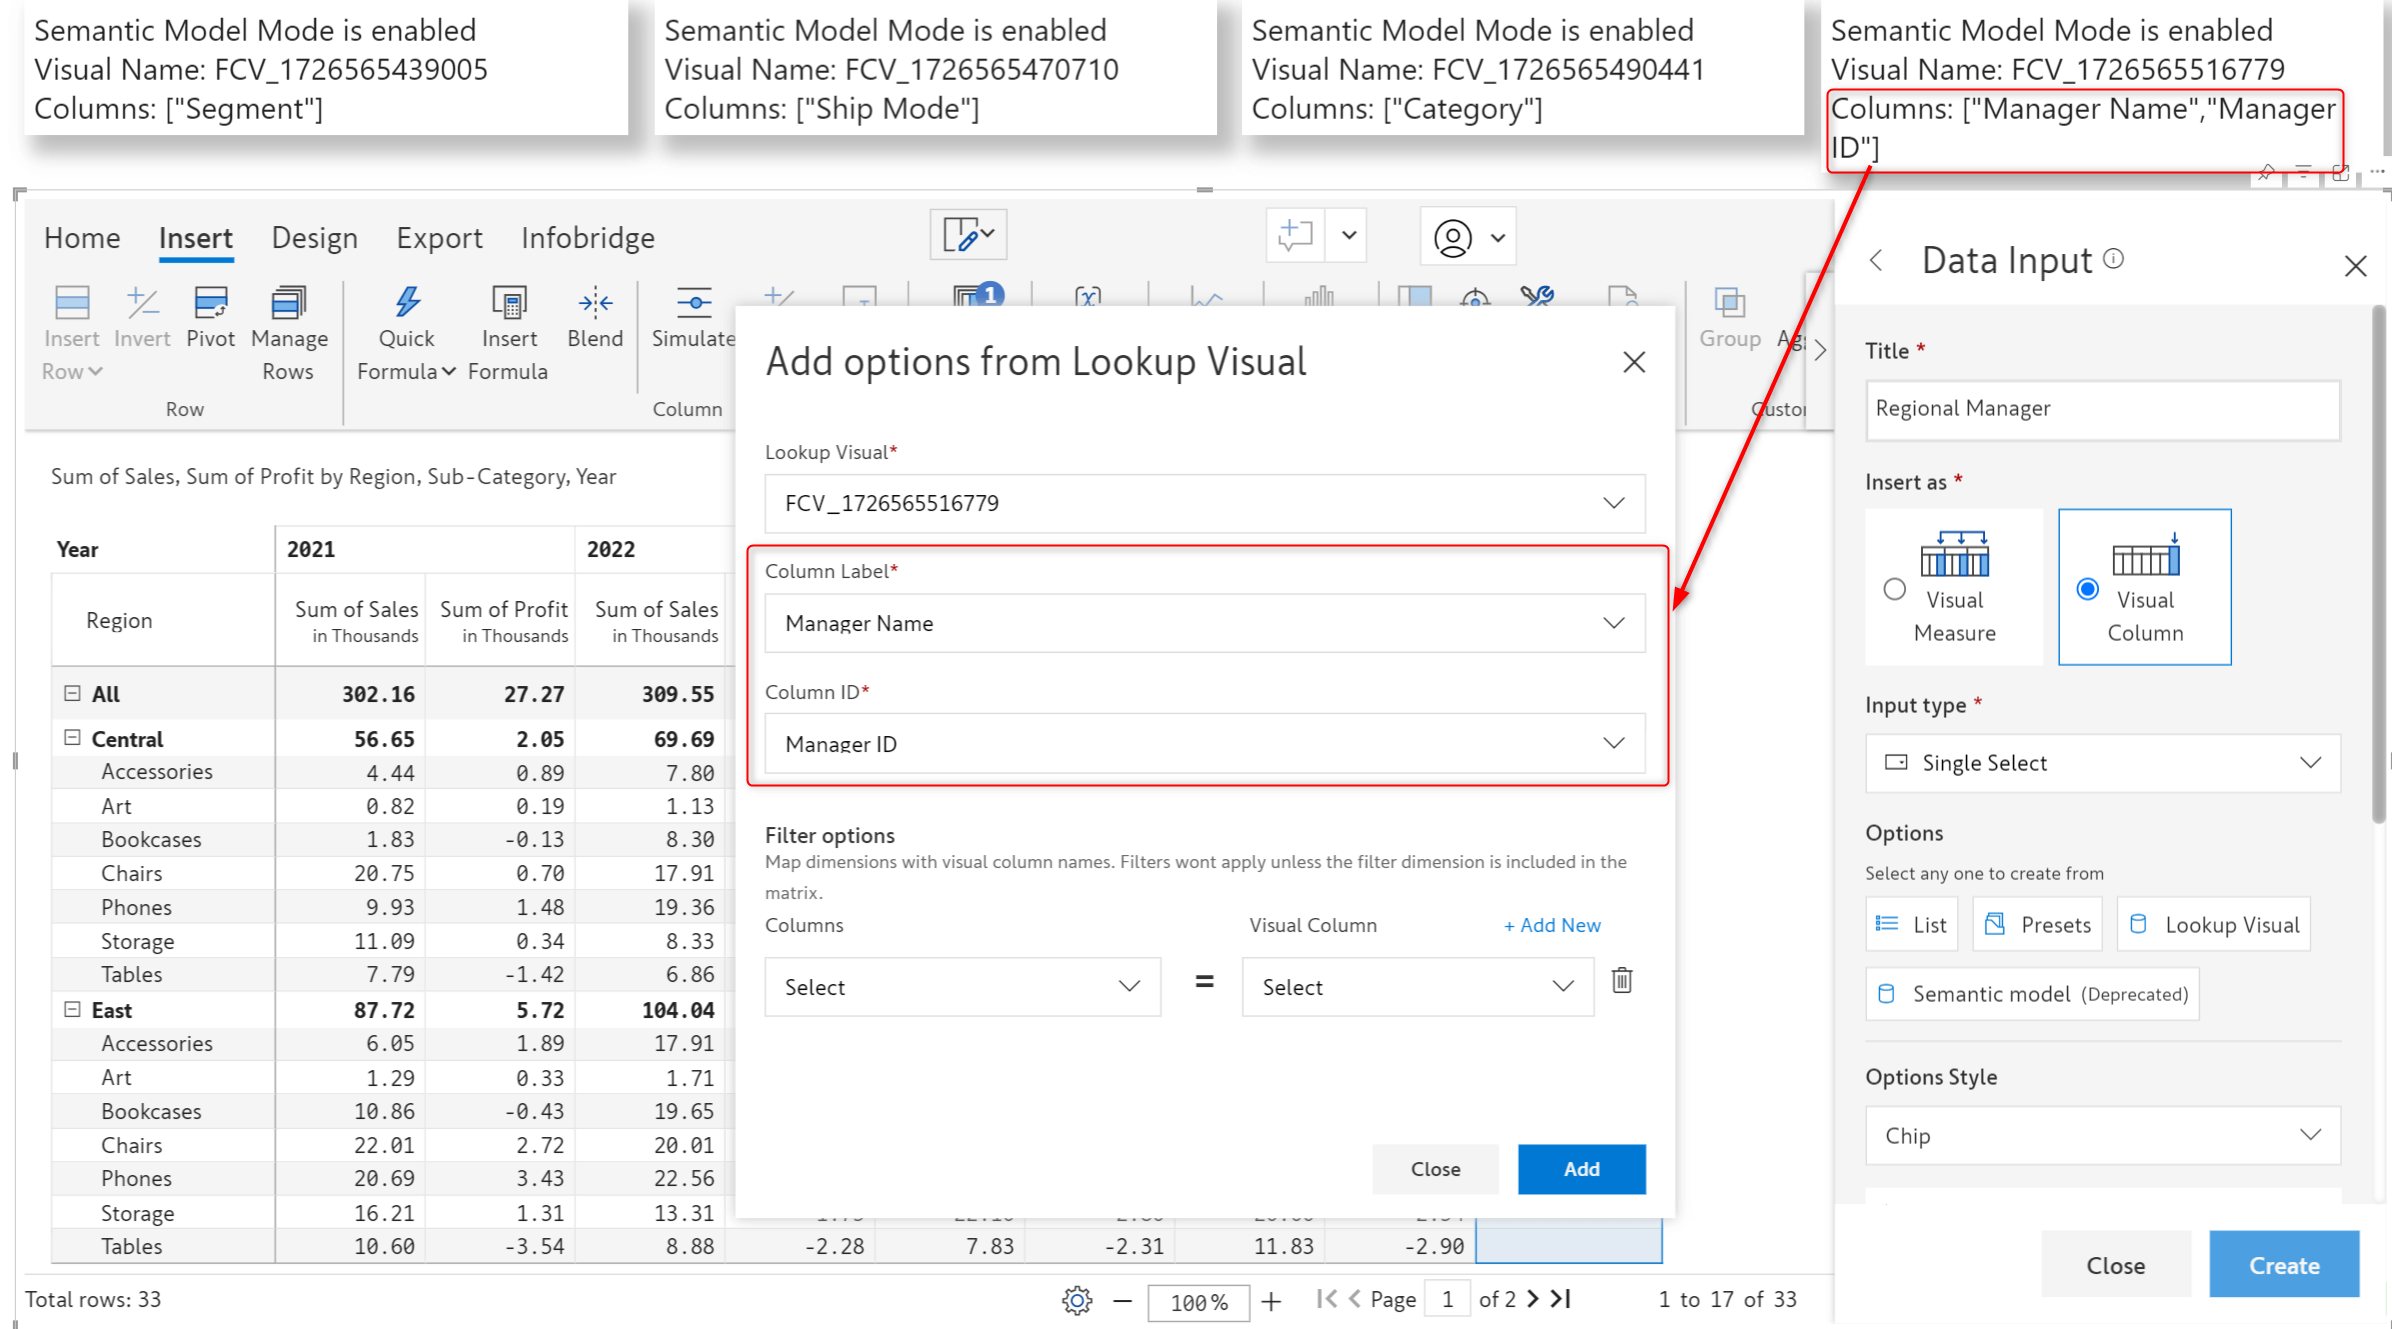
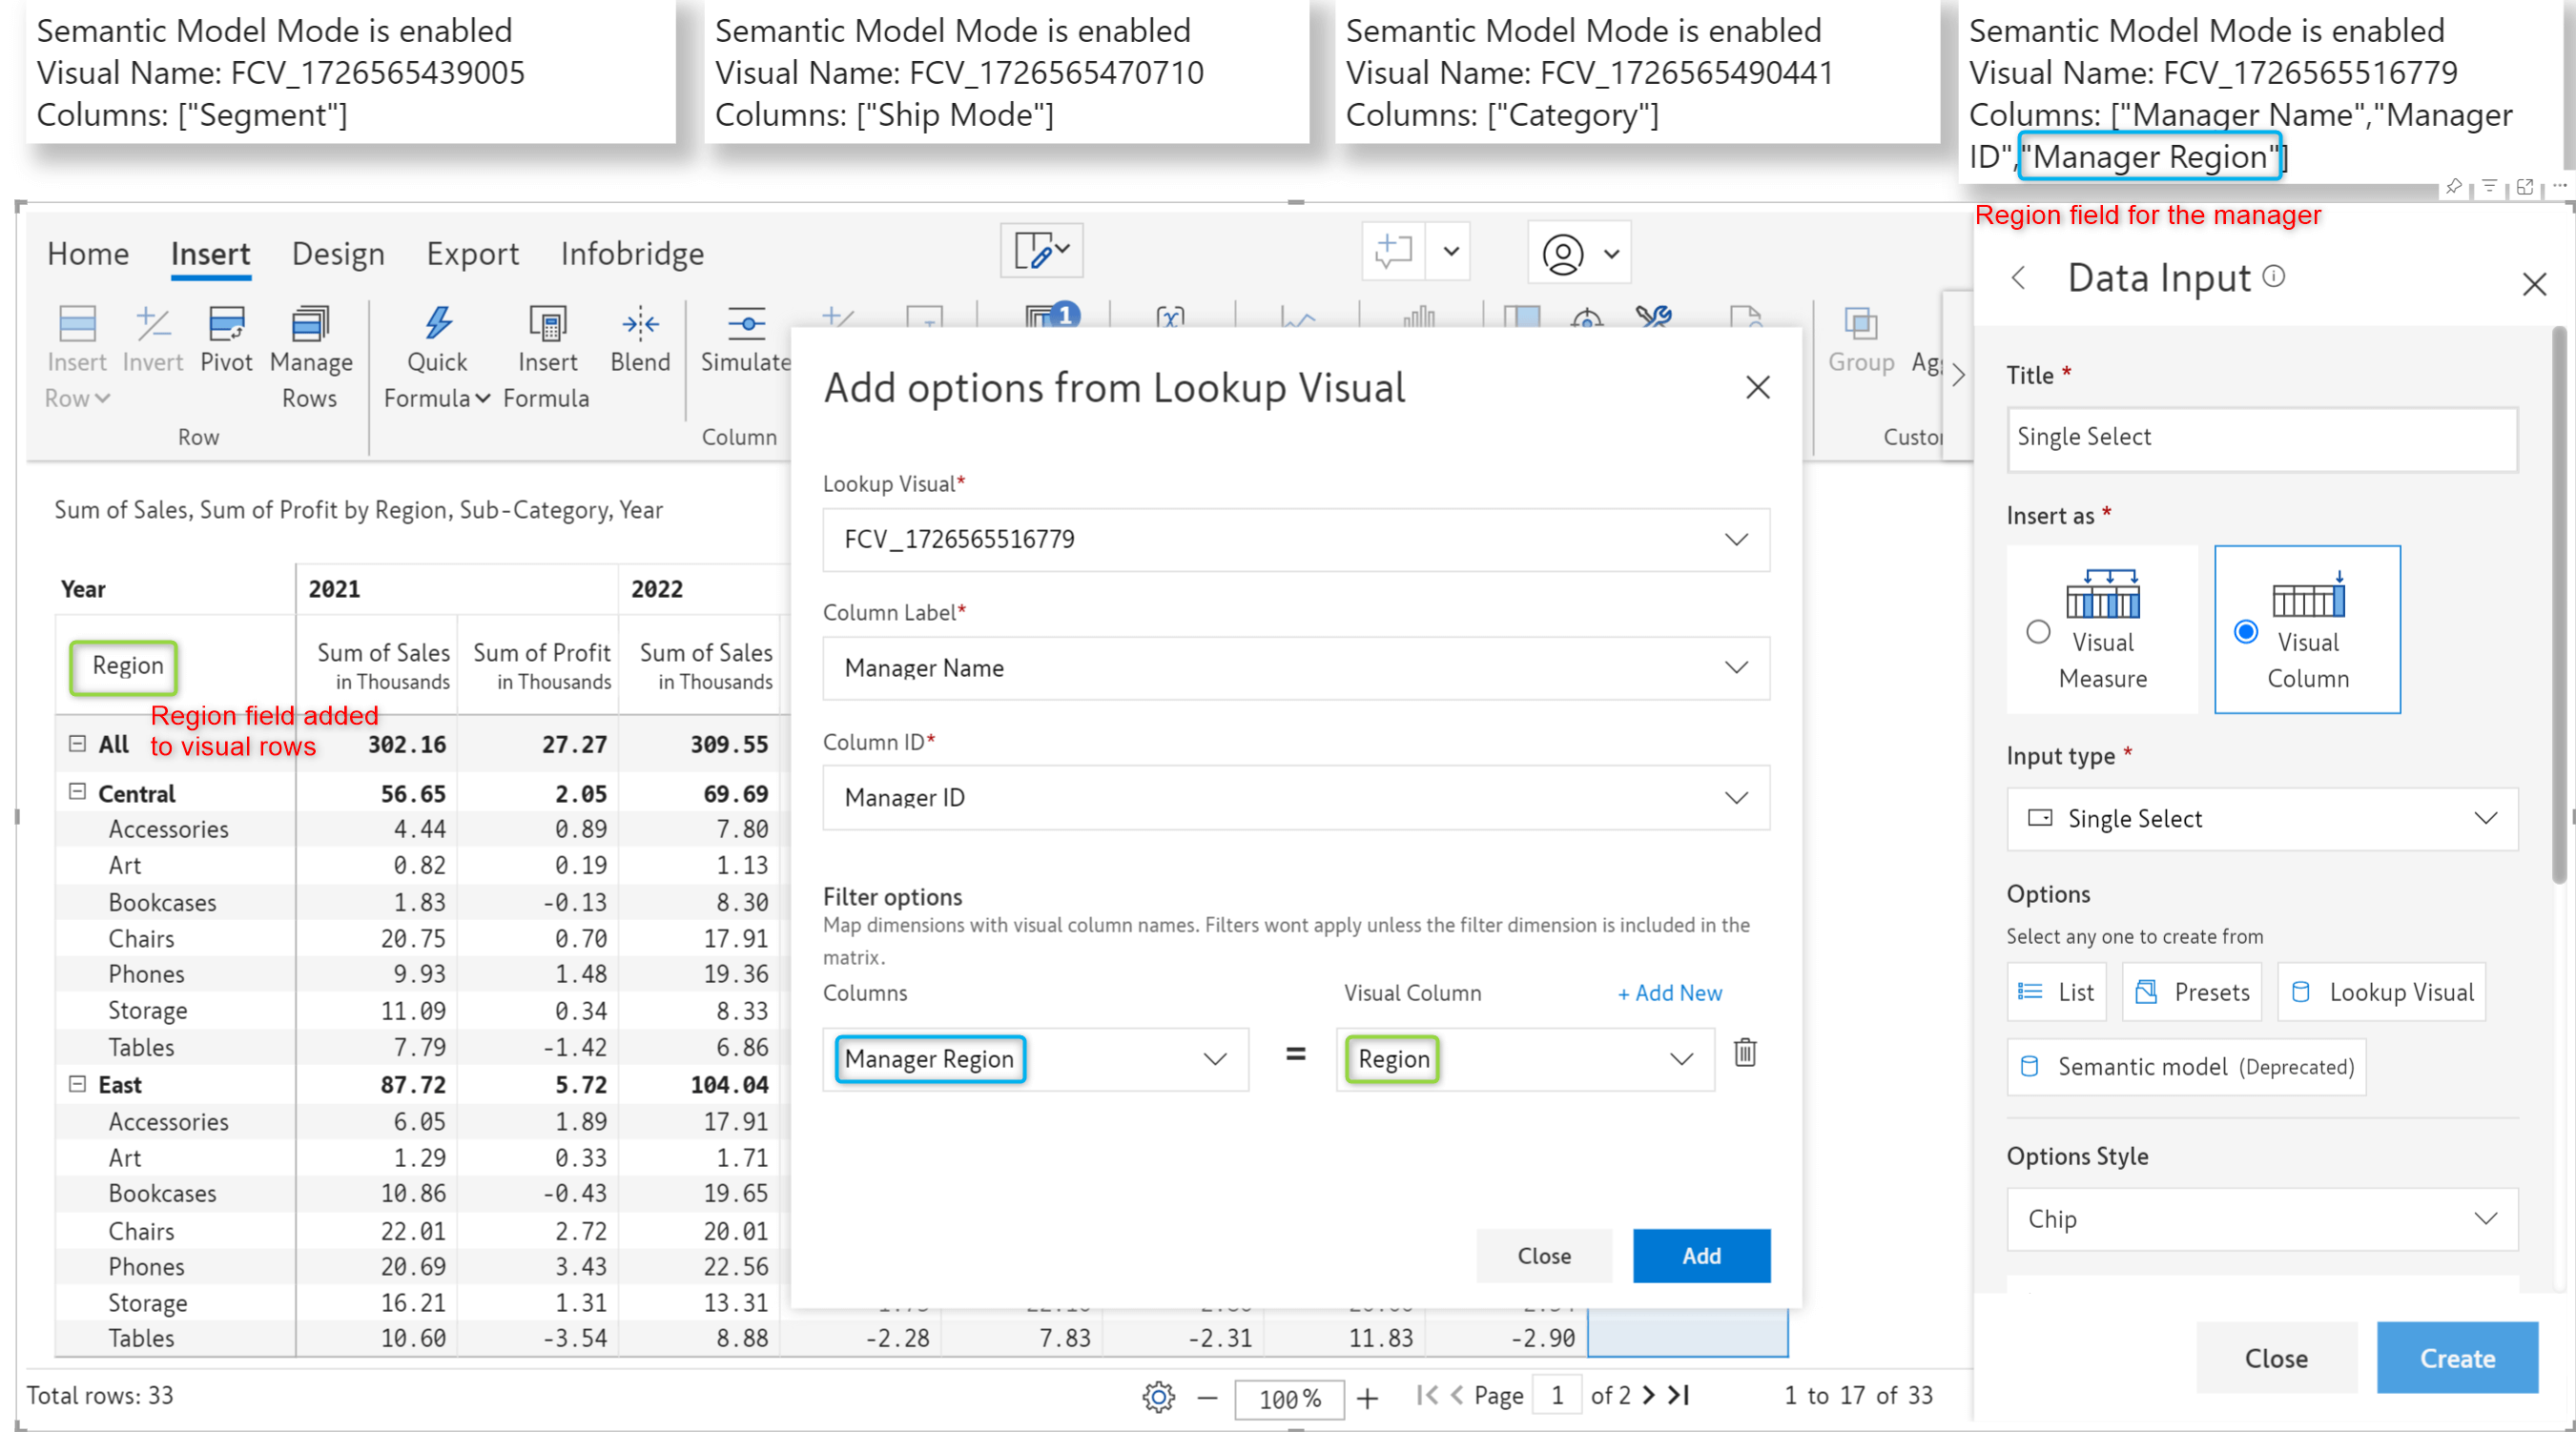
With the new Inforiver Lookup visual, you can effortlessly fetch dropdown options from different semantic models in real-time with implicit row-level security.
The Inforiver Lookup visual is a lightweight custom visual from us that works with the Matrix visuals. It can be imported from AppSource at no extra cost. While the existing option of sourcing the dropdown options within the visual works, we recommend you use the Lookup visuals for the reasons below:
Top 3 benefits of switching to the Inforiver Lookup visual
Sourcing dropdown values from Lookup visuals:
This blog provides more information about importing, configuring, and working with the Lookup visuals.
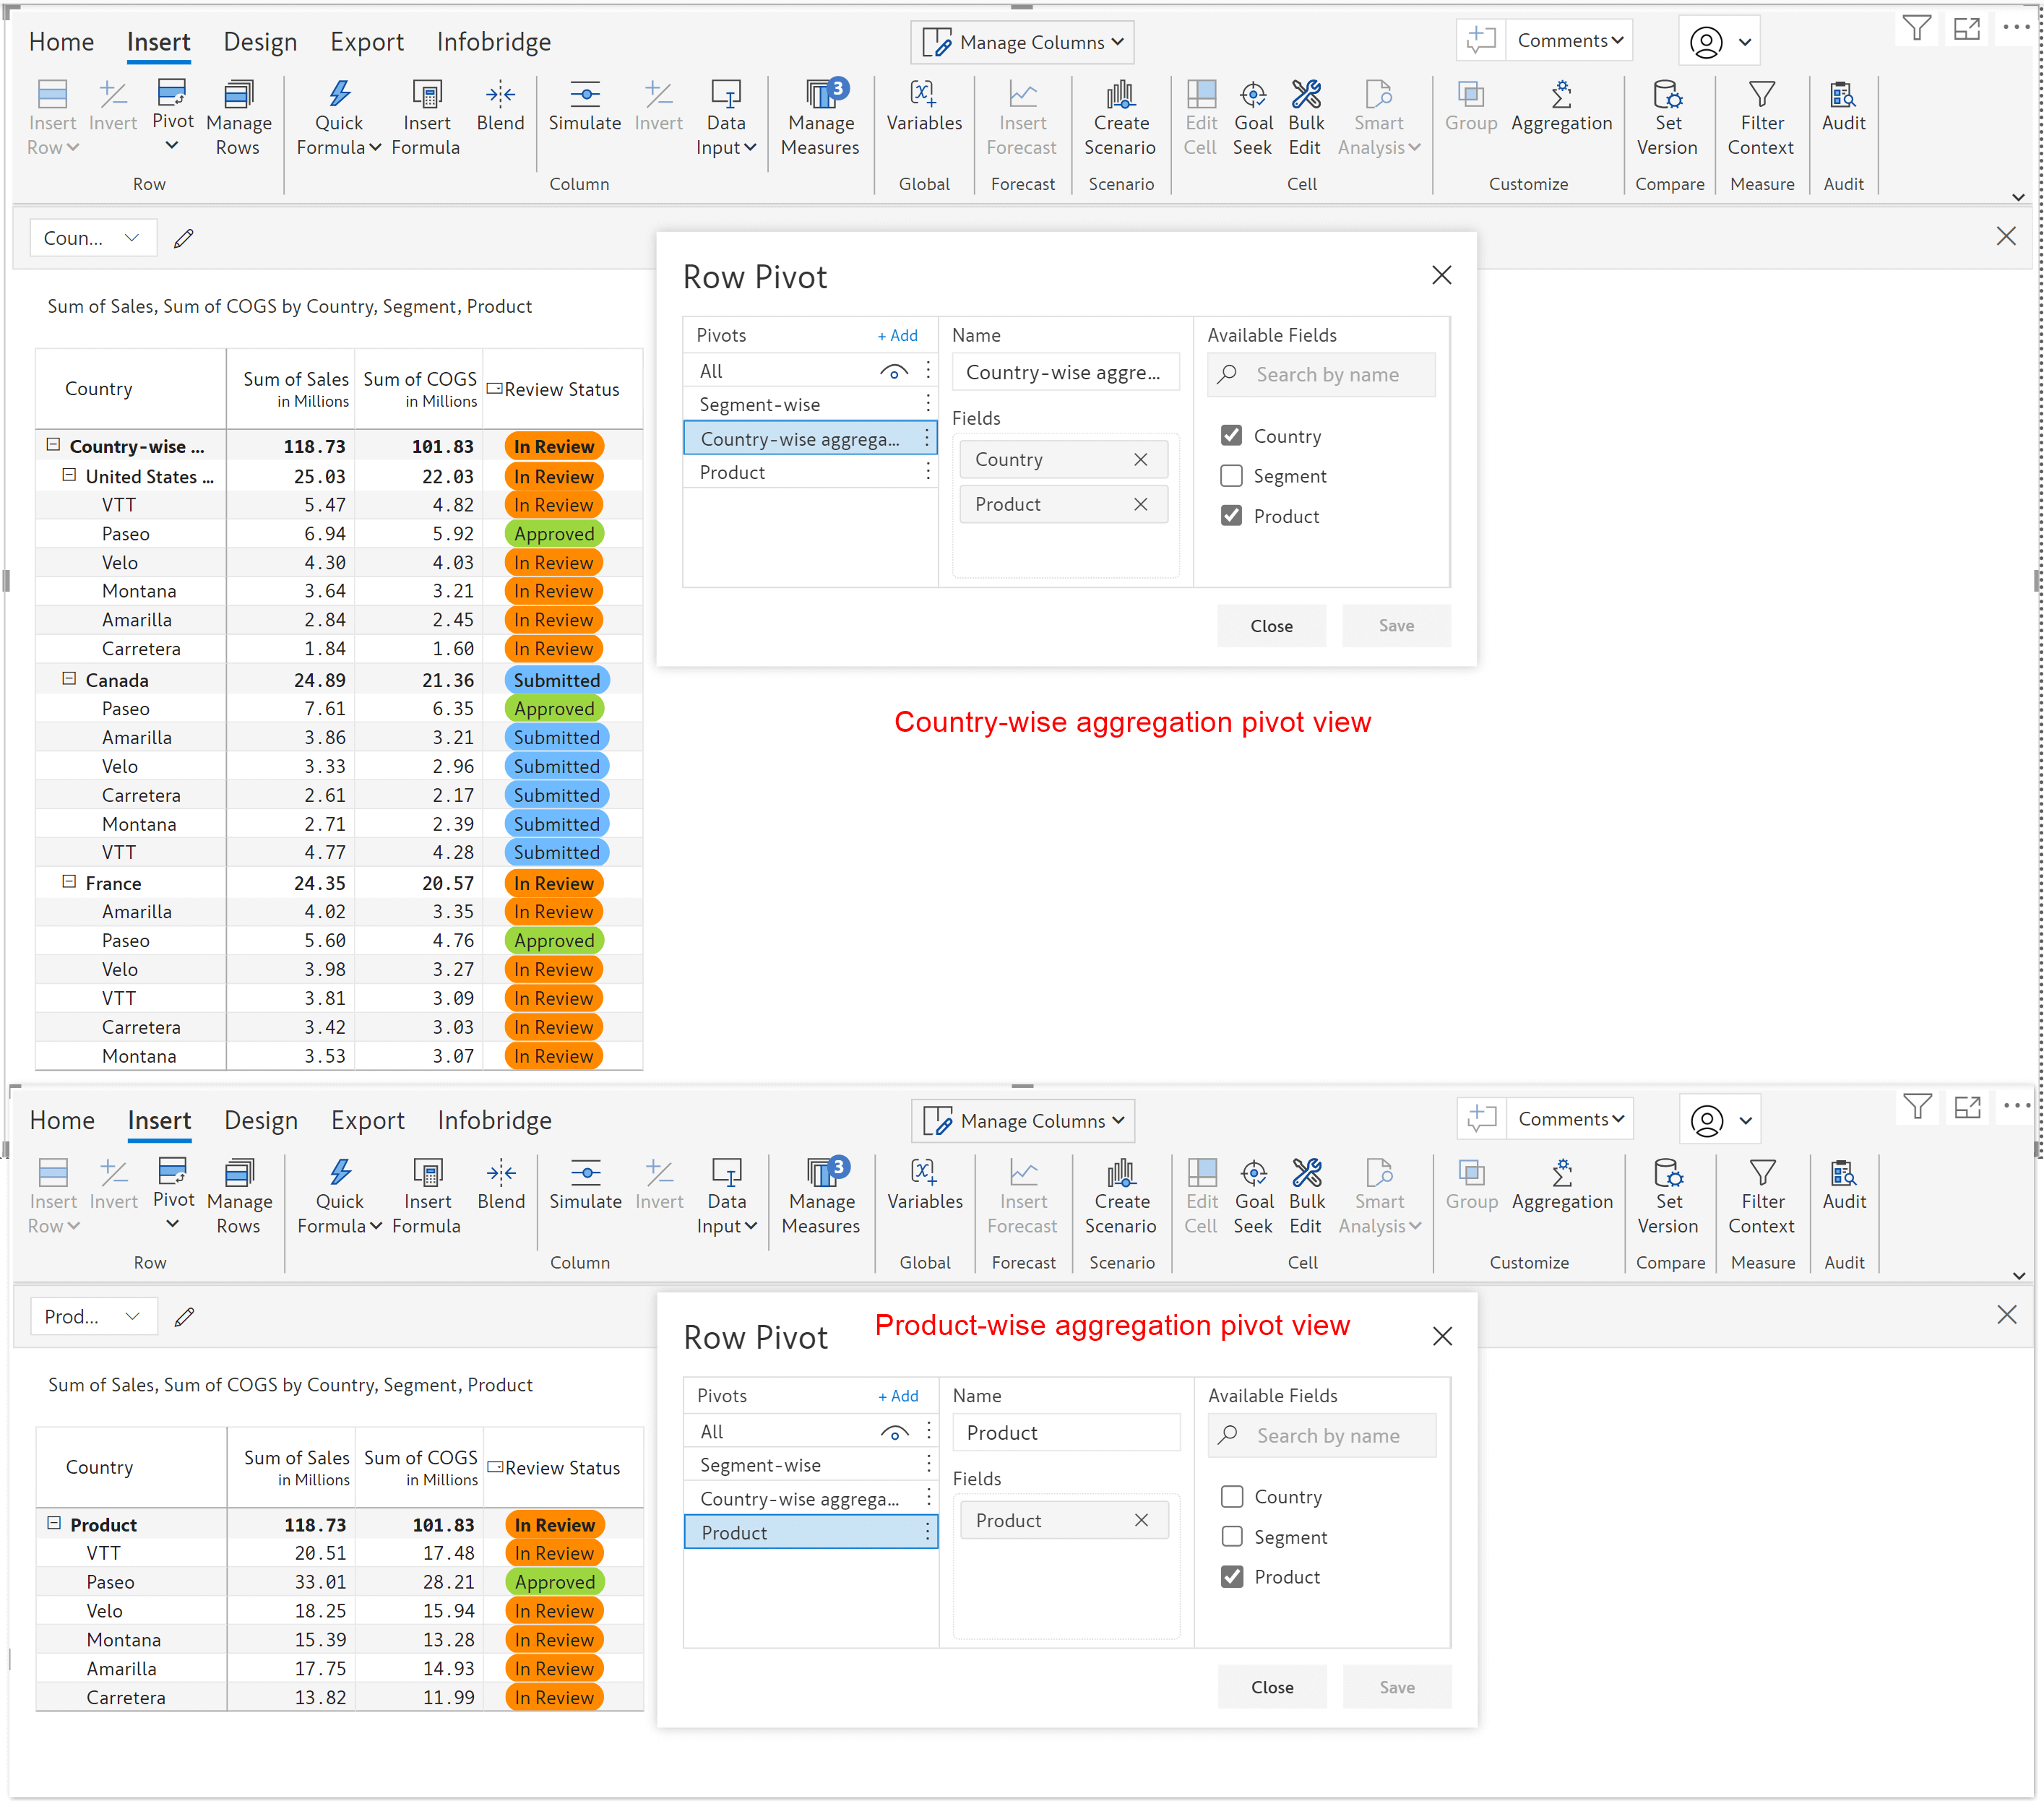
The new Pivot option allows you to create aggregated tables or views within the Inforiver visual with different combinations of row dimensions. When enabled, the Pivot Explorer retains all your pivot views so you can easily switch between them for analysis.
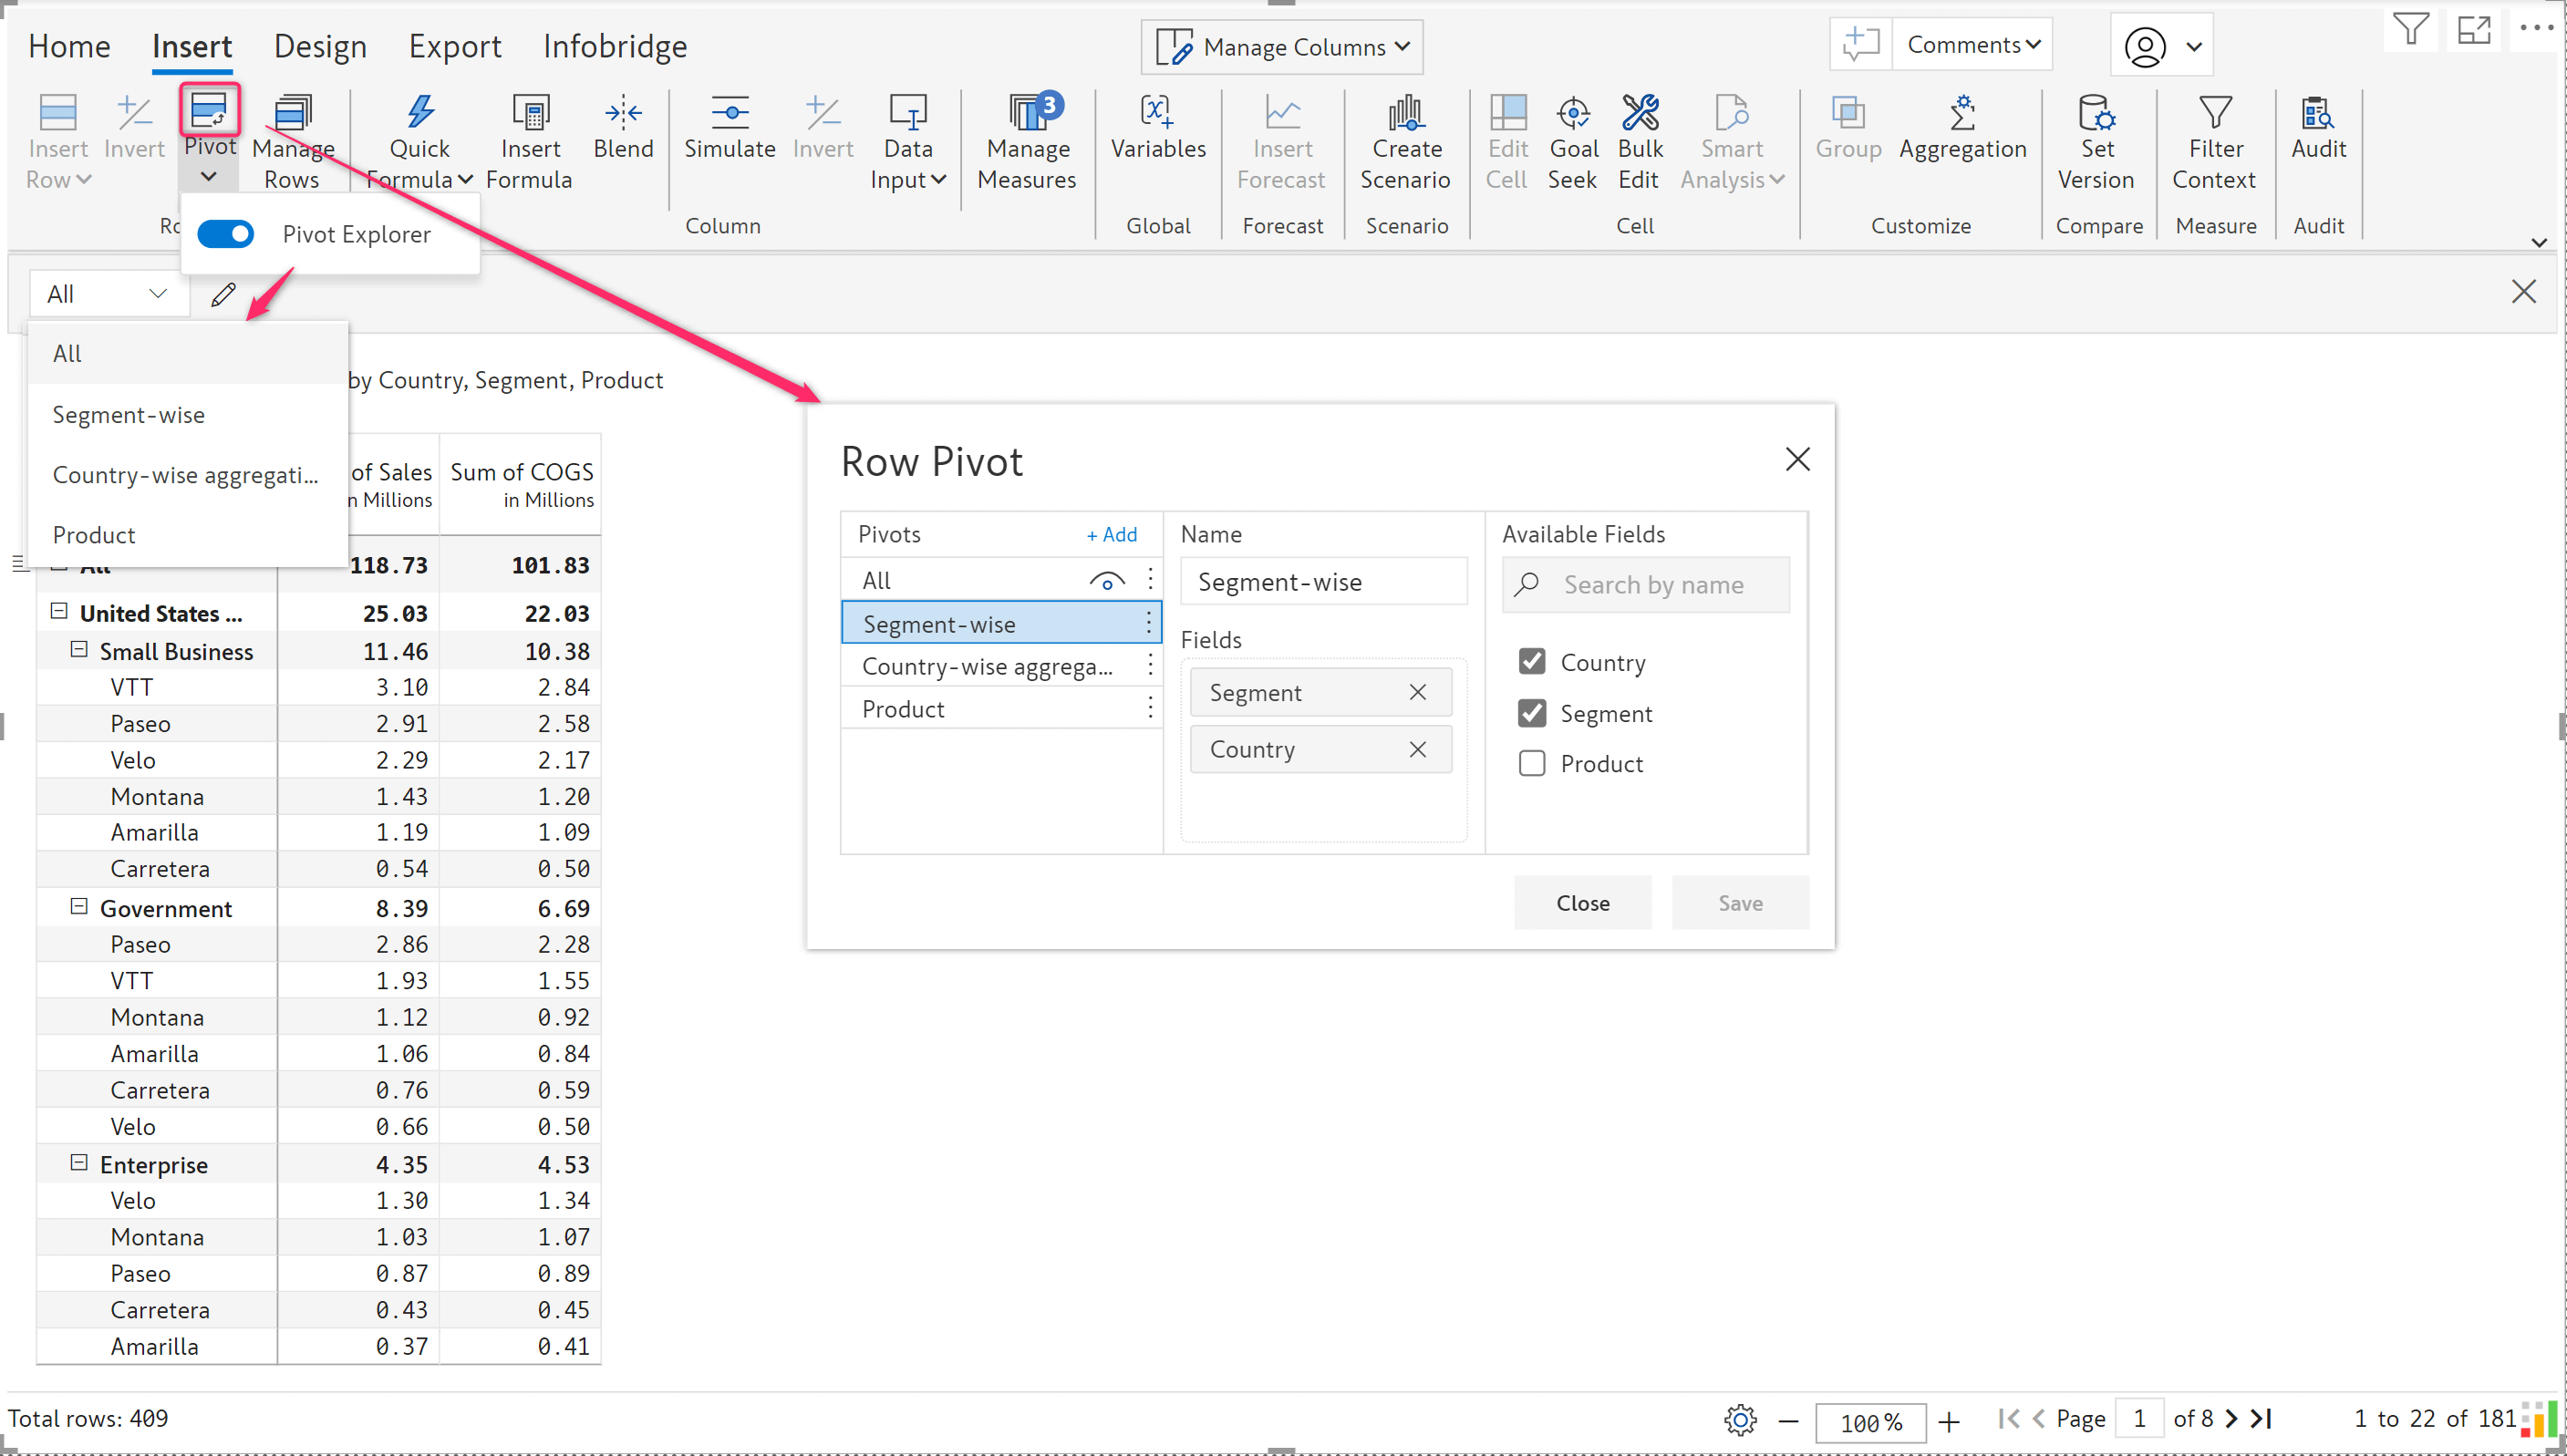
Within each pivot view, you can create data inputs, forecasts, formulas, snapshots, and scenarios corresponding to each combination of dimensions. The pivot view/table you create also lets you enter numbers at the higher level and allocate proportionally to all the relevant sub-levels.
Let us consider the report below, which contains Country -> Segment -> Products. You can now create aggregated views at the Segment/Country level or only at the Product level.
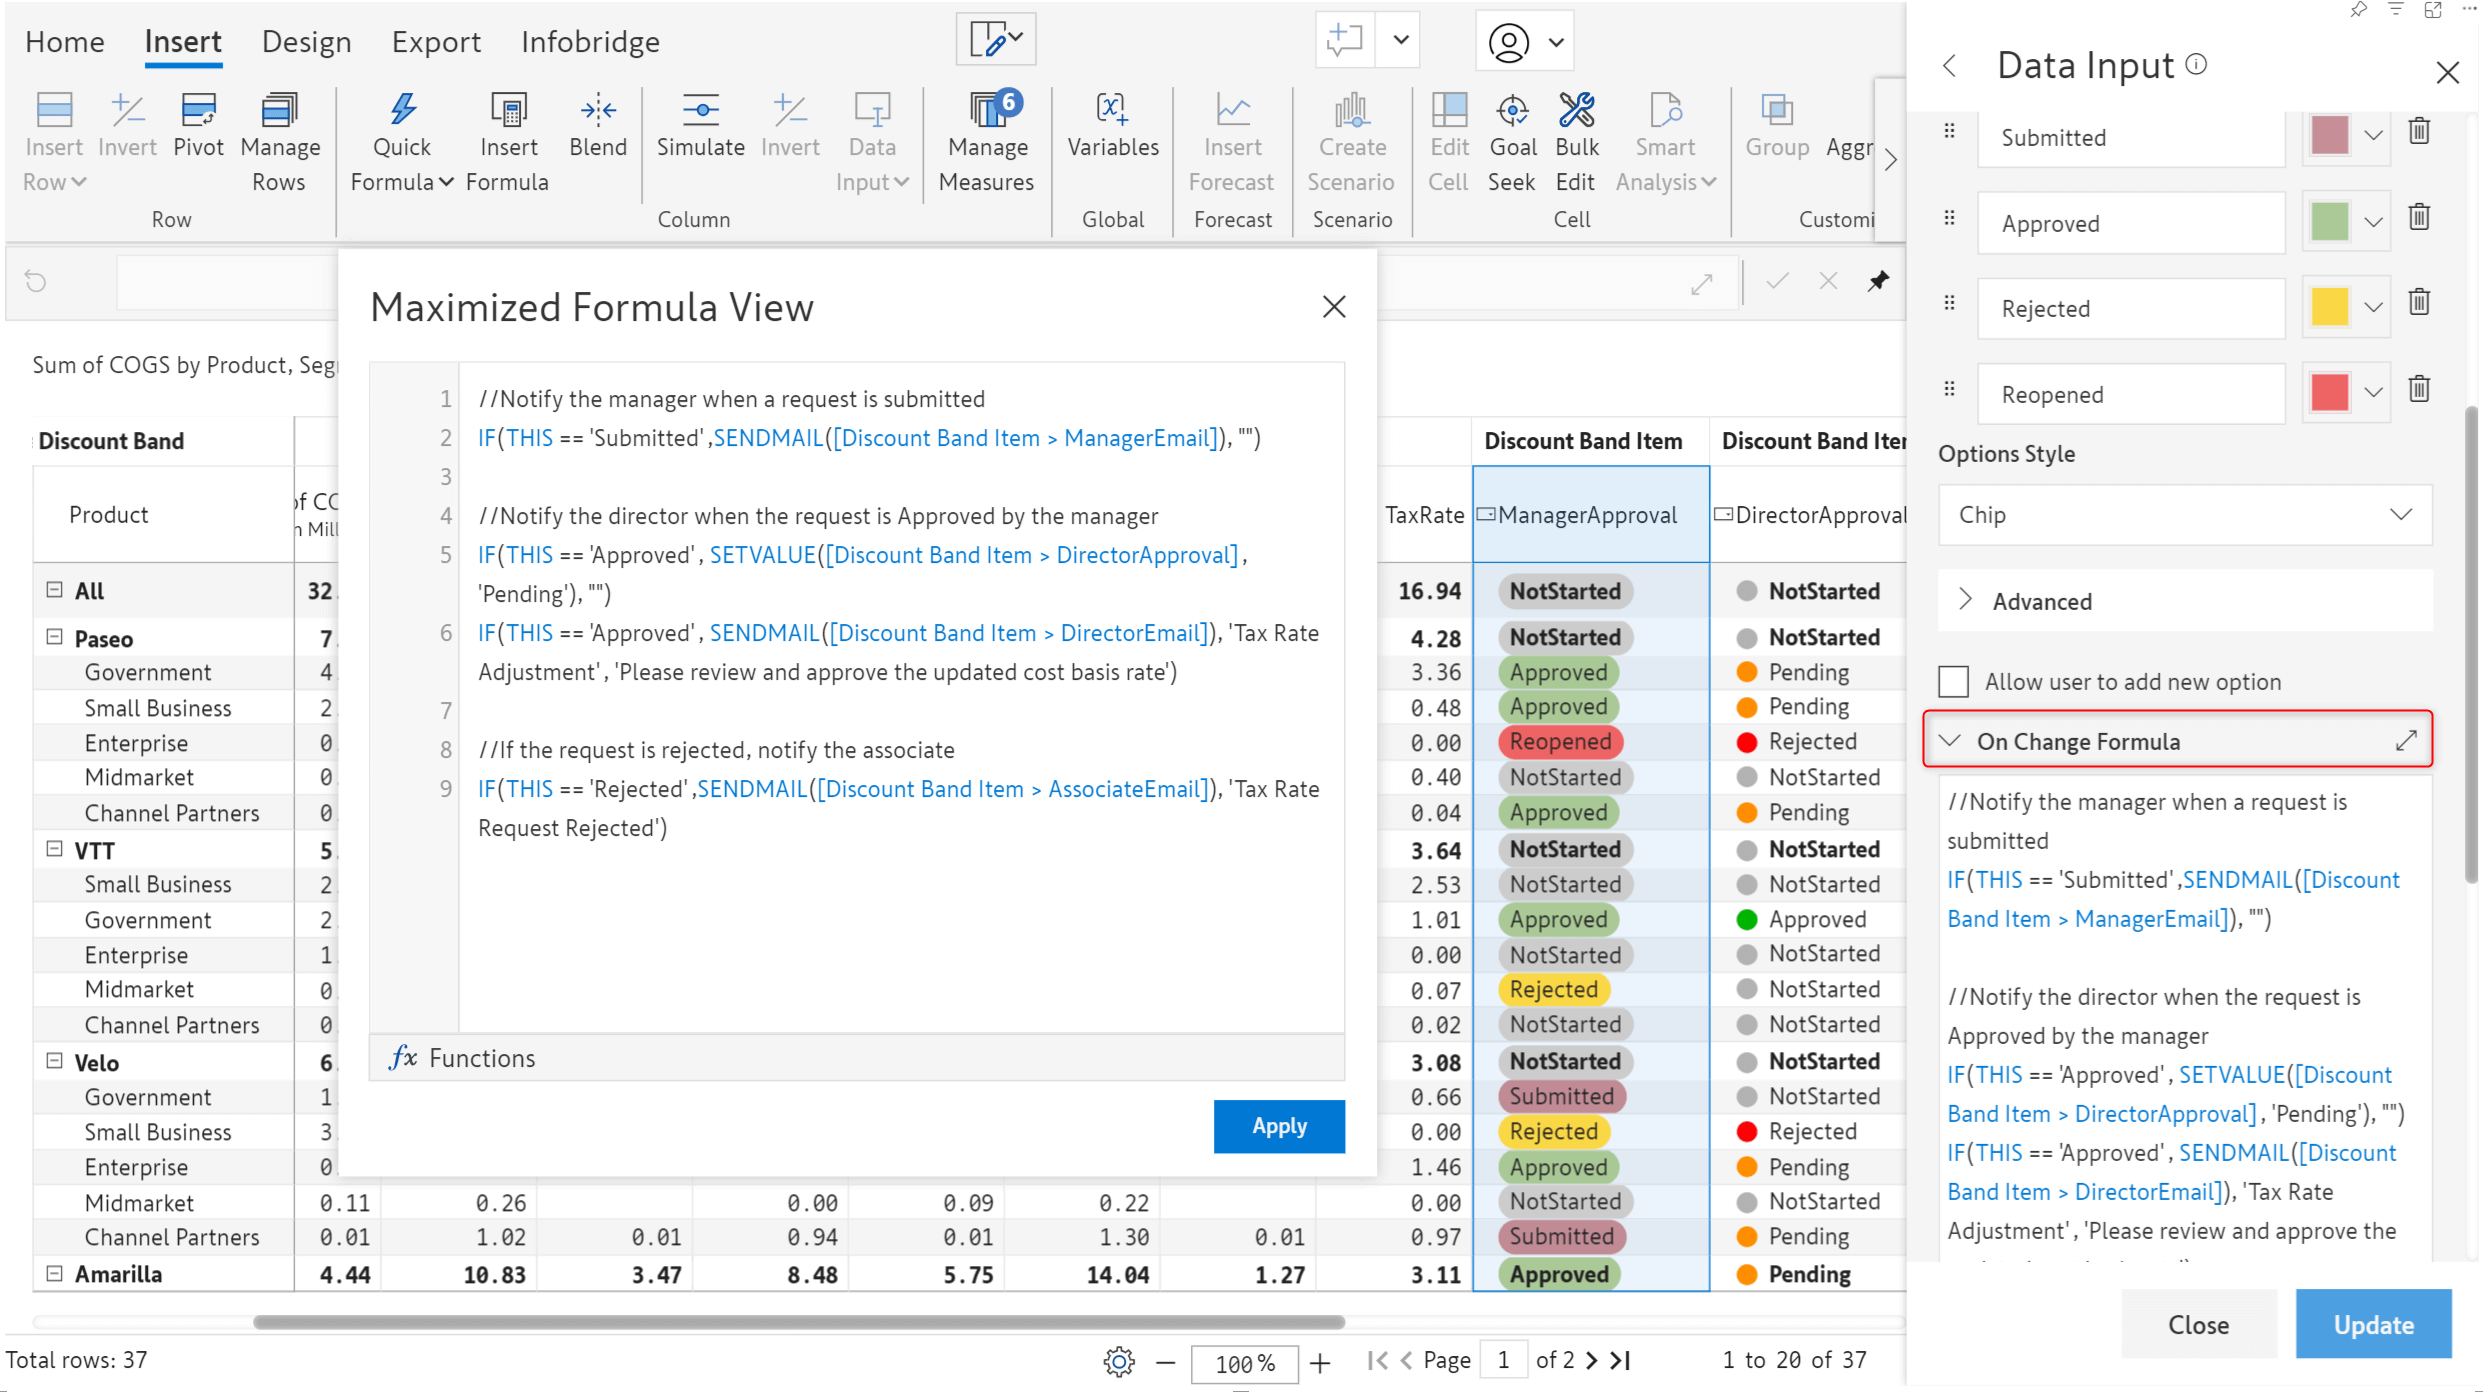
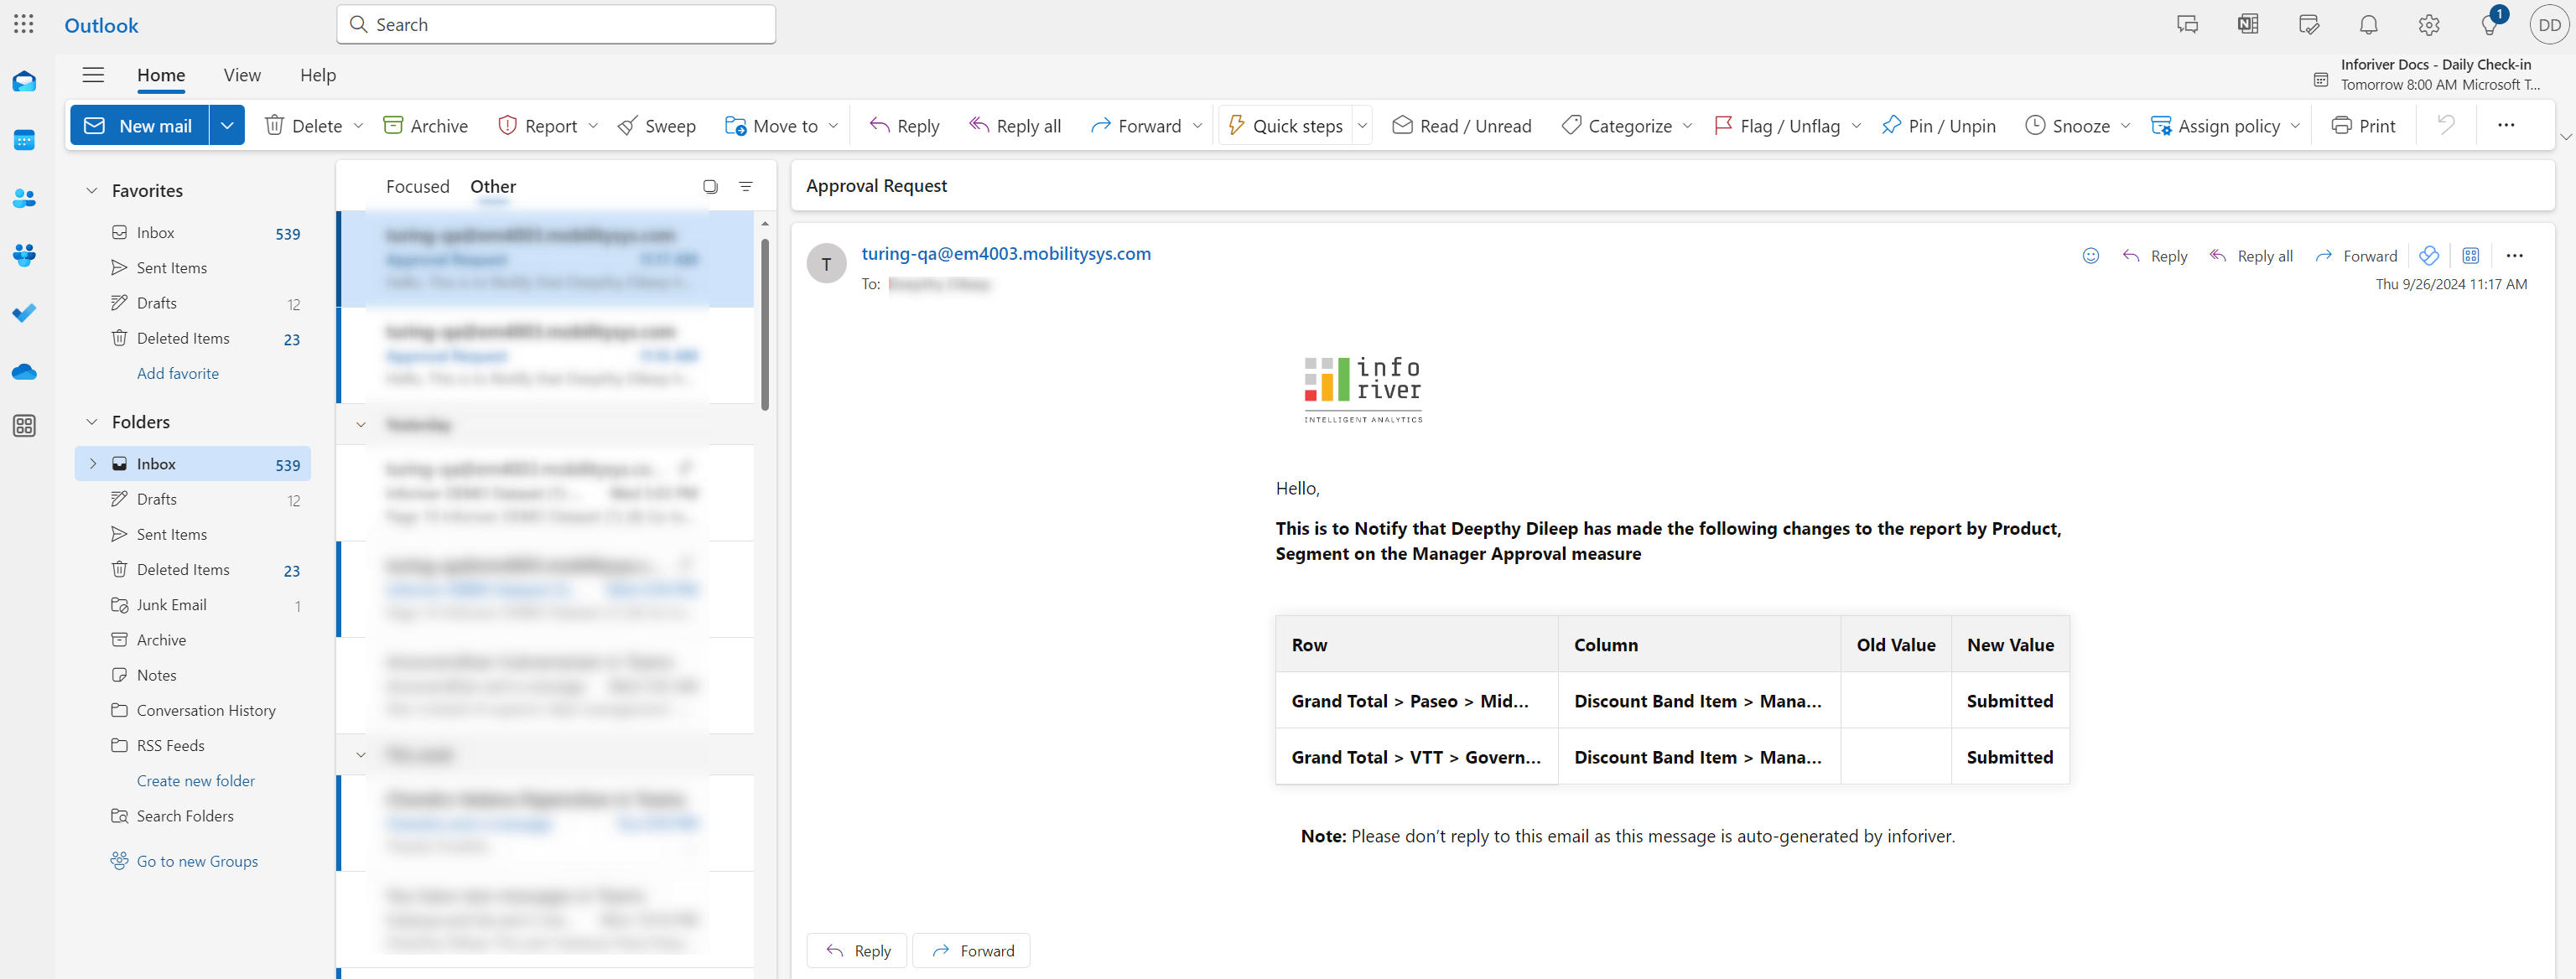
With Inforiver, you can easily set up custom approval workflows based on your unique business cases.
When a data input or forecast value is updated, you can trigger actions like sending a notification email or setting a value in a related field. This feature comes into the picture when you need to set up an approval workflow for values changed in the report: a report user updates a value, an approval/notification email is sent to their manager, and the manager can approve or reject the update by selecting the appropriate status from the manager approval dropdown.
Consider this report where a user can update the Tax Rate:
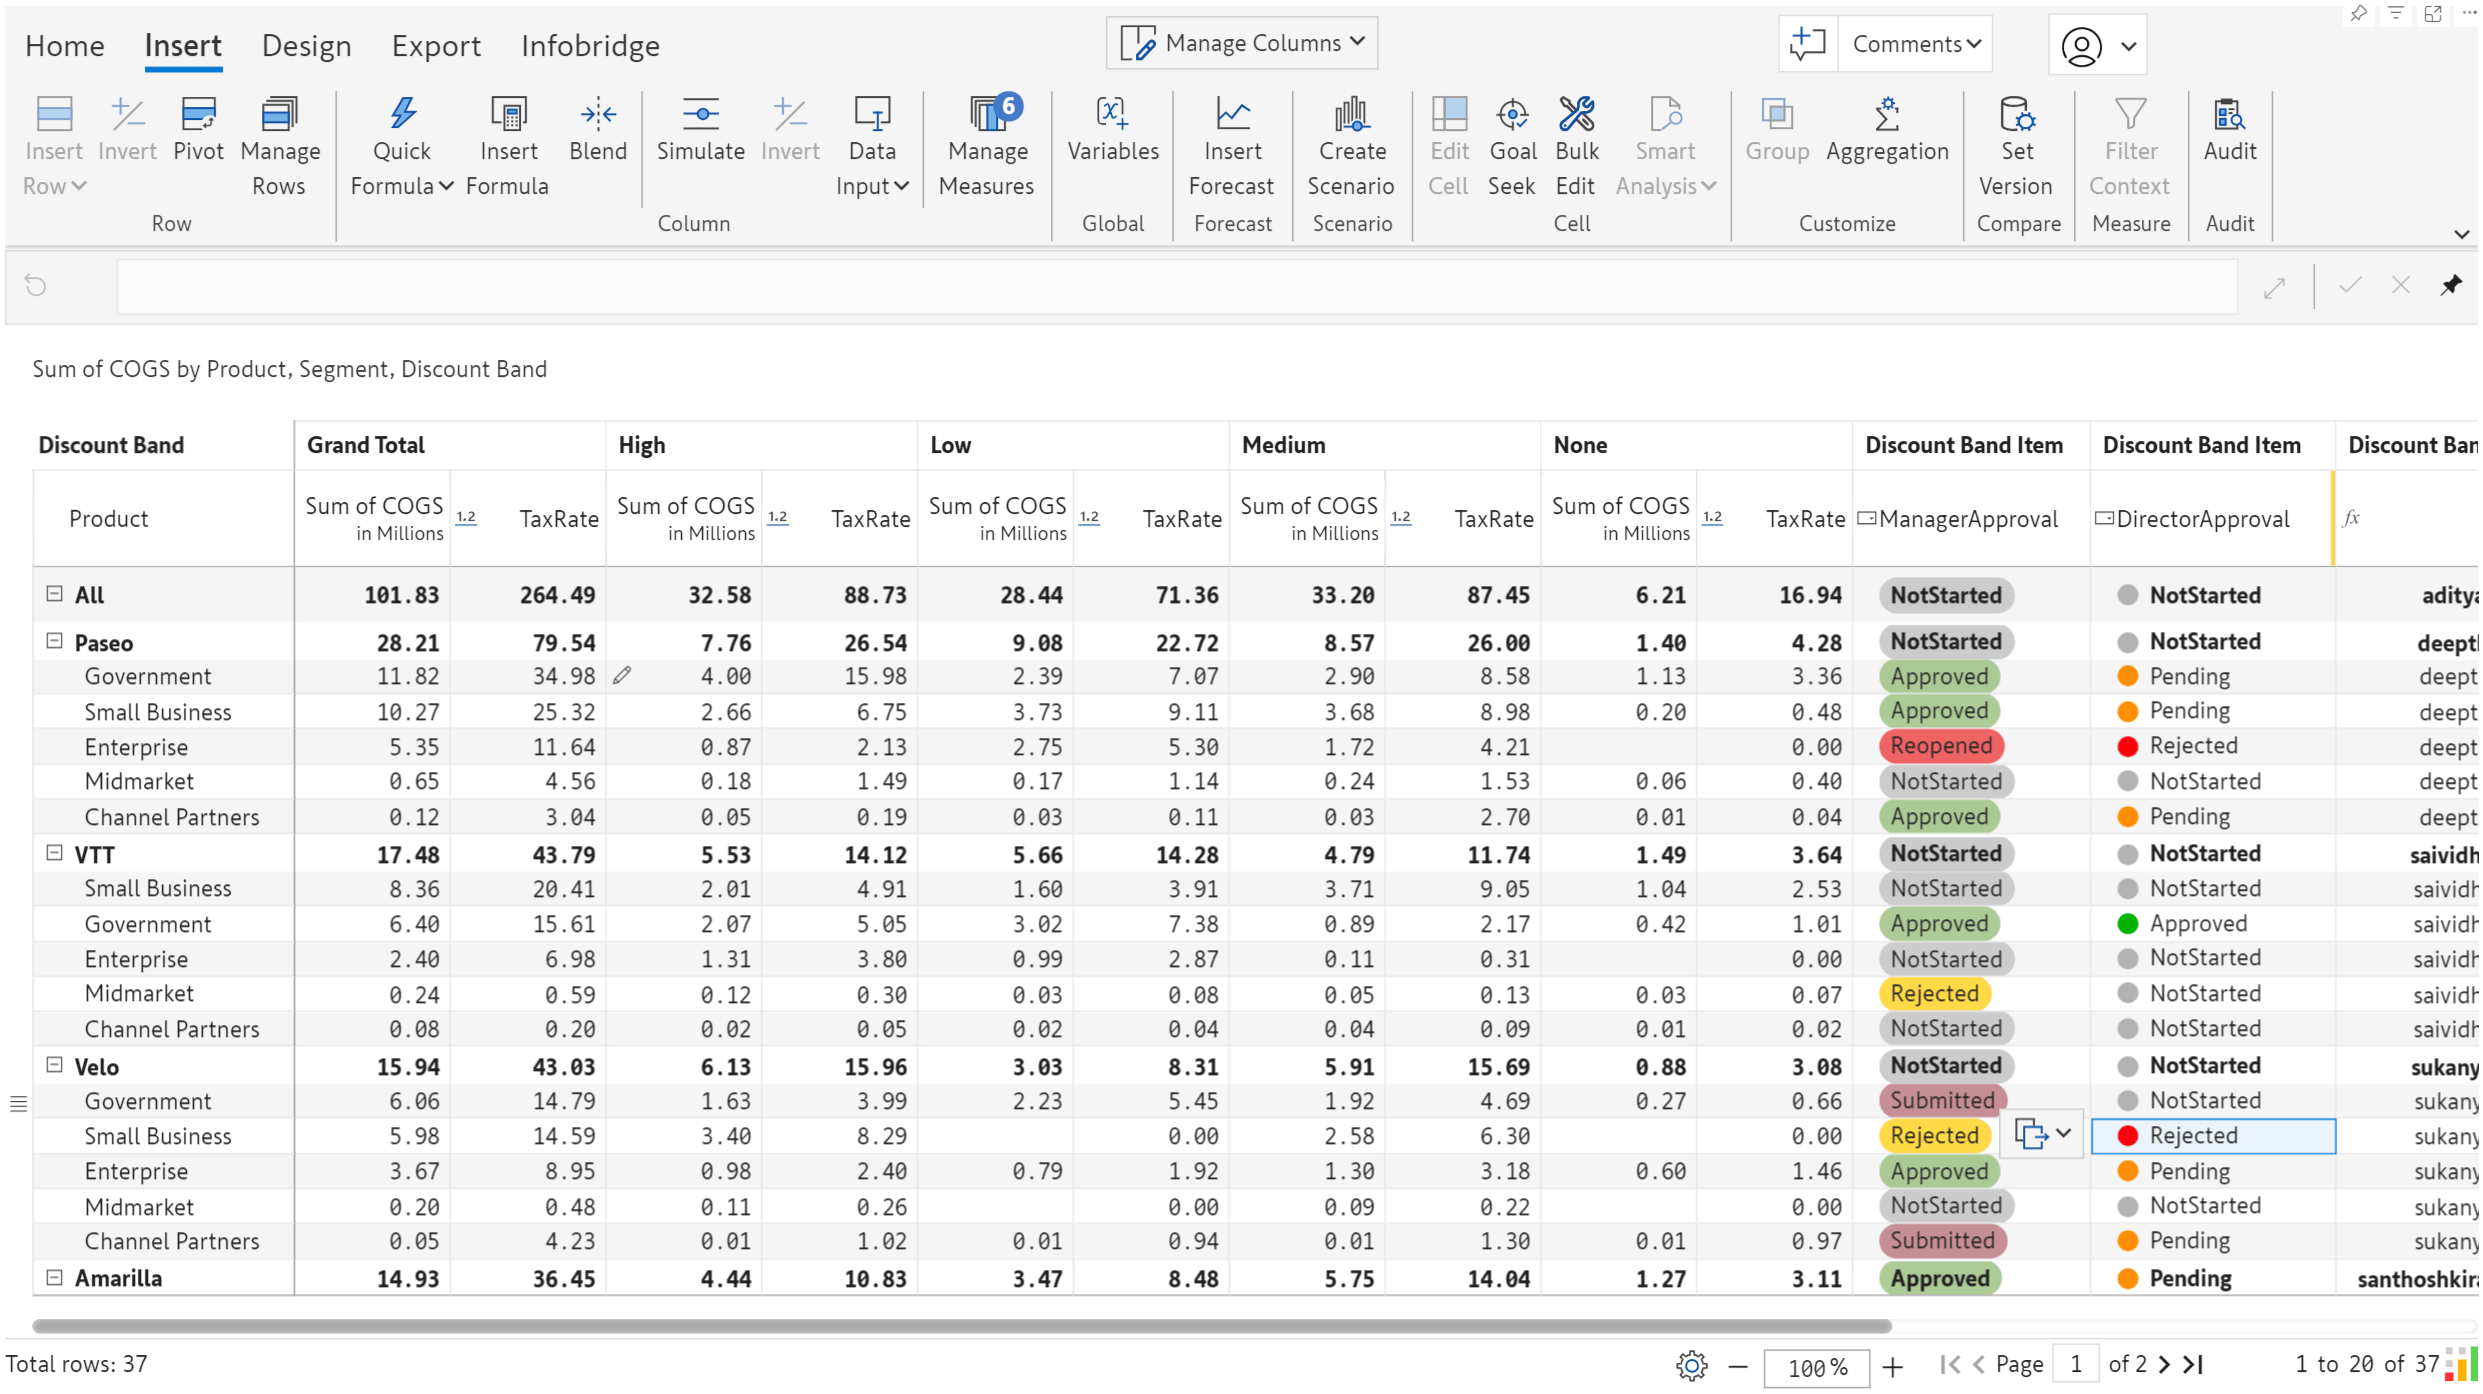
After a user enters/updates a value in the TaxRate data input field, they should manually change the ManagerApproval status to ‘Submitted.’ In the ManagerApproval single select, we’ve listed the actions for each status change in the On Change Formula section.
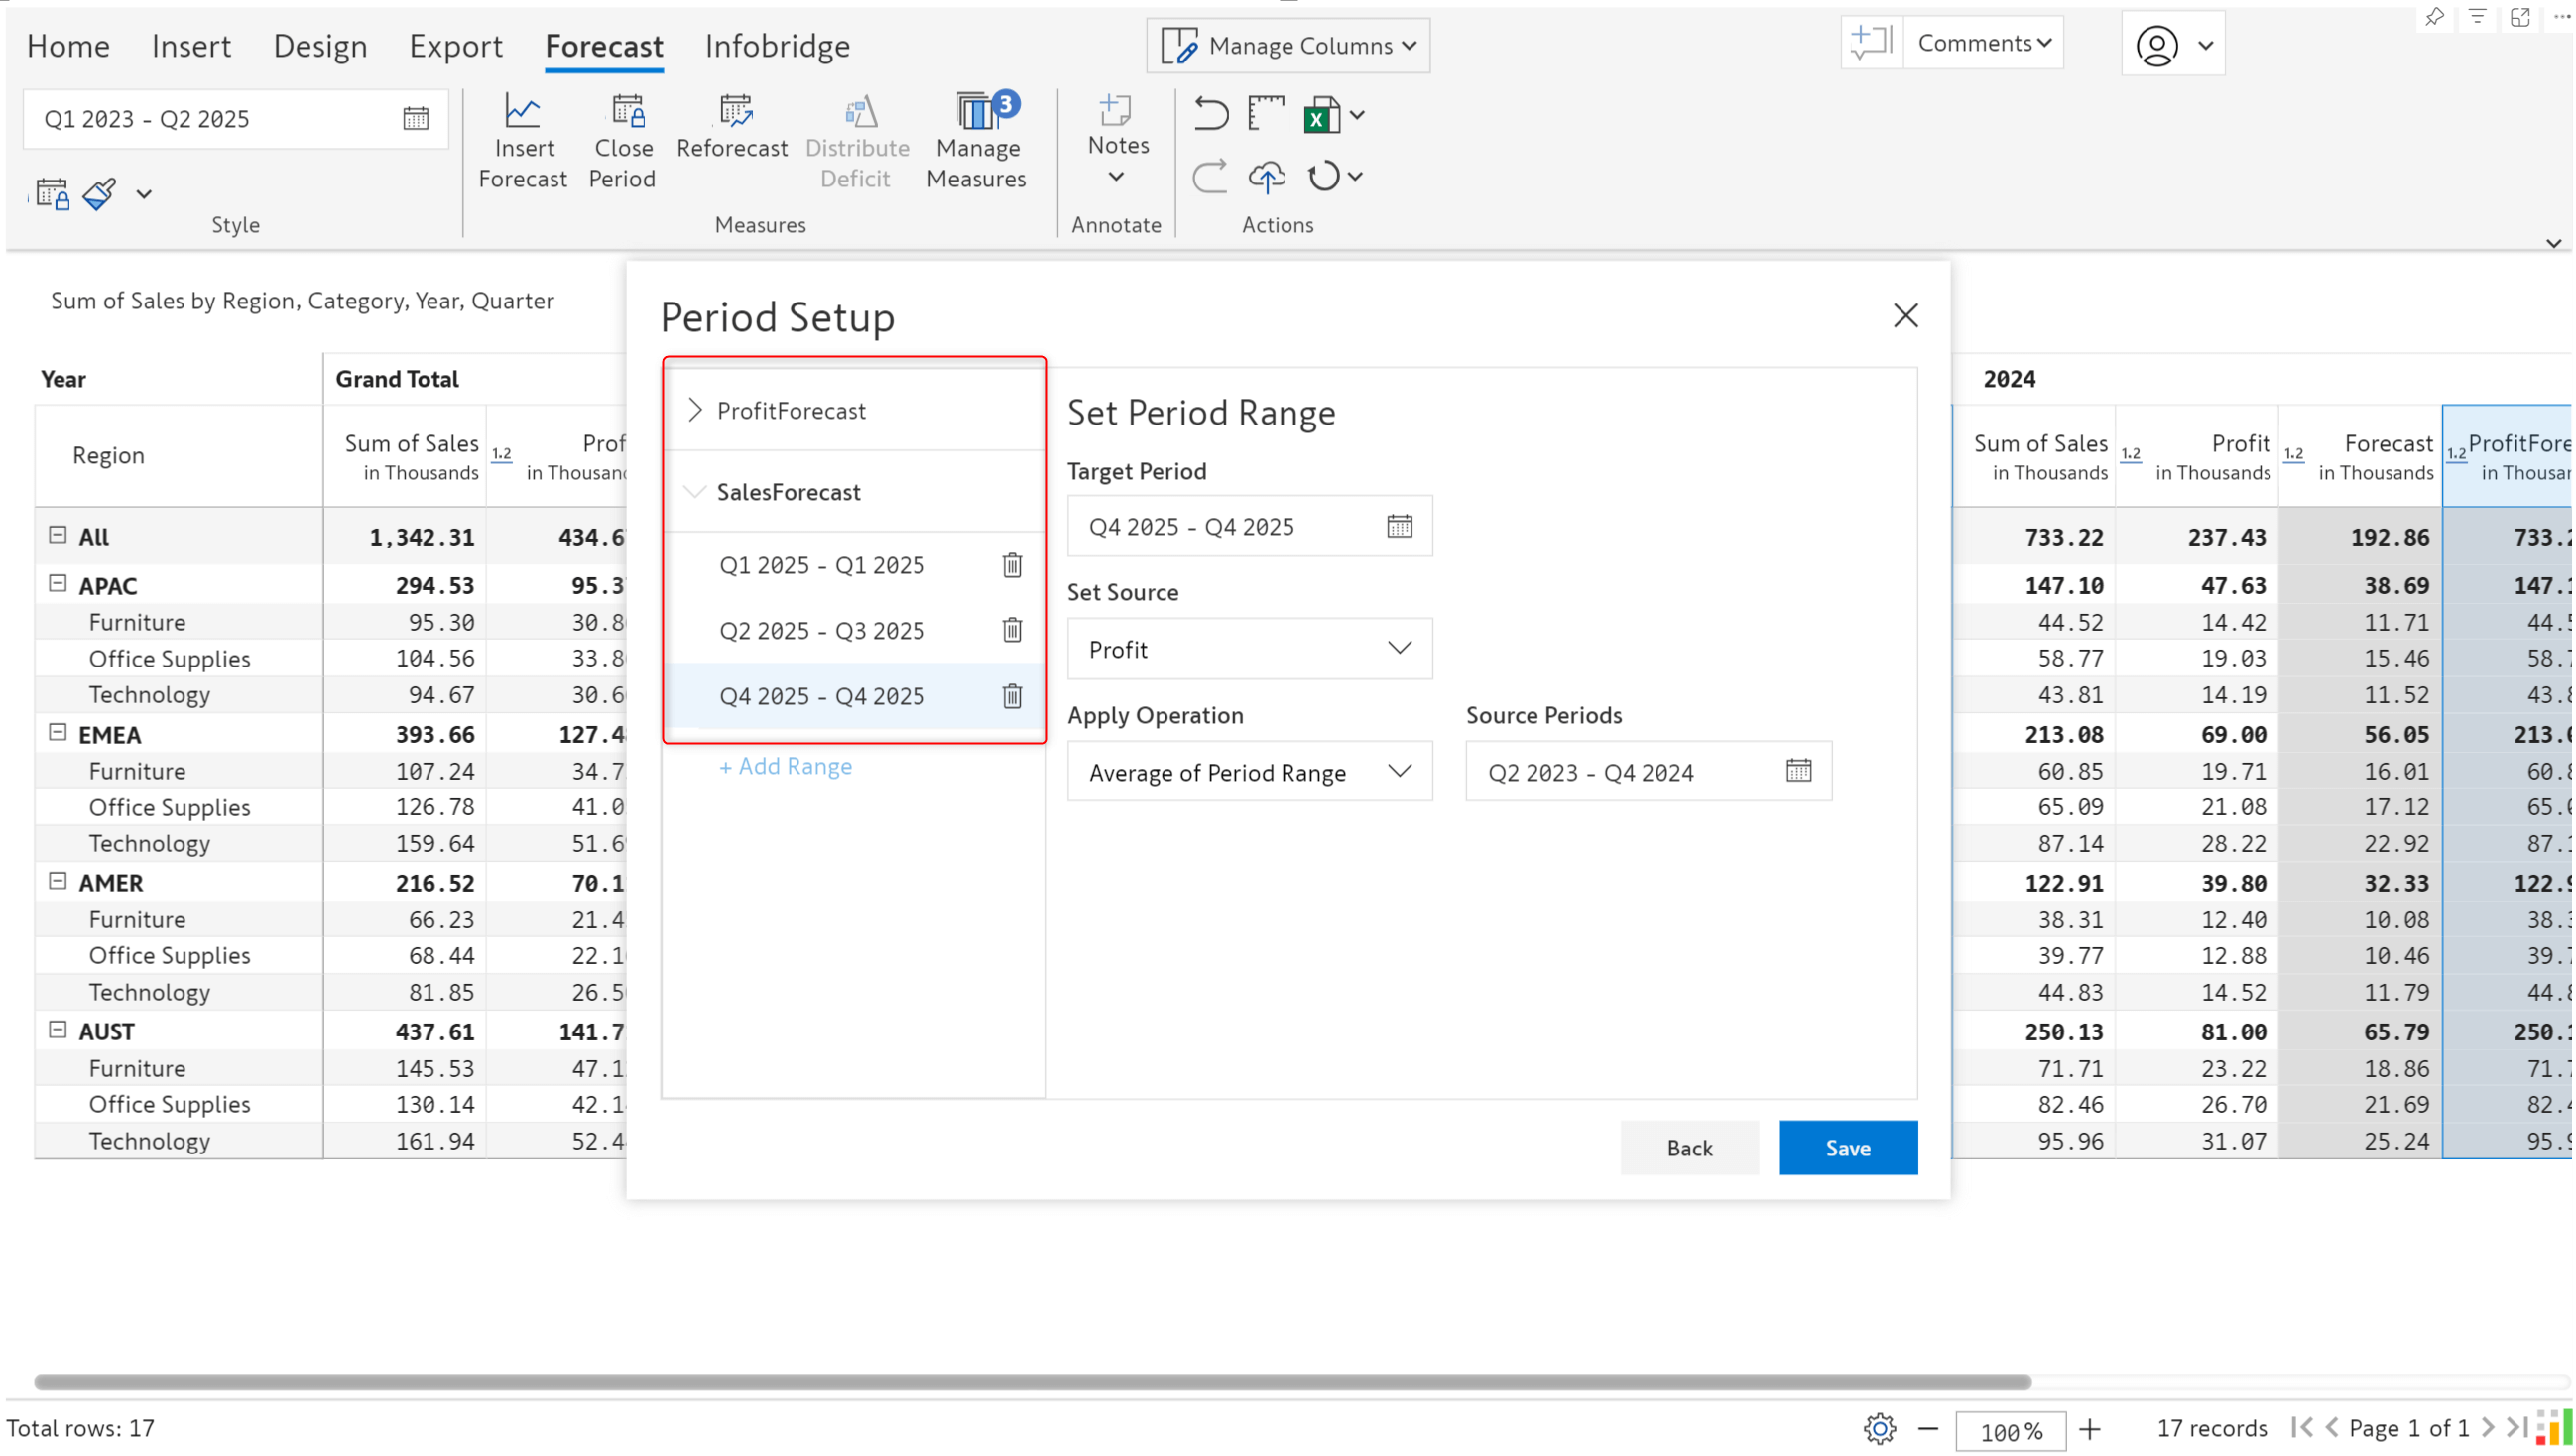
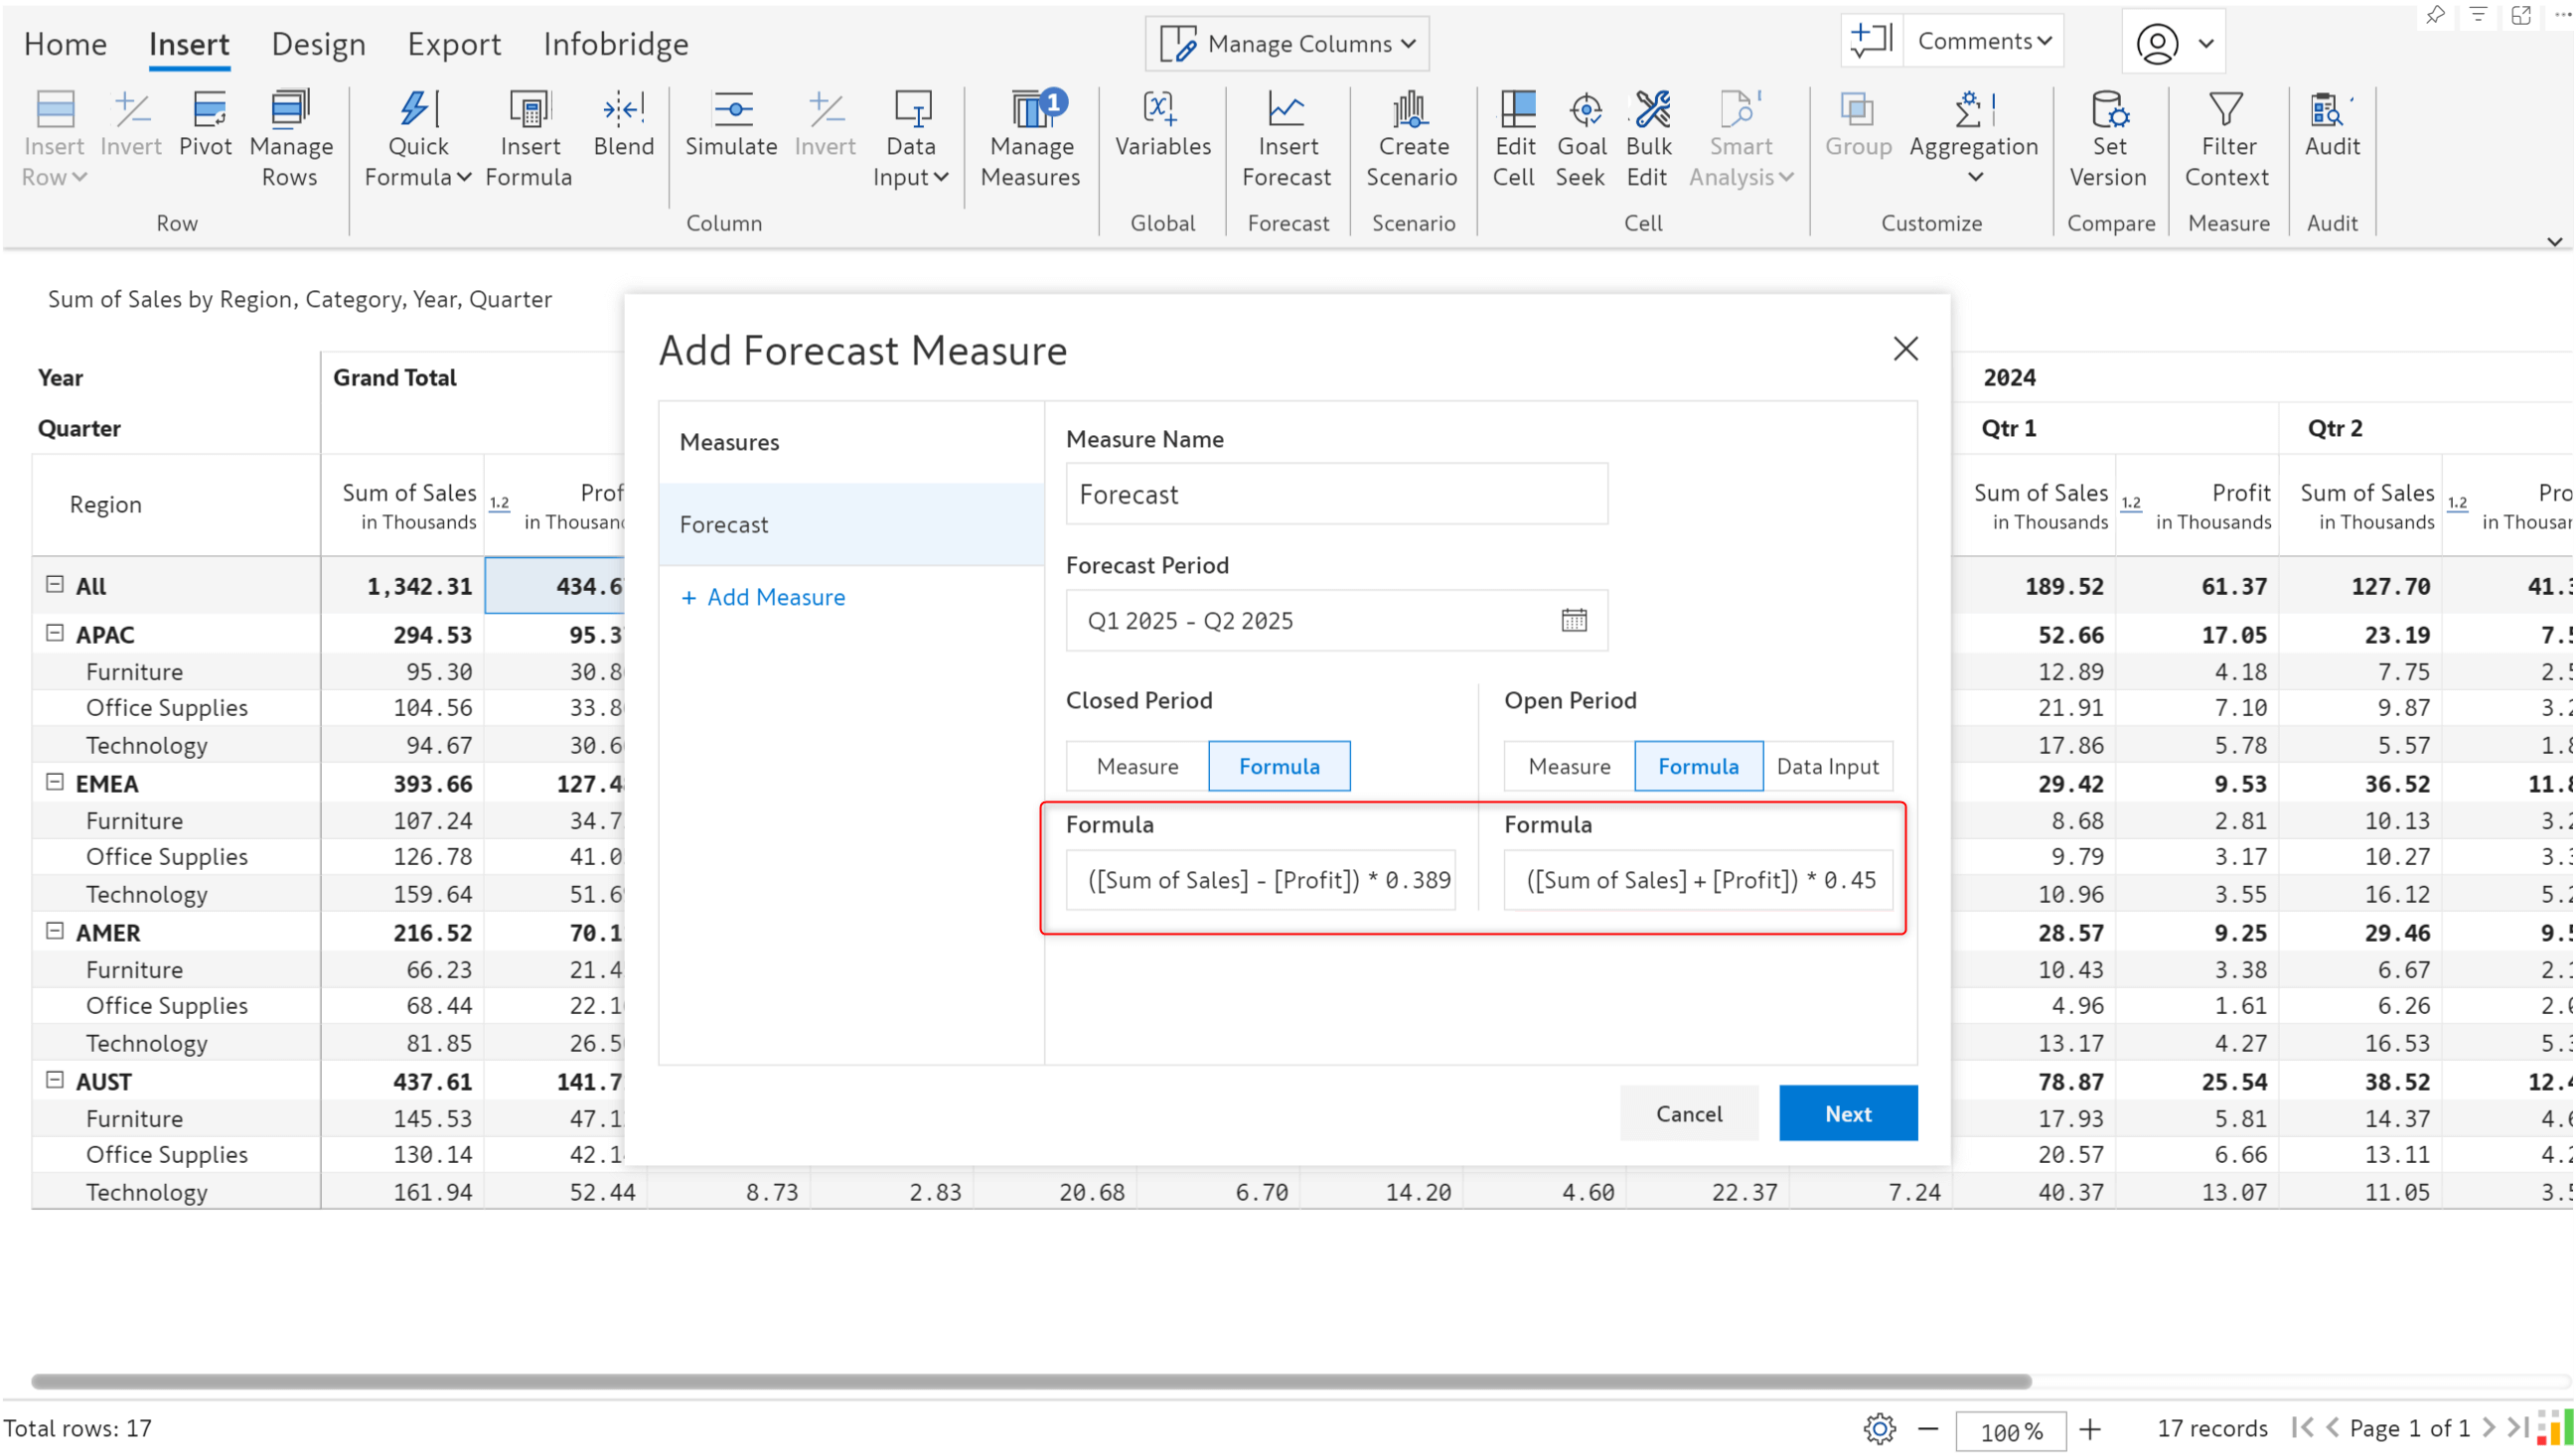
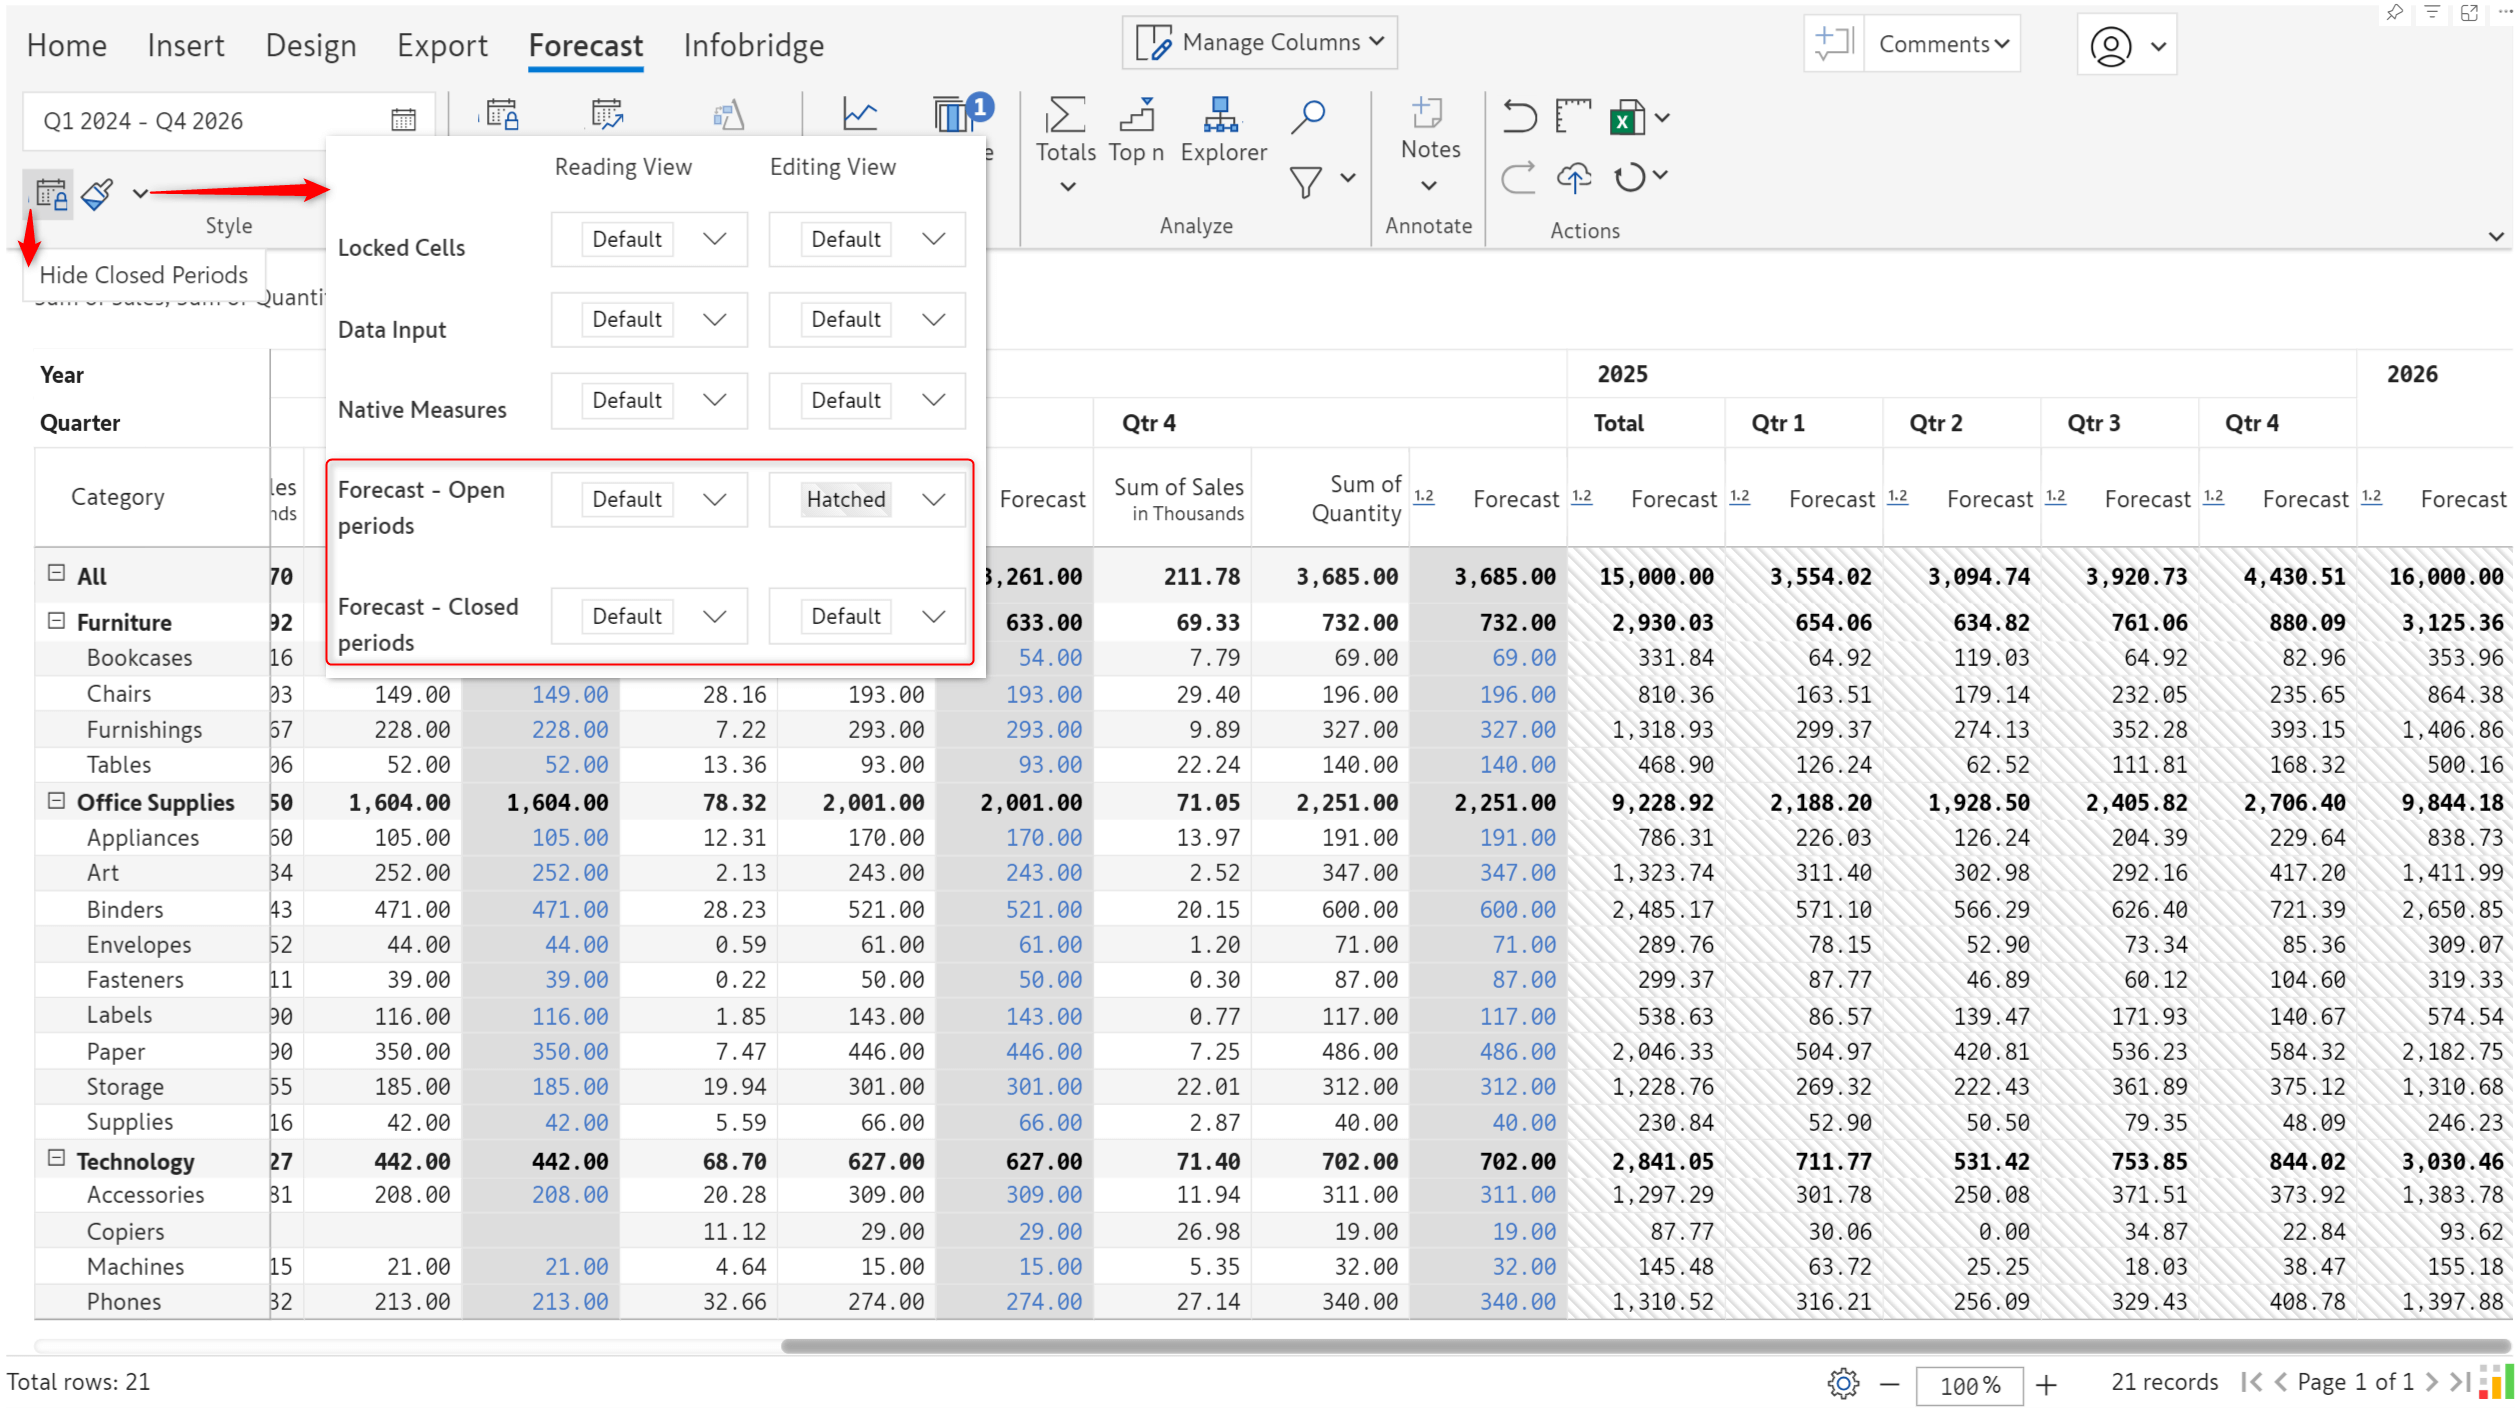
The latest version of Inforiver ships with an advanced, more intuitive forecasting feature that provides greater power and a more comprehensive array of configuration options. Forecasts created in earlier versions of Inforiver will be migrated to the new forecasting interface.
With the new forecast user interface, you can,
Using the new scheduled backup feature, you can capture read-only backups of Inforiver input measures within the same visual.
Unlike Snapshots, this feature not only automates the data archiving process but also lets you use these read-only measures in a formula for further analysis inside the visual, if required. You can create daily, weekly, or monthly backup schedules as shown below:
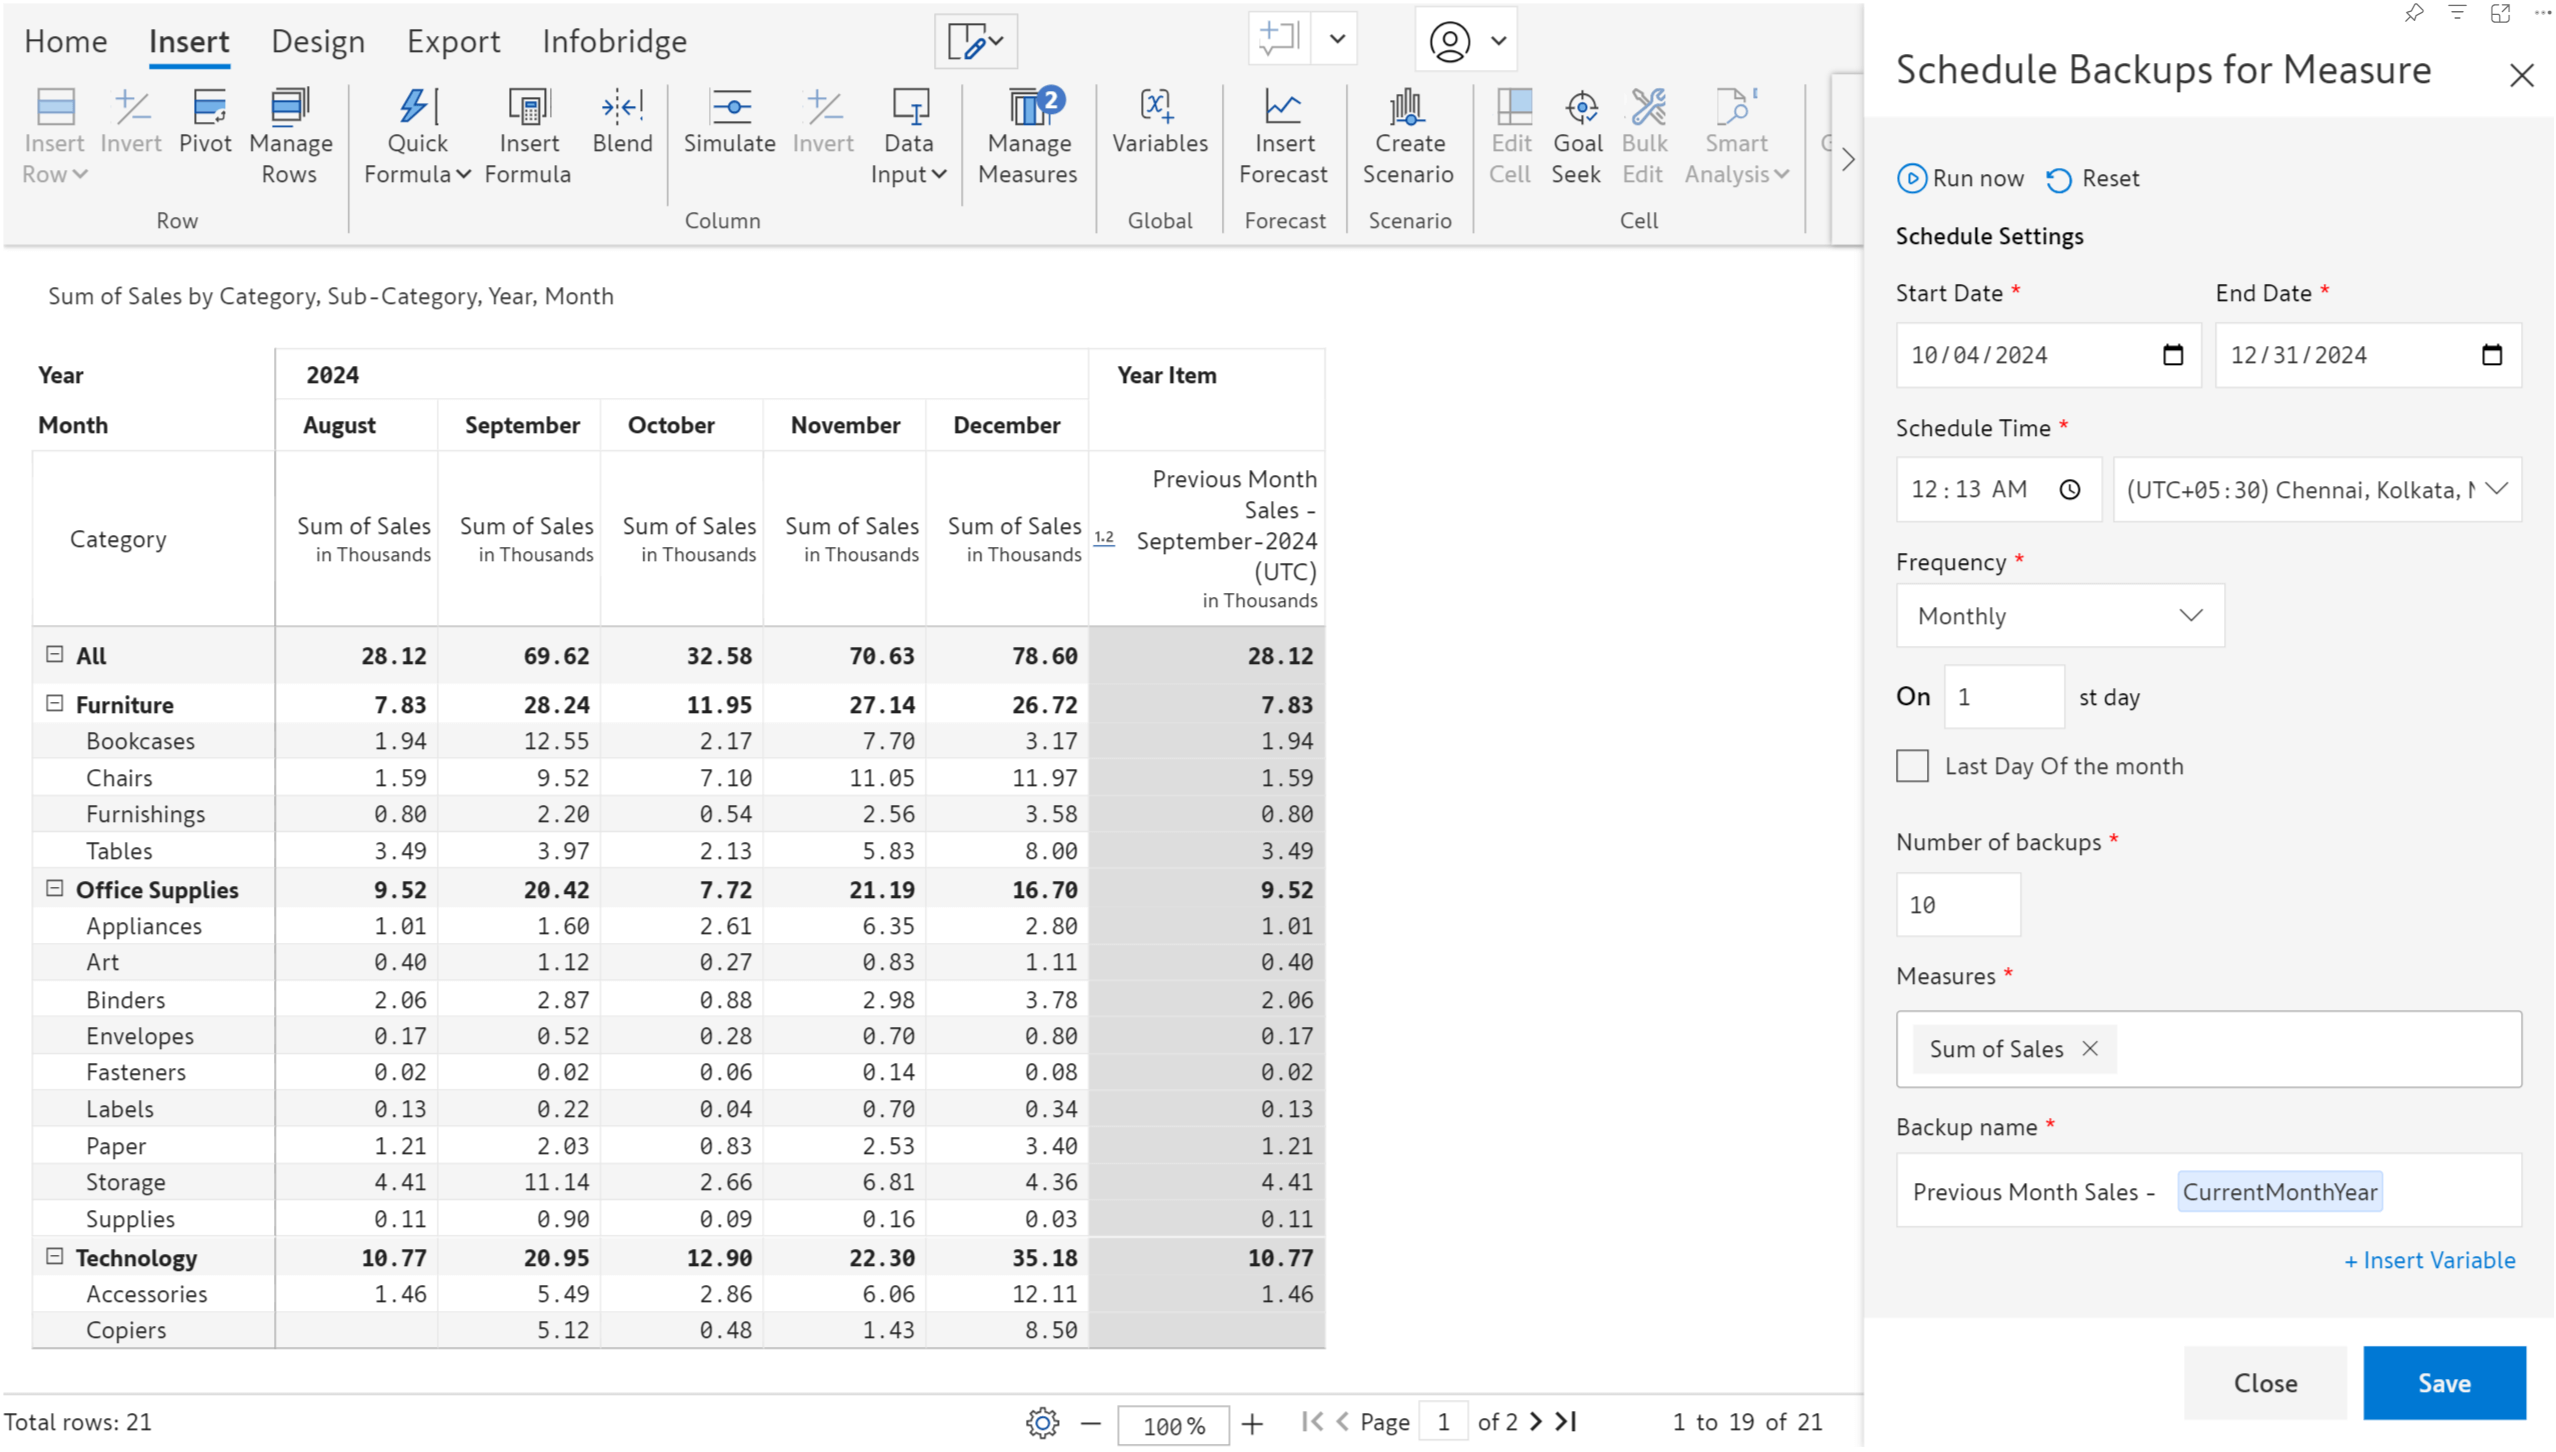
The report below shows a daily measure backup:
In addition to the above, there are a few other features you might not want to miss: creating scenarios for specific timeframes, collaborative adjustments and approval workflow within Inforiver visuals, quick formula to calculate simulation variances, etc.
Please refer to our release notes for a comprehensive list of requirements, features, and bug fixes.
Learn more about Inforiver
To learn more about the latest from Inforiver and why we are garnering recognition from industry experts, check out our newest brochure.
Inforiver and all our planning and analytics products continue to be updated to provide a diverse range of users with optimal performance. With continual improvements and innovations planned, we welcome your feedback.
If you’re ready to level up your planning, reporting, and analytics, try our products for free today.

Inforiver helps enterprises consolidate planning, reporting & analytics on a single platform (Power BI). The no-code, self-service award-winning platform has been recognized as the industry’s best and is adopted by many Fortune 100 firms.
Inforiver is a product of Lumel, the #1 Power BI AppSource Partner. The firm serves over 3,000 customers worldwide through its portfolio of products offered under the brands Inforiver, EDITable, ValQ, and xViz.
 Learn how to elevate FP&A with data visualization best practices for planning, budgeting, and forecasting in Power BI.