Upcoming webinar on 'Inforiver Charts : The fastest way to deliver stories in Power BI', Aug 29th , Monday, 10.30 AM CST. Register Now
Upcoming webinar on 'Inforiver Charts : The fastest way to deliver stories in Power BI', Aug 29th , Monday, 10.30 AM CST. Register Now
At Inforiver, we aim to deliver our users the best BI reporting experience. As part of the September release, strategic features have been integrated from the Writeback Matrix into the Reporting Matrix to provide transformative efficiency gains with features like Bulk Edit, Weekly/daily forecasts, goal-seek, and enhanced data input options.
Inforiver Writeback Matrix provides advanced planning, budgeting, and forecasting capabilities including the ability to schedule reports, simulate and compare data scenarios, write back your report data to database or cloud destinations, and inter-visual connected planning with Infobridge.
Writeback Matrix visuals are used to demonstrate the features in this blog post. The toolbar may visually appear slightly different from the Reporting Matrix, but the industry-leading functionality remains the same. A user login is not required for the Reporting Matrix.
The features are organized by toolbar sections so it is easy to jump to specific sections of interest:
1.1. Add default date value for date data input column
1.2. Redesigned interface for creating custom hierarchies
2.1. Daily and weekly forecasts
2.2. Aggregation for sub-total forecasts
3. Visual formulas and aggregation
3.1. Row and column aggregation
3.3. Line number and error display in the formula editor
5. Disable bookmarks in reading view
Blank rows and columns can diminish the appeal of a tabular report. When you have a data input field, manually entering or copying values in a report with thousands of rows can be tedious. Inforiver now provides a default option for all data input fields.
The latest version provides multiple options to set default values:
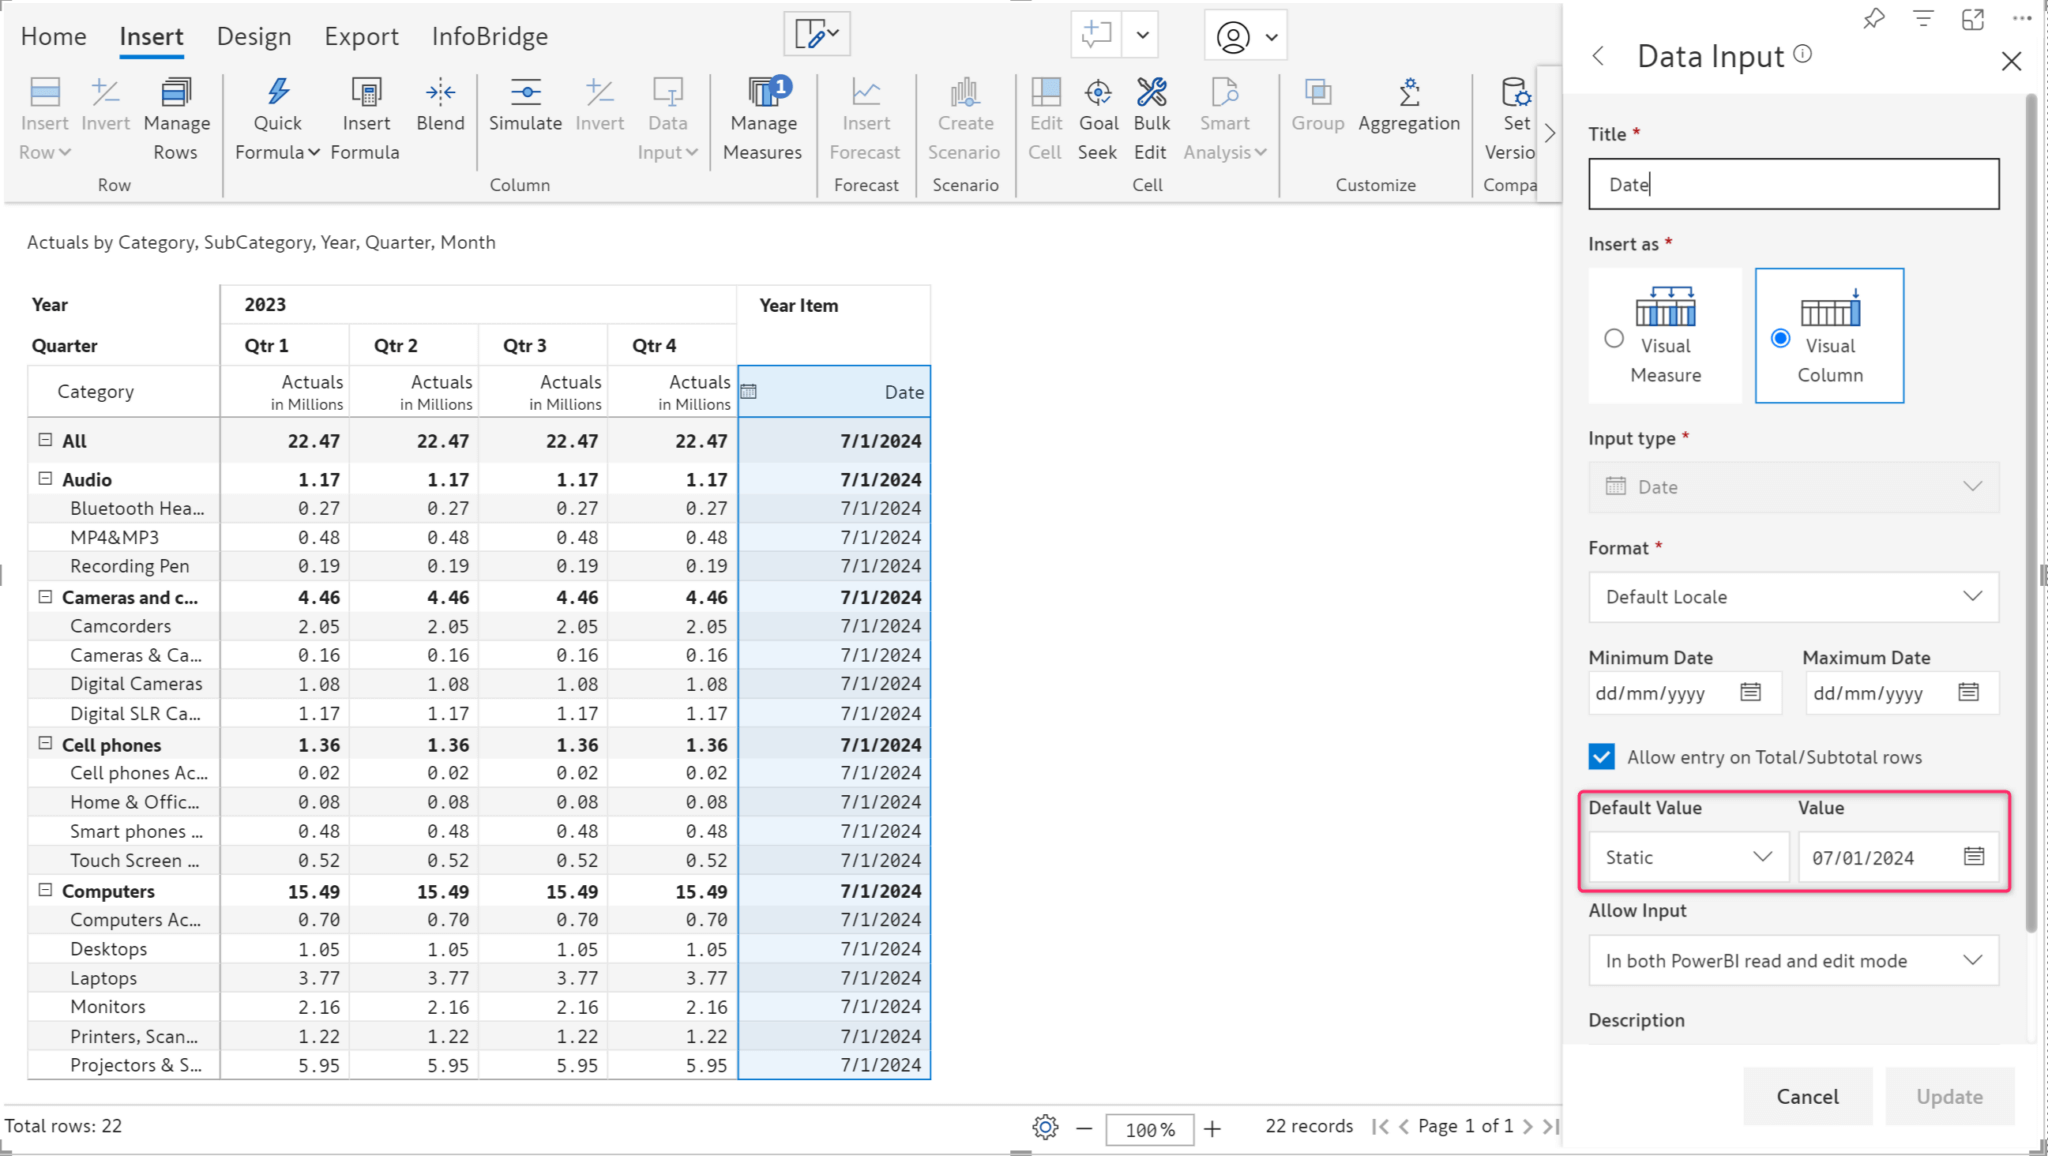
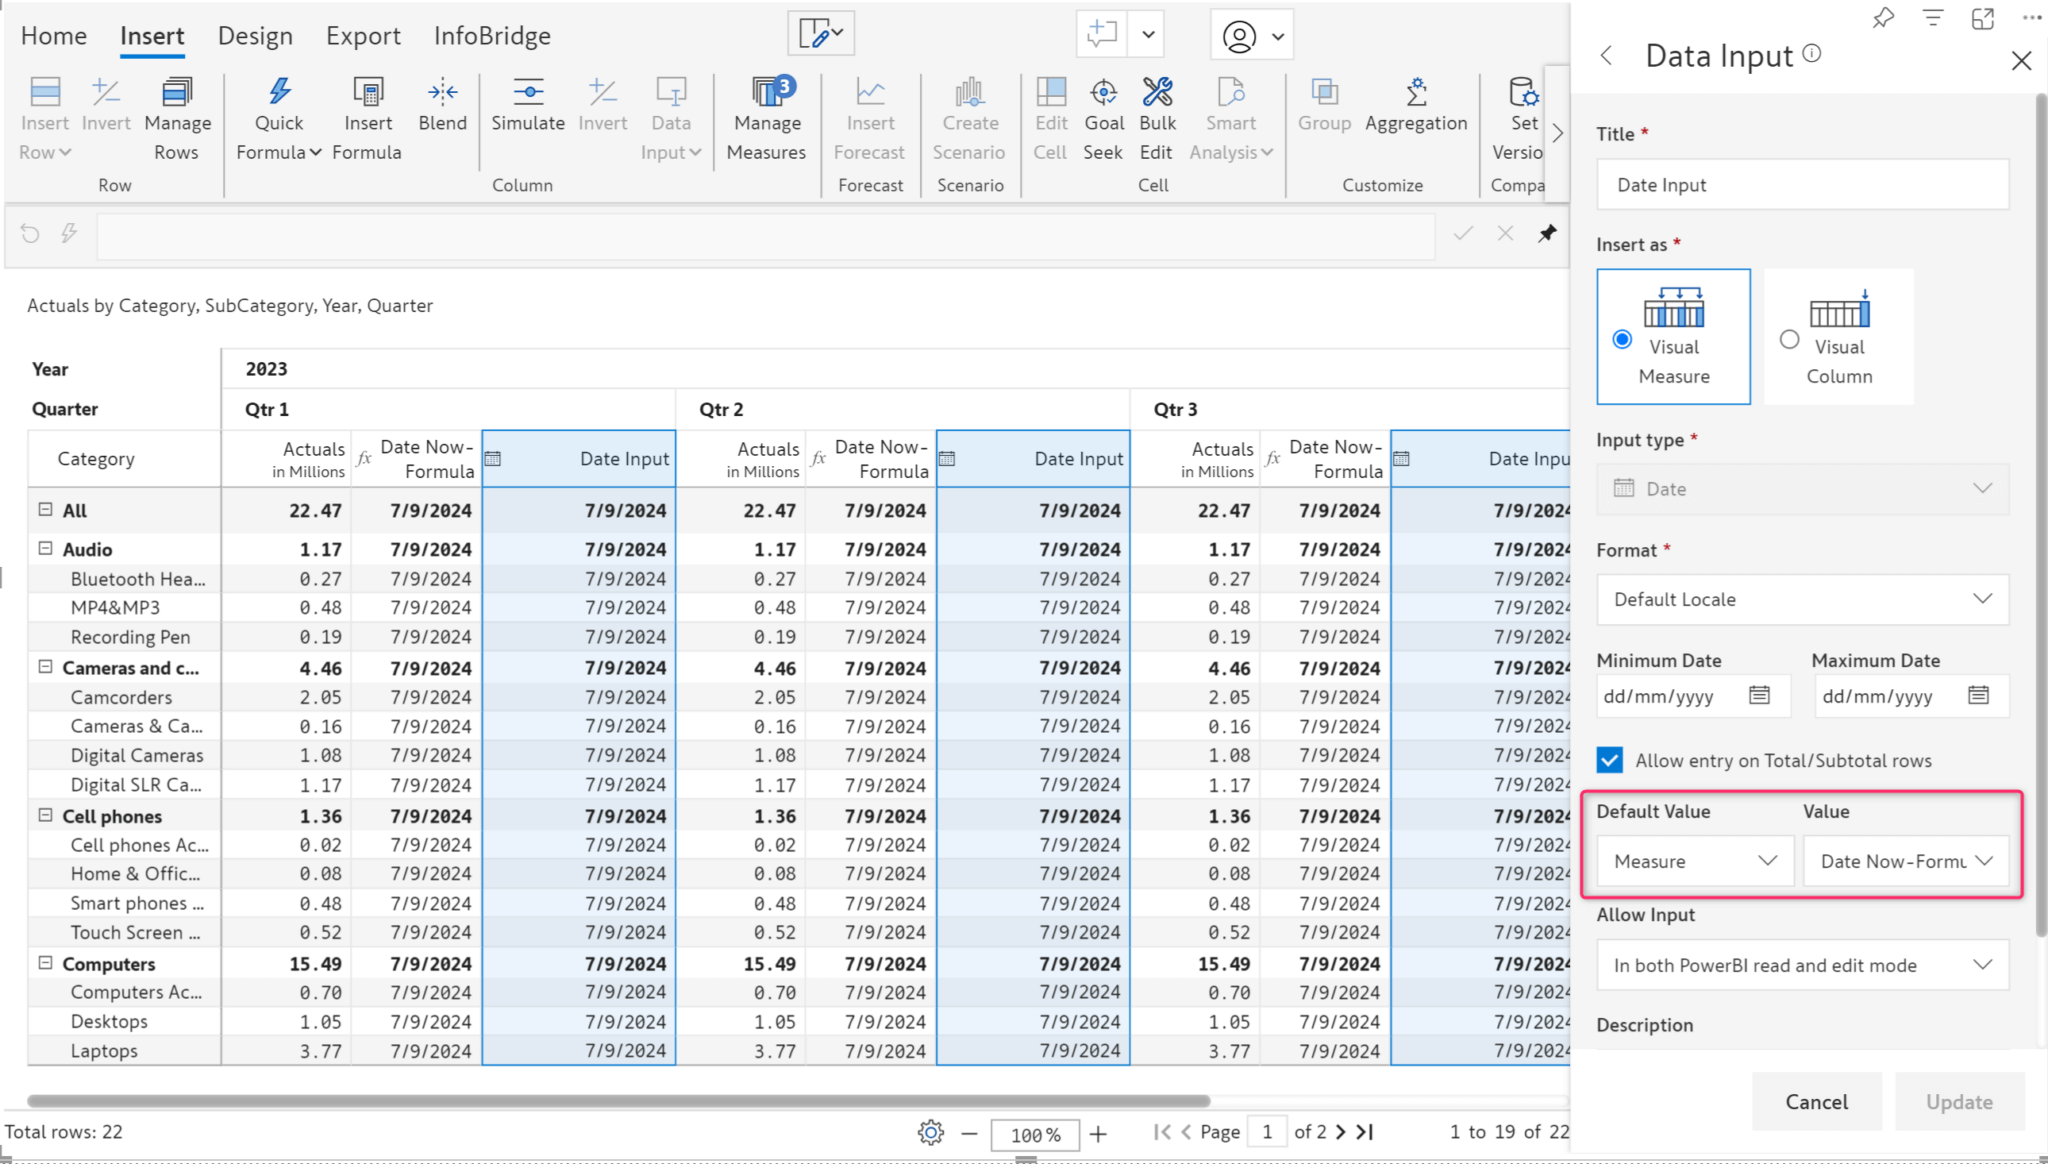
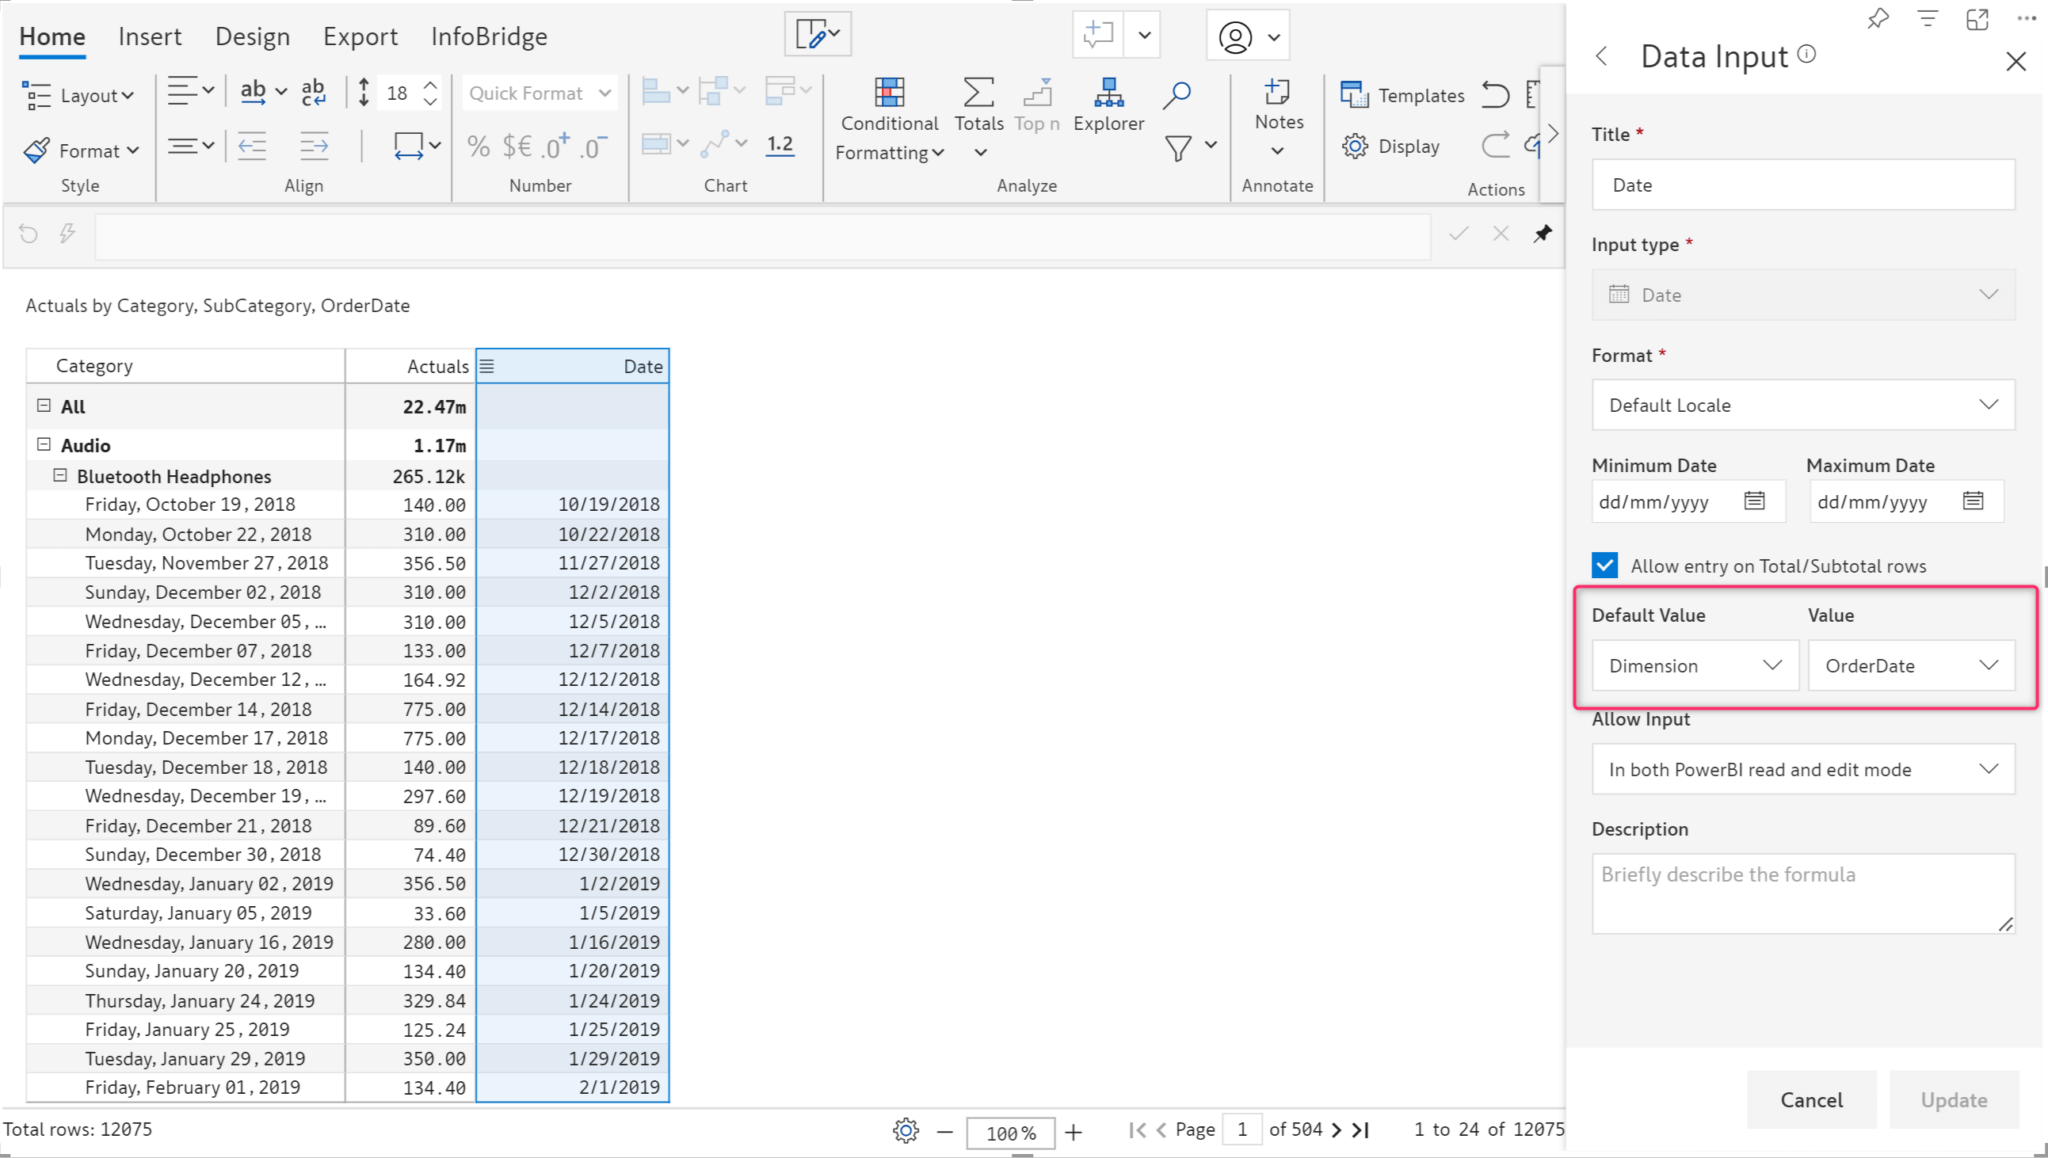
The default option is available for both visual measures and visual columns. Invalid date format errors are implicitly handled as blanks for a clean export and writeback.
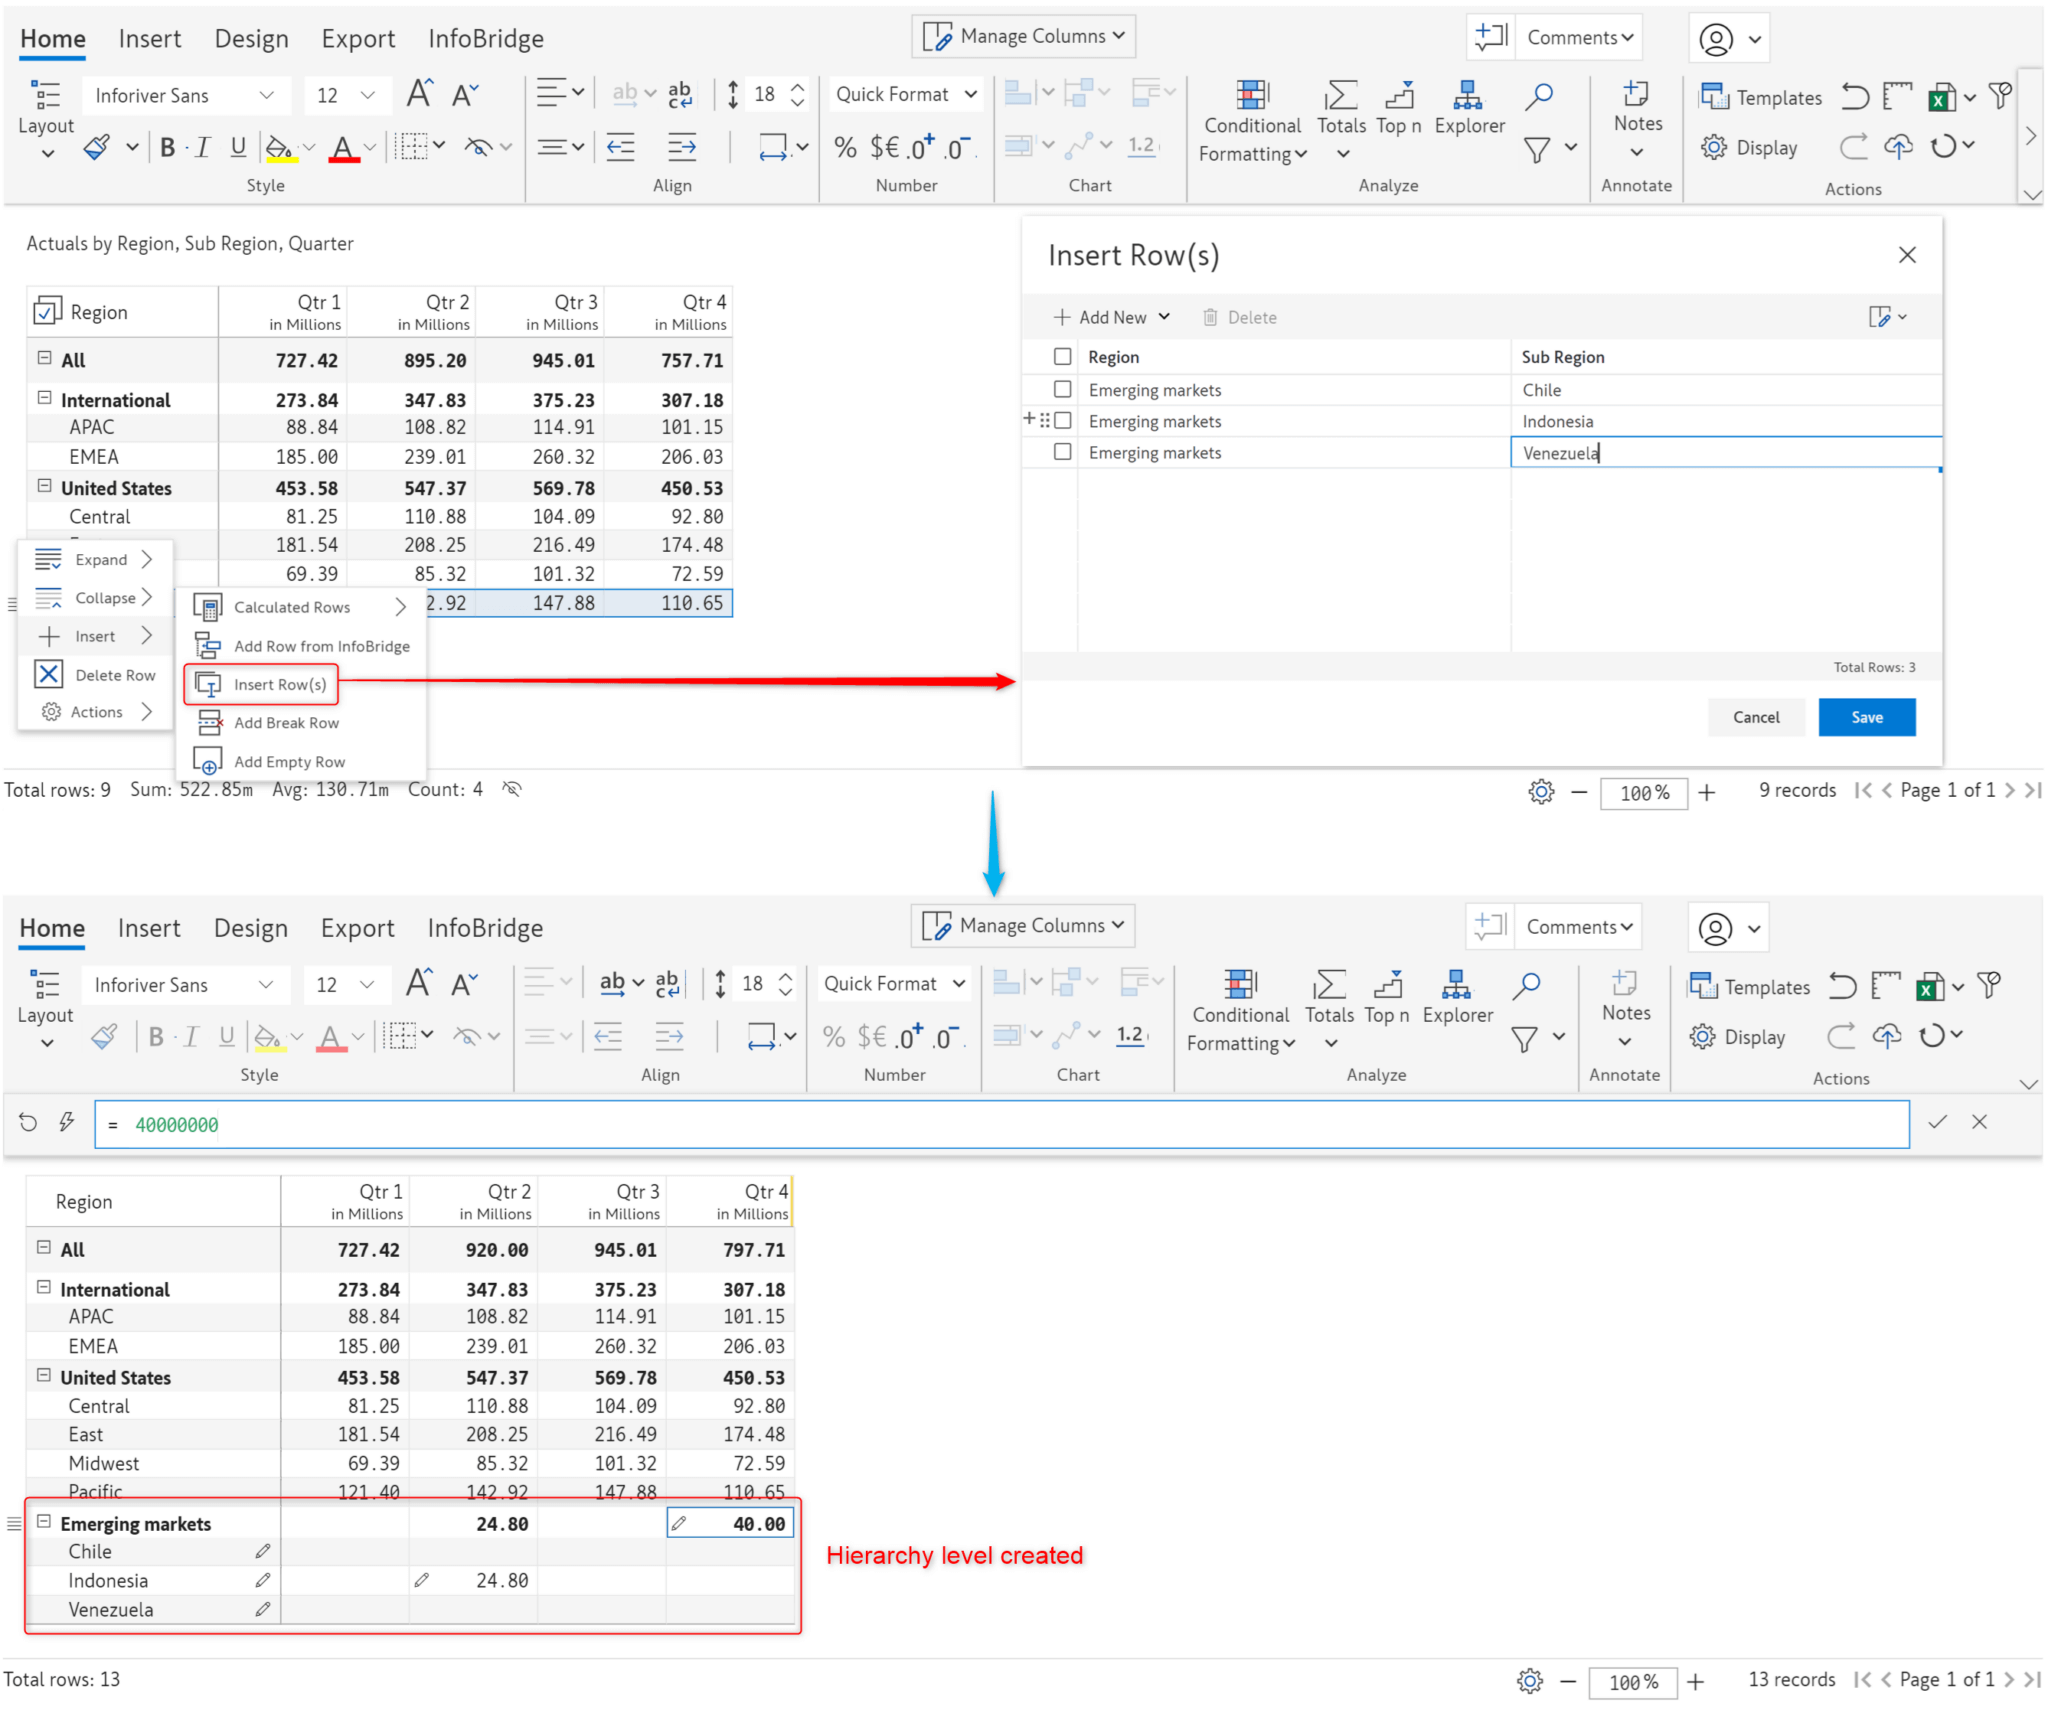
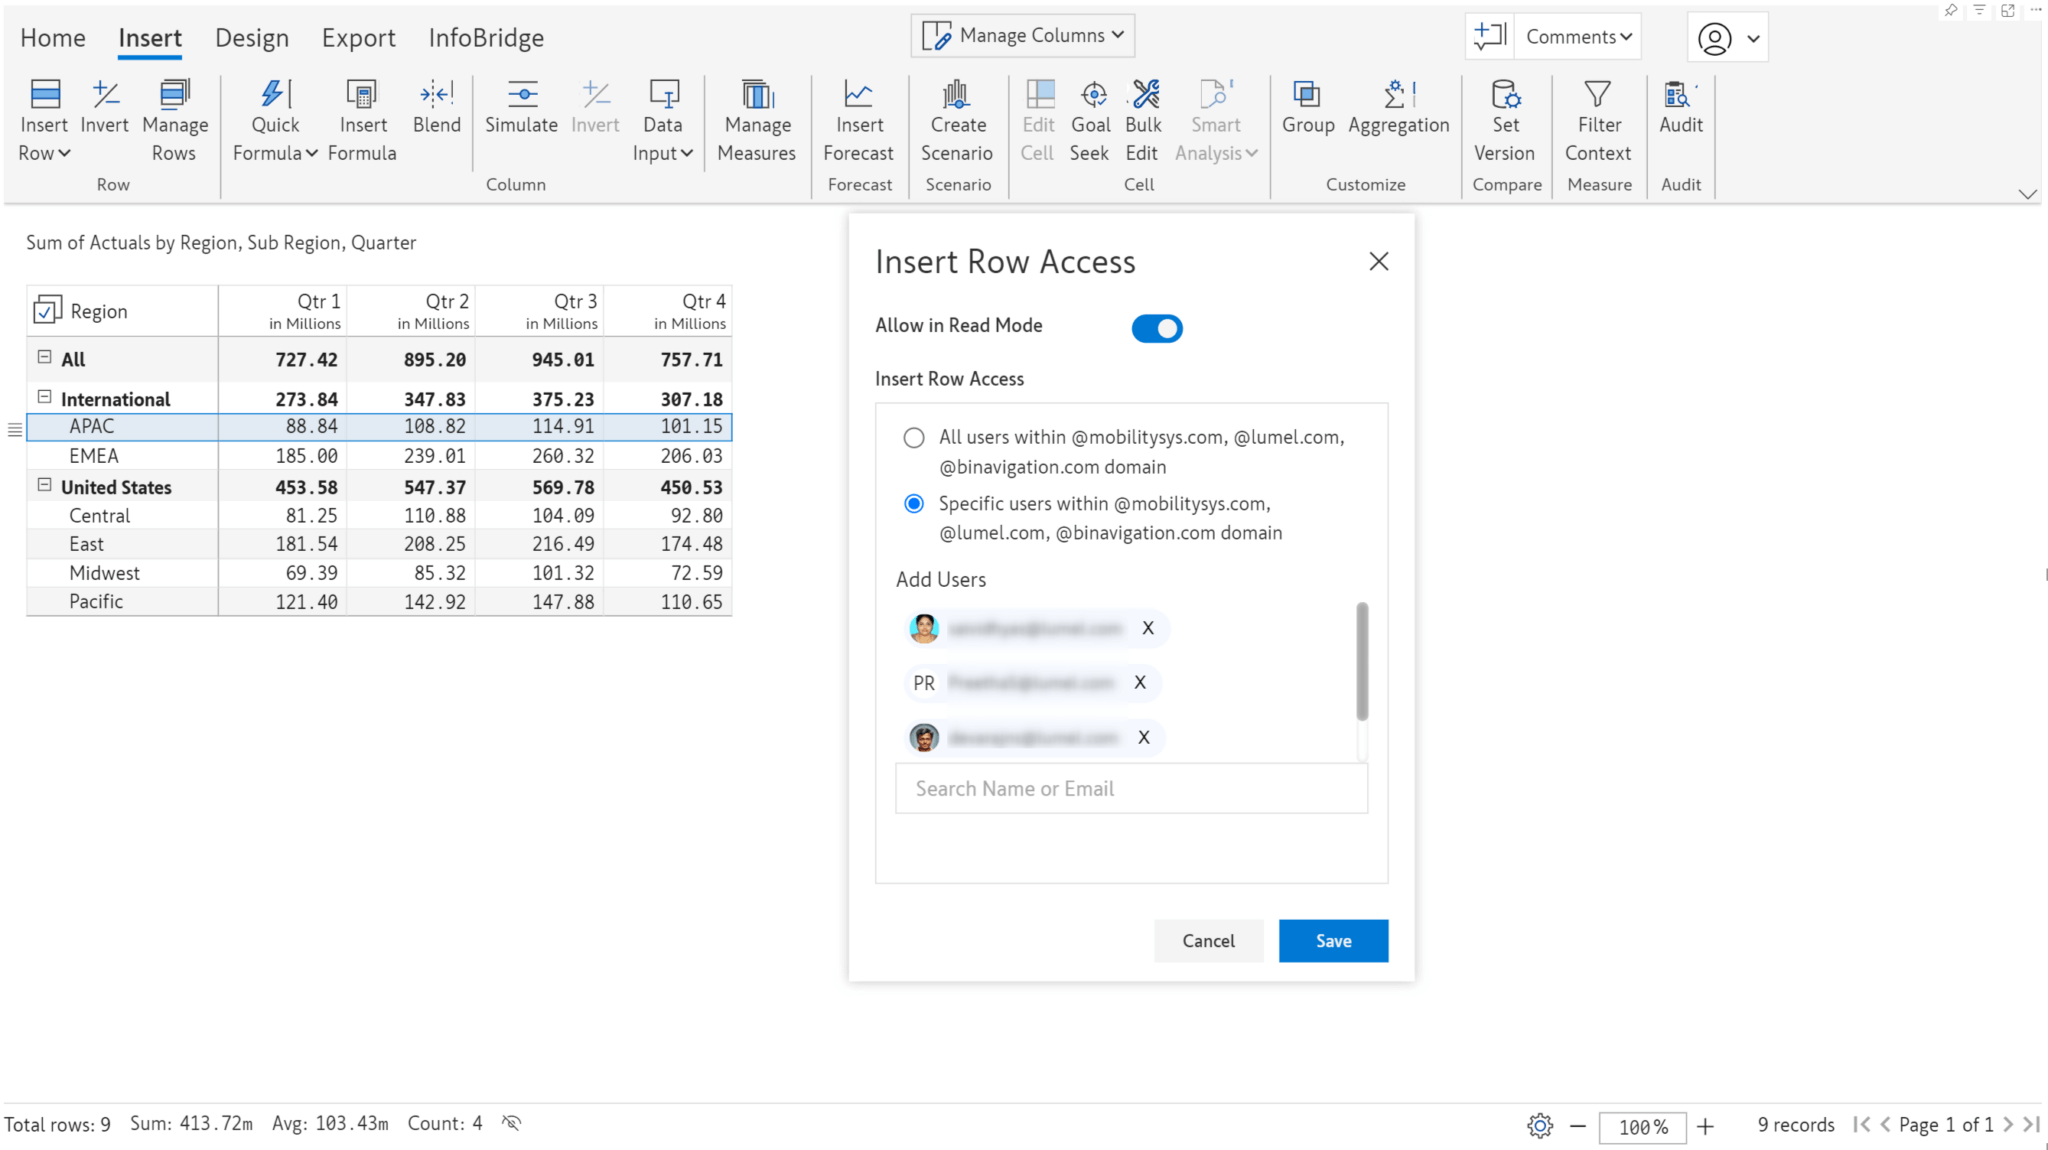
With Inforiver, you can easily create hierarchies at the visual level without updating the underlying dataset. For instance, if you have a new branch in the organizational hierarchy or a new section of products, you can create the hierarchy level within Inforiver and enter the data values. In the latest version, we’ve introduced a more advanced, straightforward, user-friendly interface to insert and manage hierarchies even from the reading view—the Insert Rows feature.
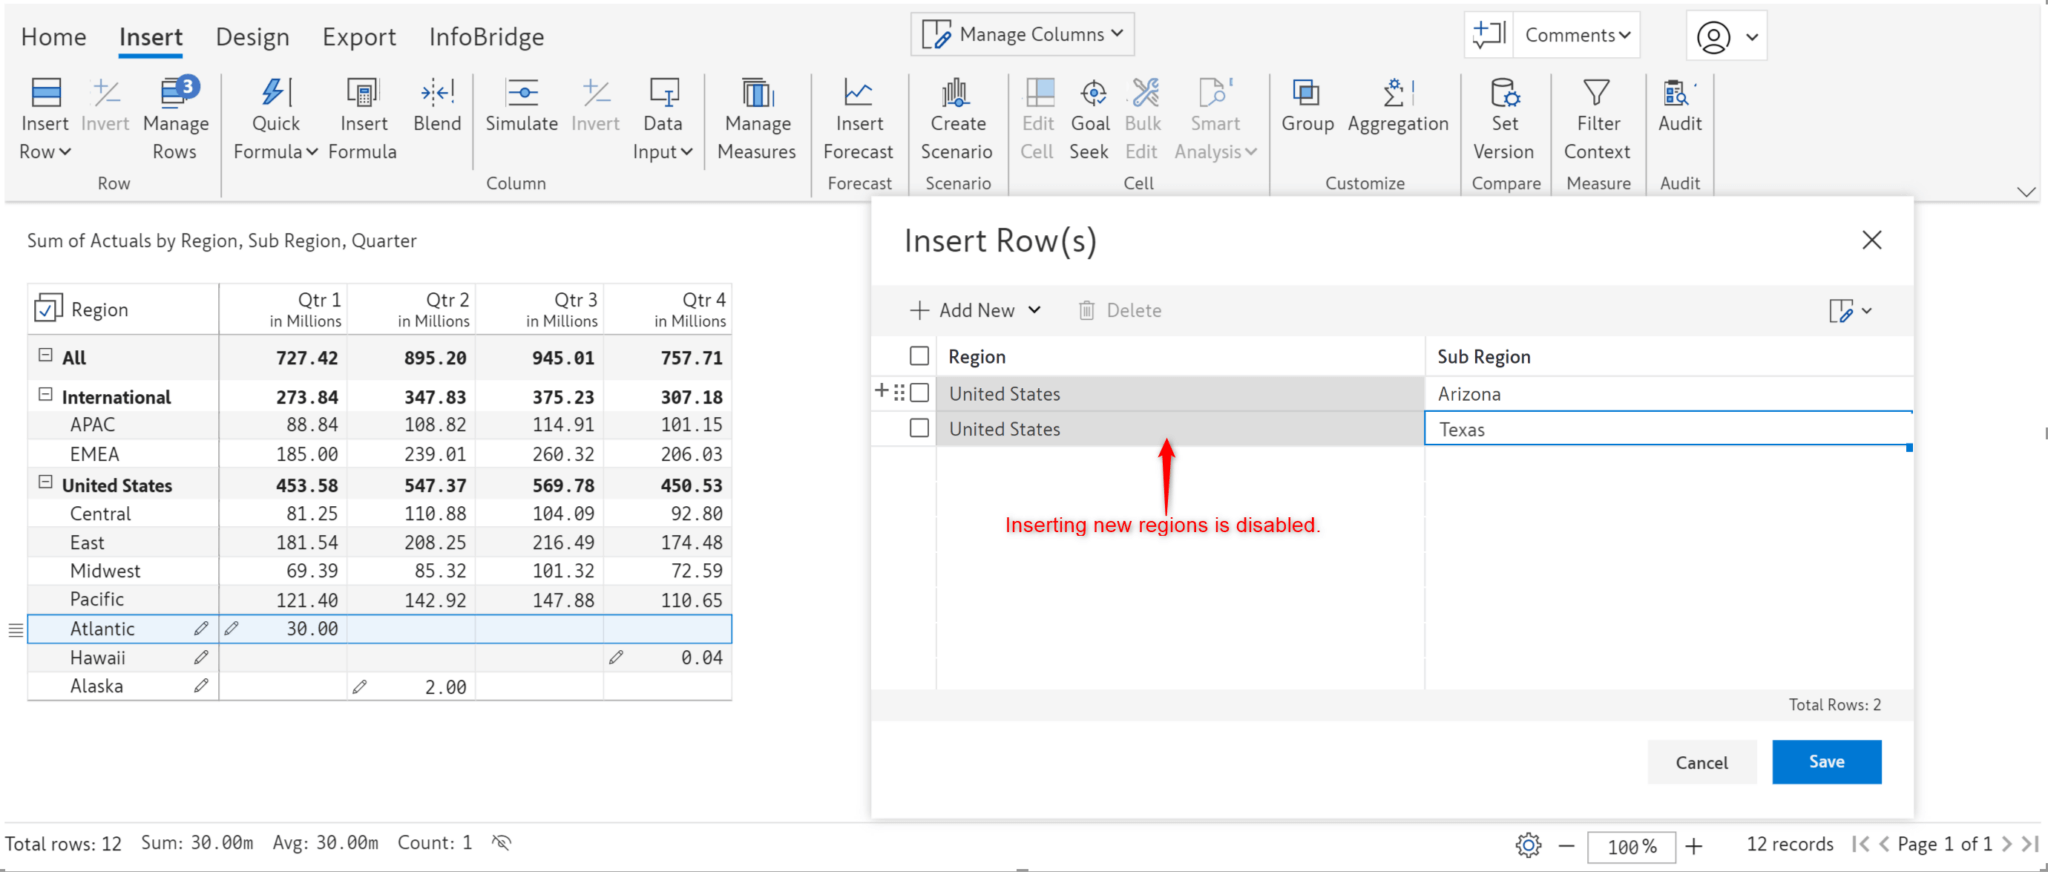
We’ve disabled the creation of new regions. However, new subregions can be inserted.
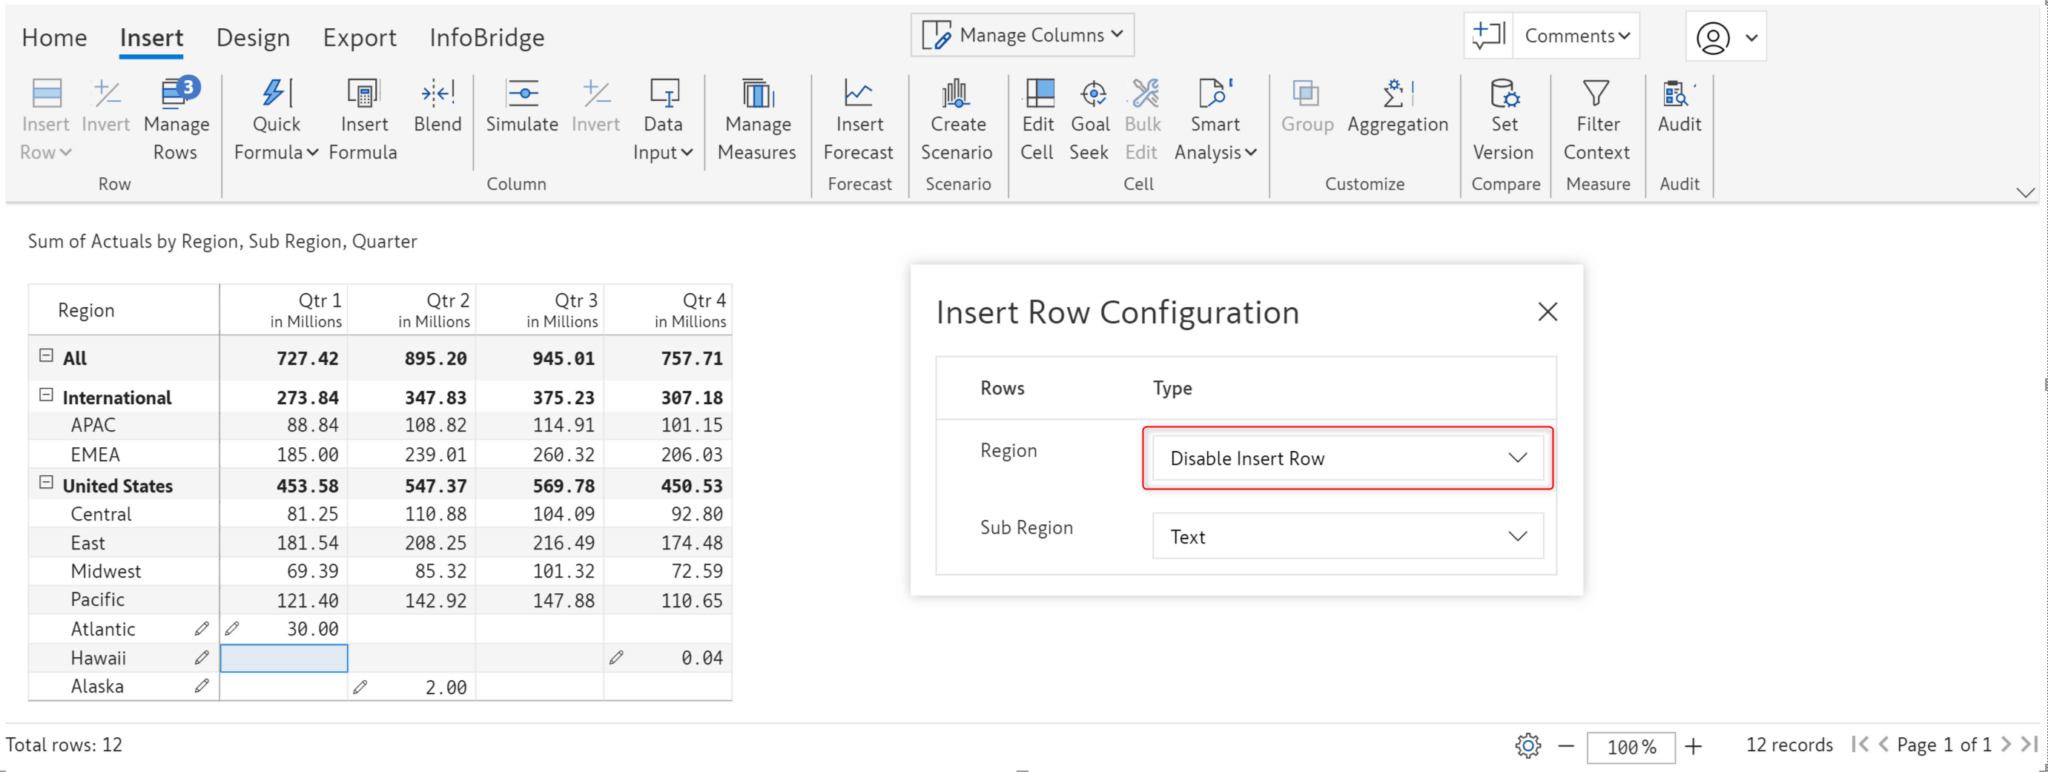
Notice how the Region textbox is disabled in the Insert rows window, but we can enter values in the SubRegion textbox.
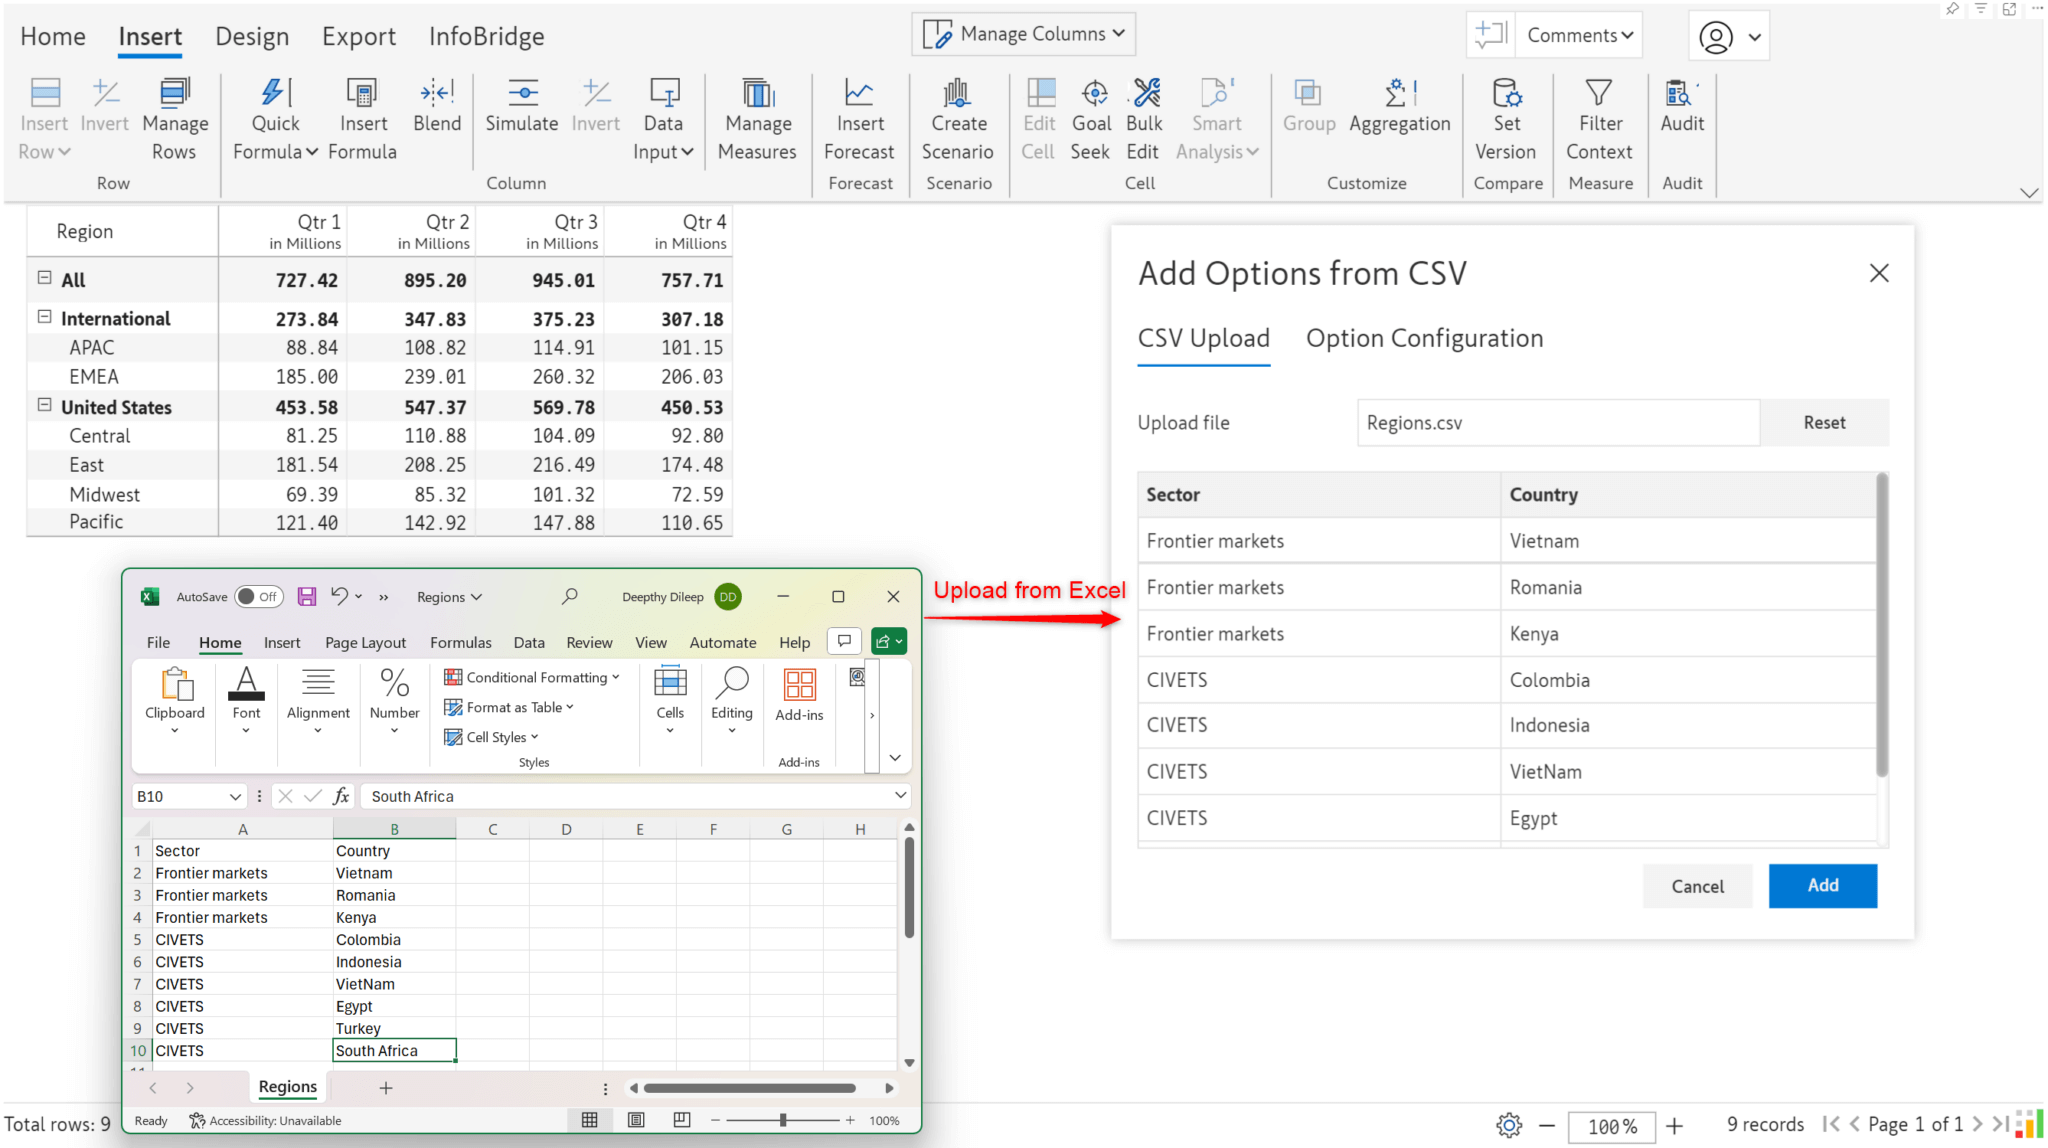
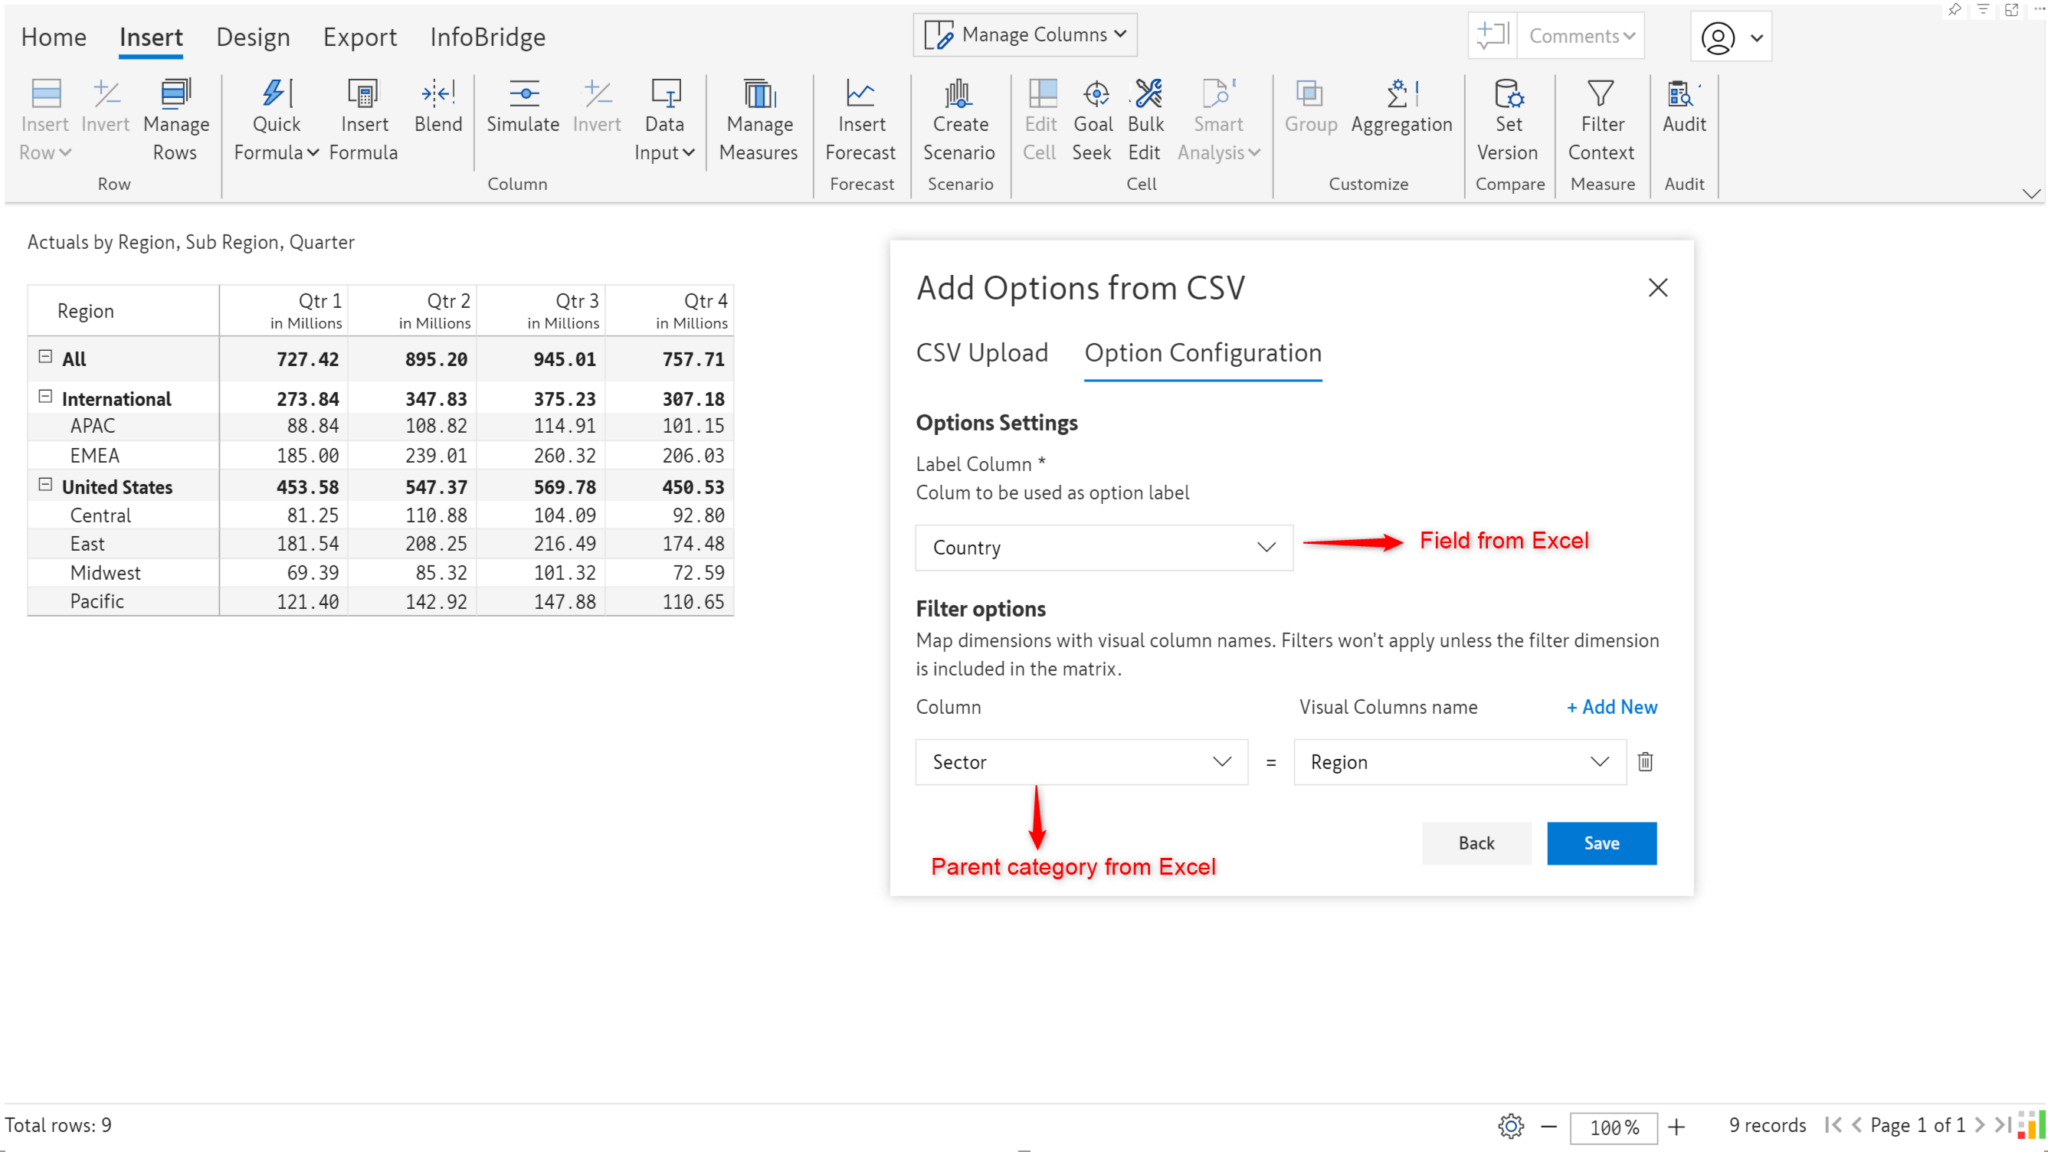
When you upload data from Excel, you need to explicitly map the field in Excel to the visual row dimension. You must also set up filters to map subcategories under the respective parent category. In this case, when you select Frontier markets as the Region, you will only want to see Vietnam, Romania, and Kenya in the Sub Region dropdown. Similarly, when you select CIVETS as the Region, you would only want to see Colombia, Indonesia, Vietnam, Egypt, etc, and none of the countries that fall under the Frontier markets sector.
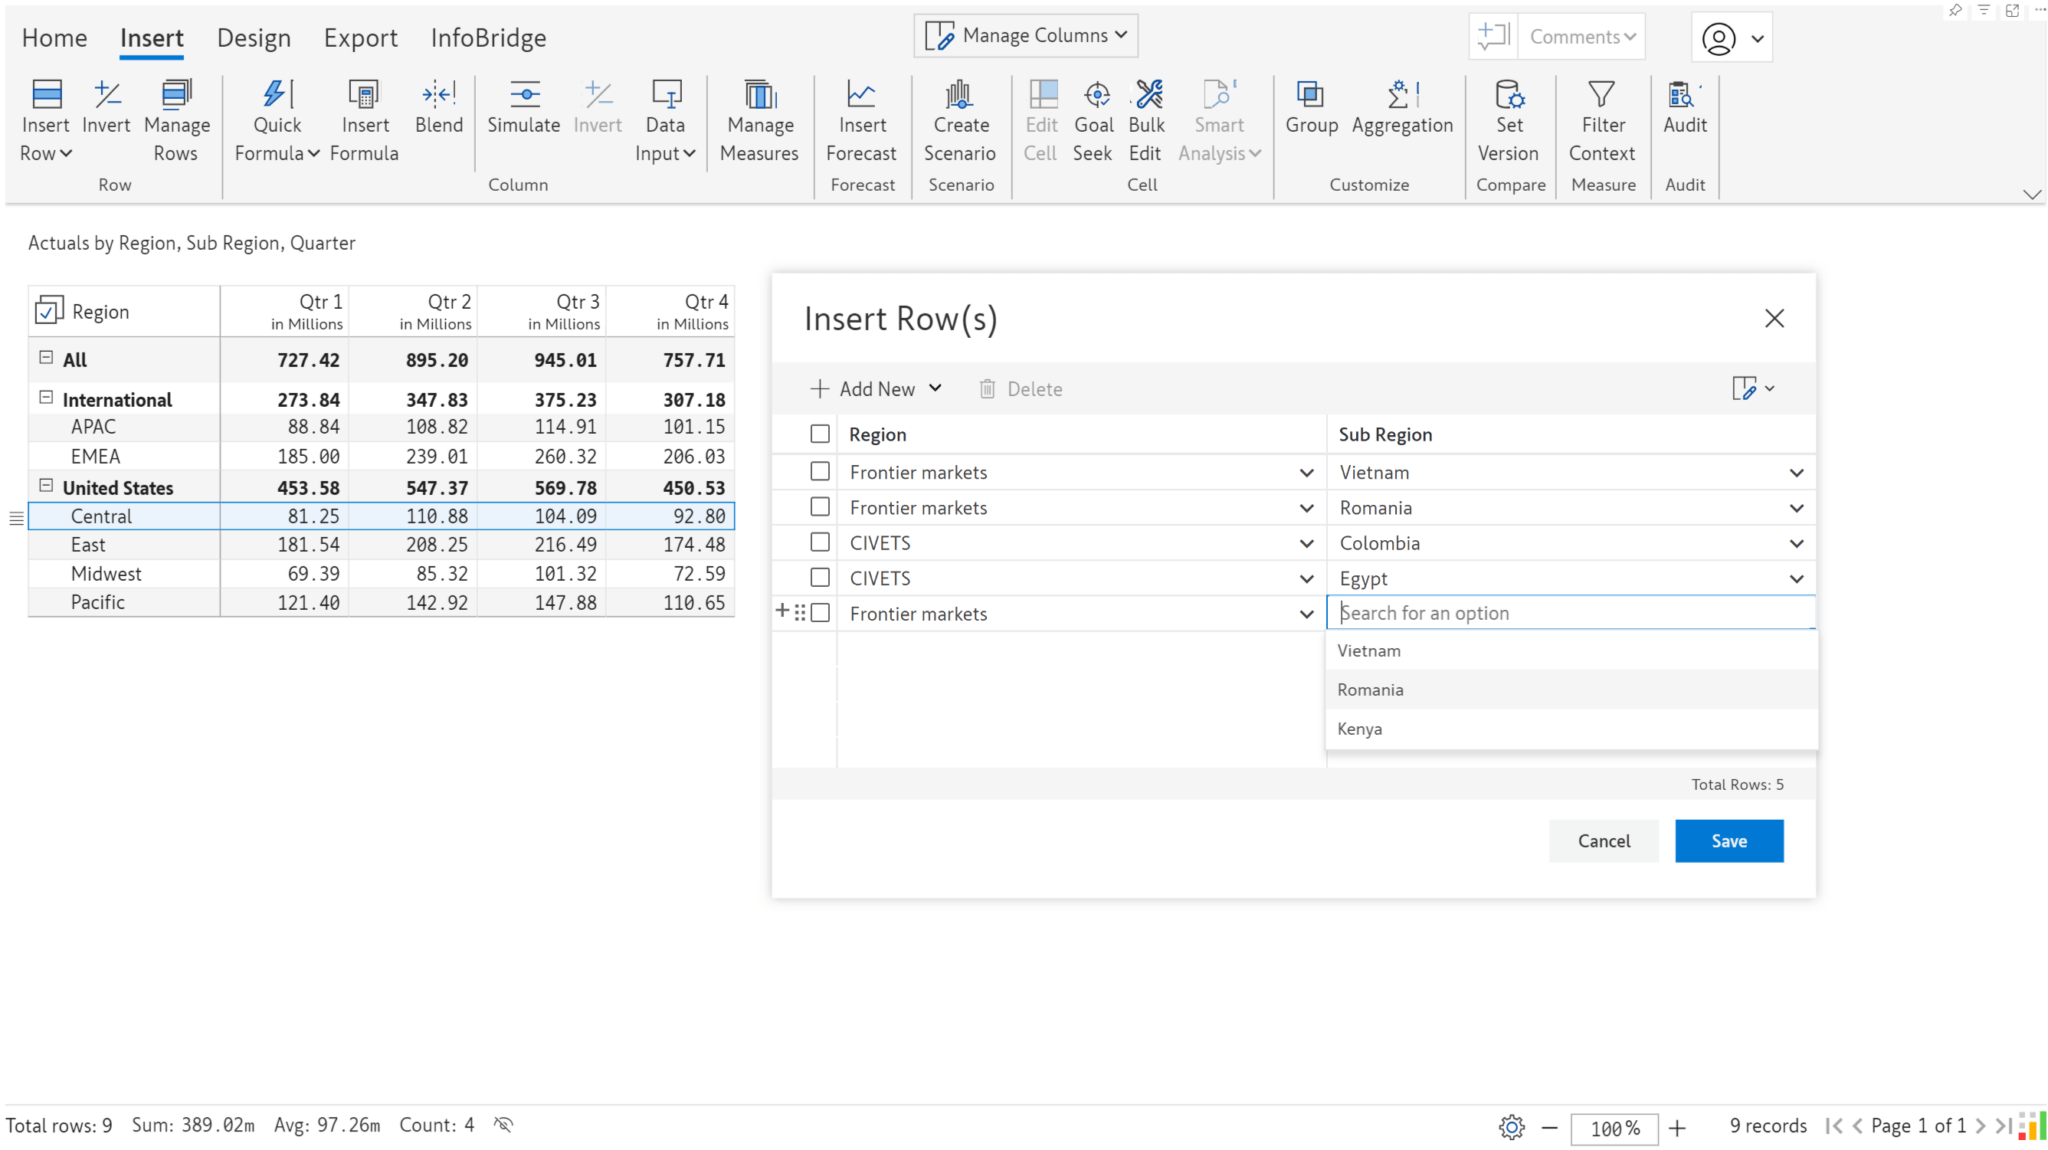
Once the field mapping and filters (optional) are set up, you can see the data from the Excel sheet in the Insert rows interface.
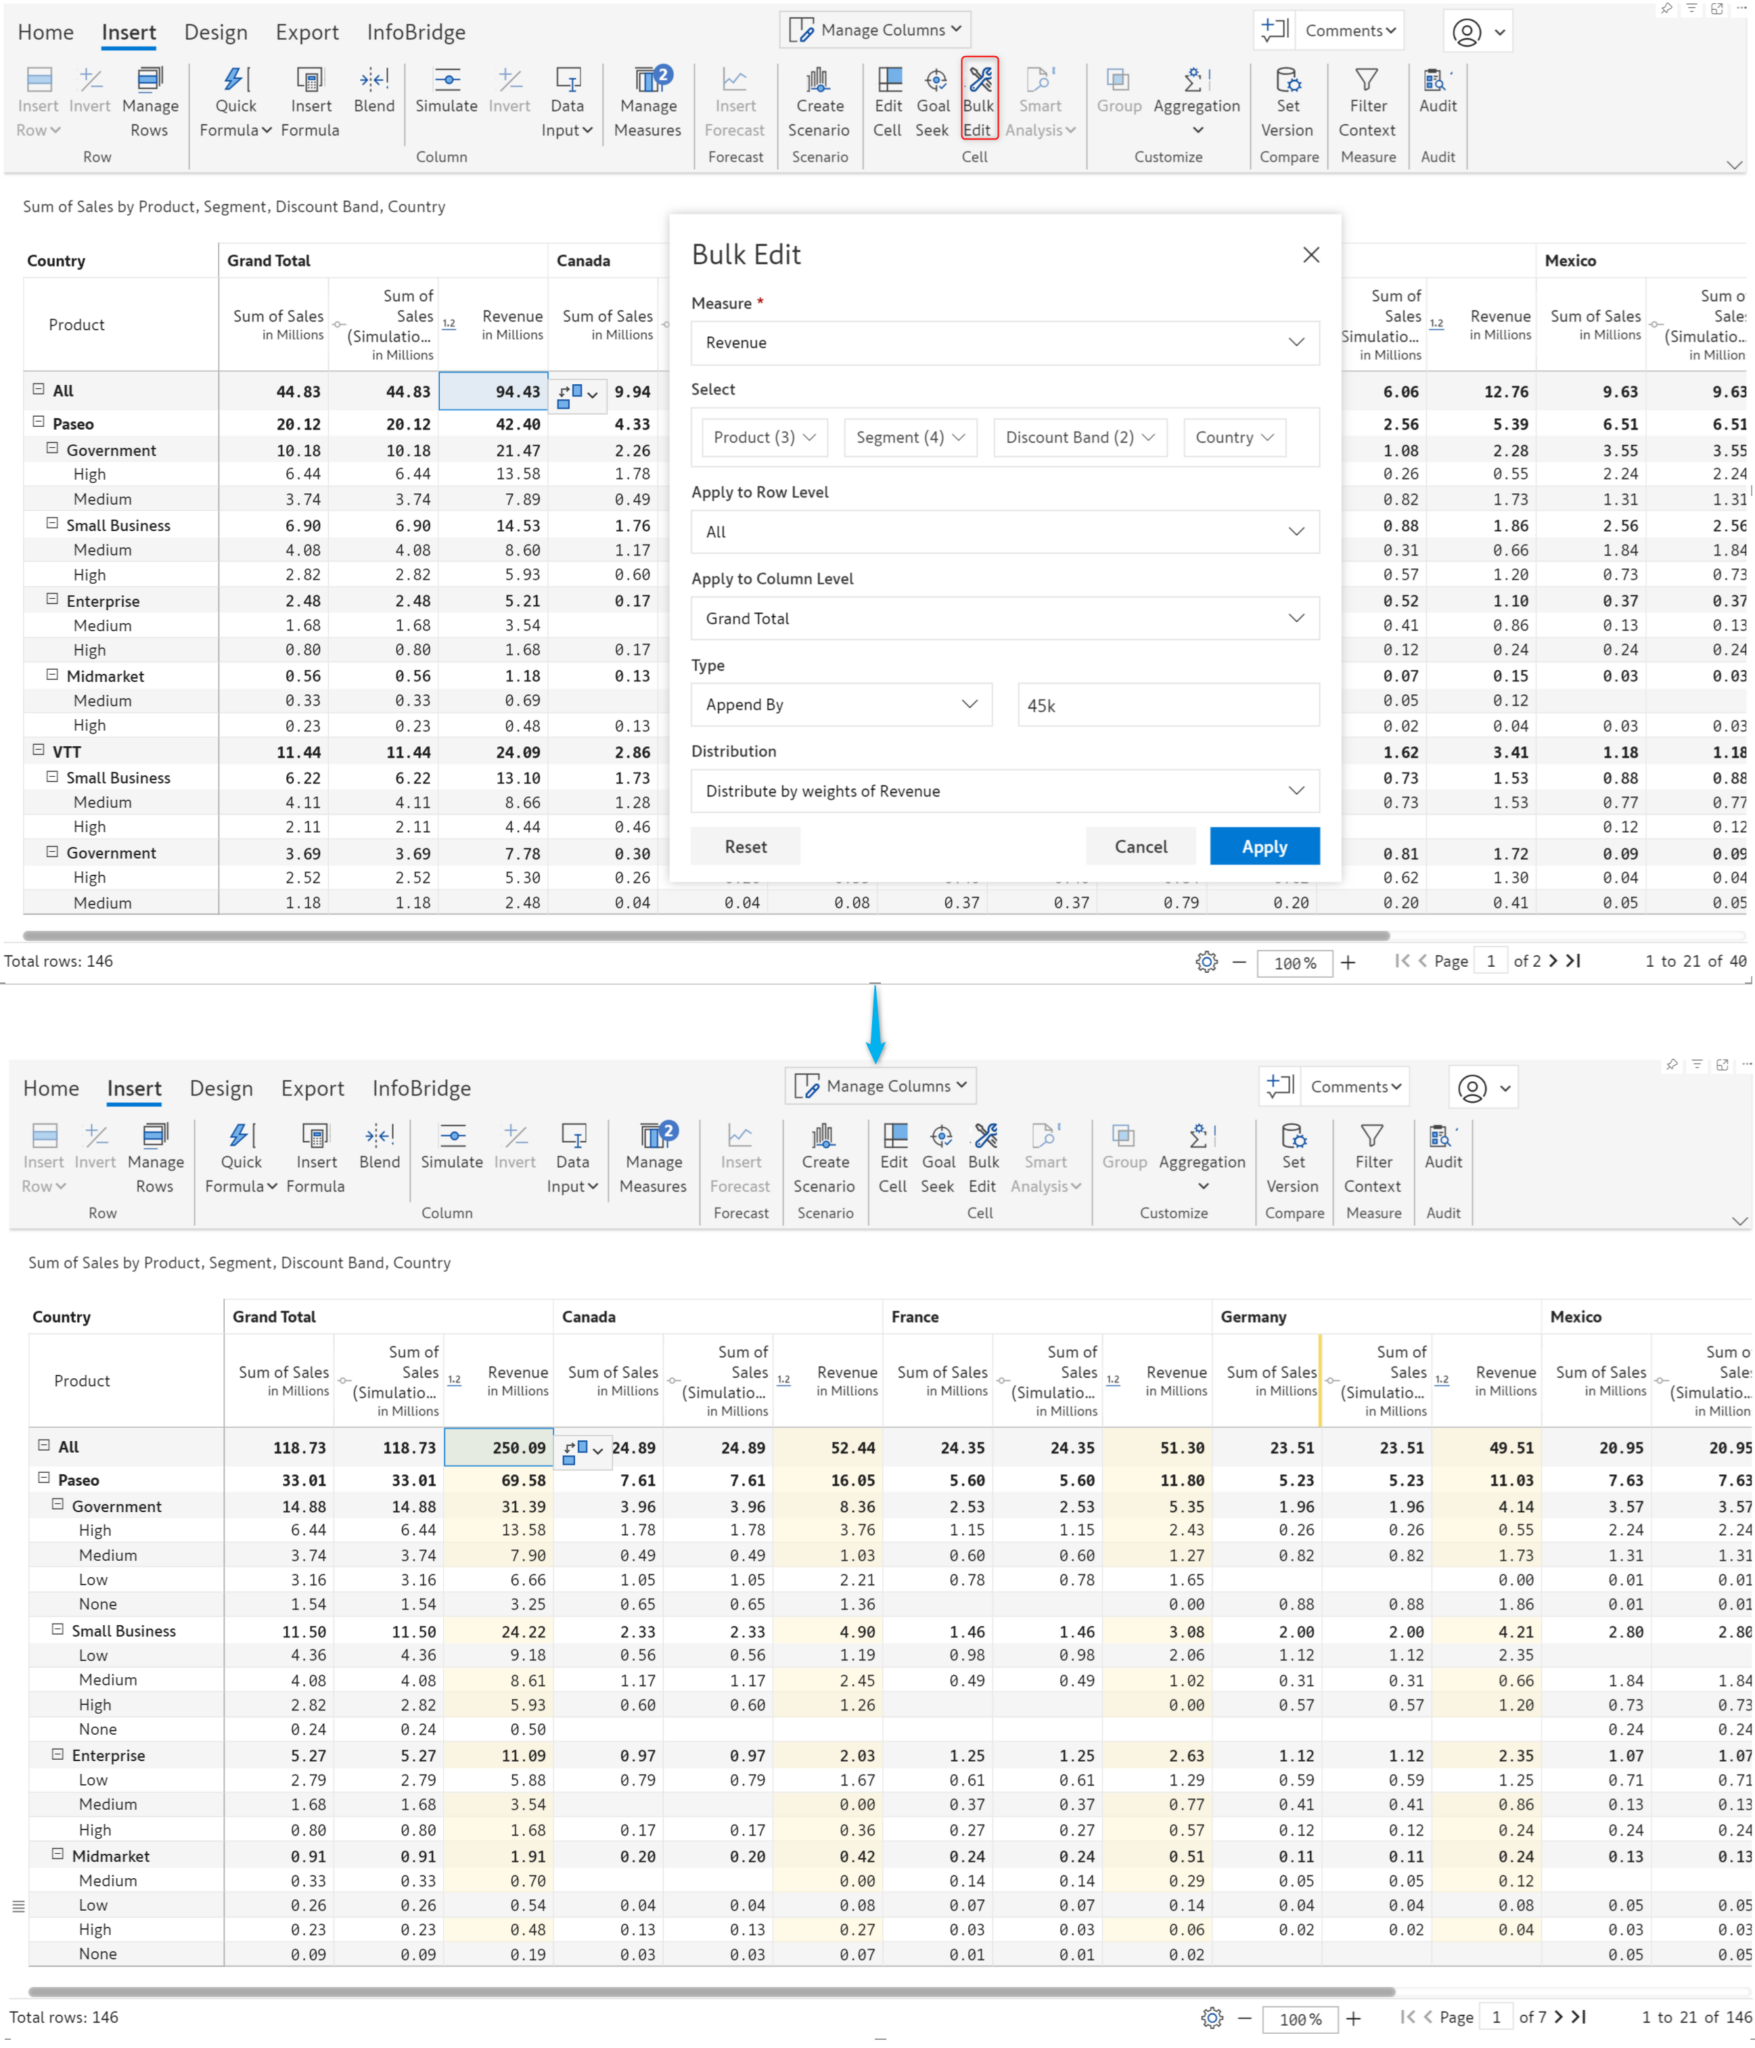
In financial reporting, costs or revenues may need to be allocated across multiple fields, or during the budgeting/forecasting process, the same values may need to be distributed across different fields. With the Bulk Edit feature:
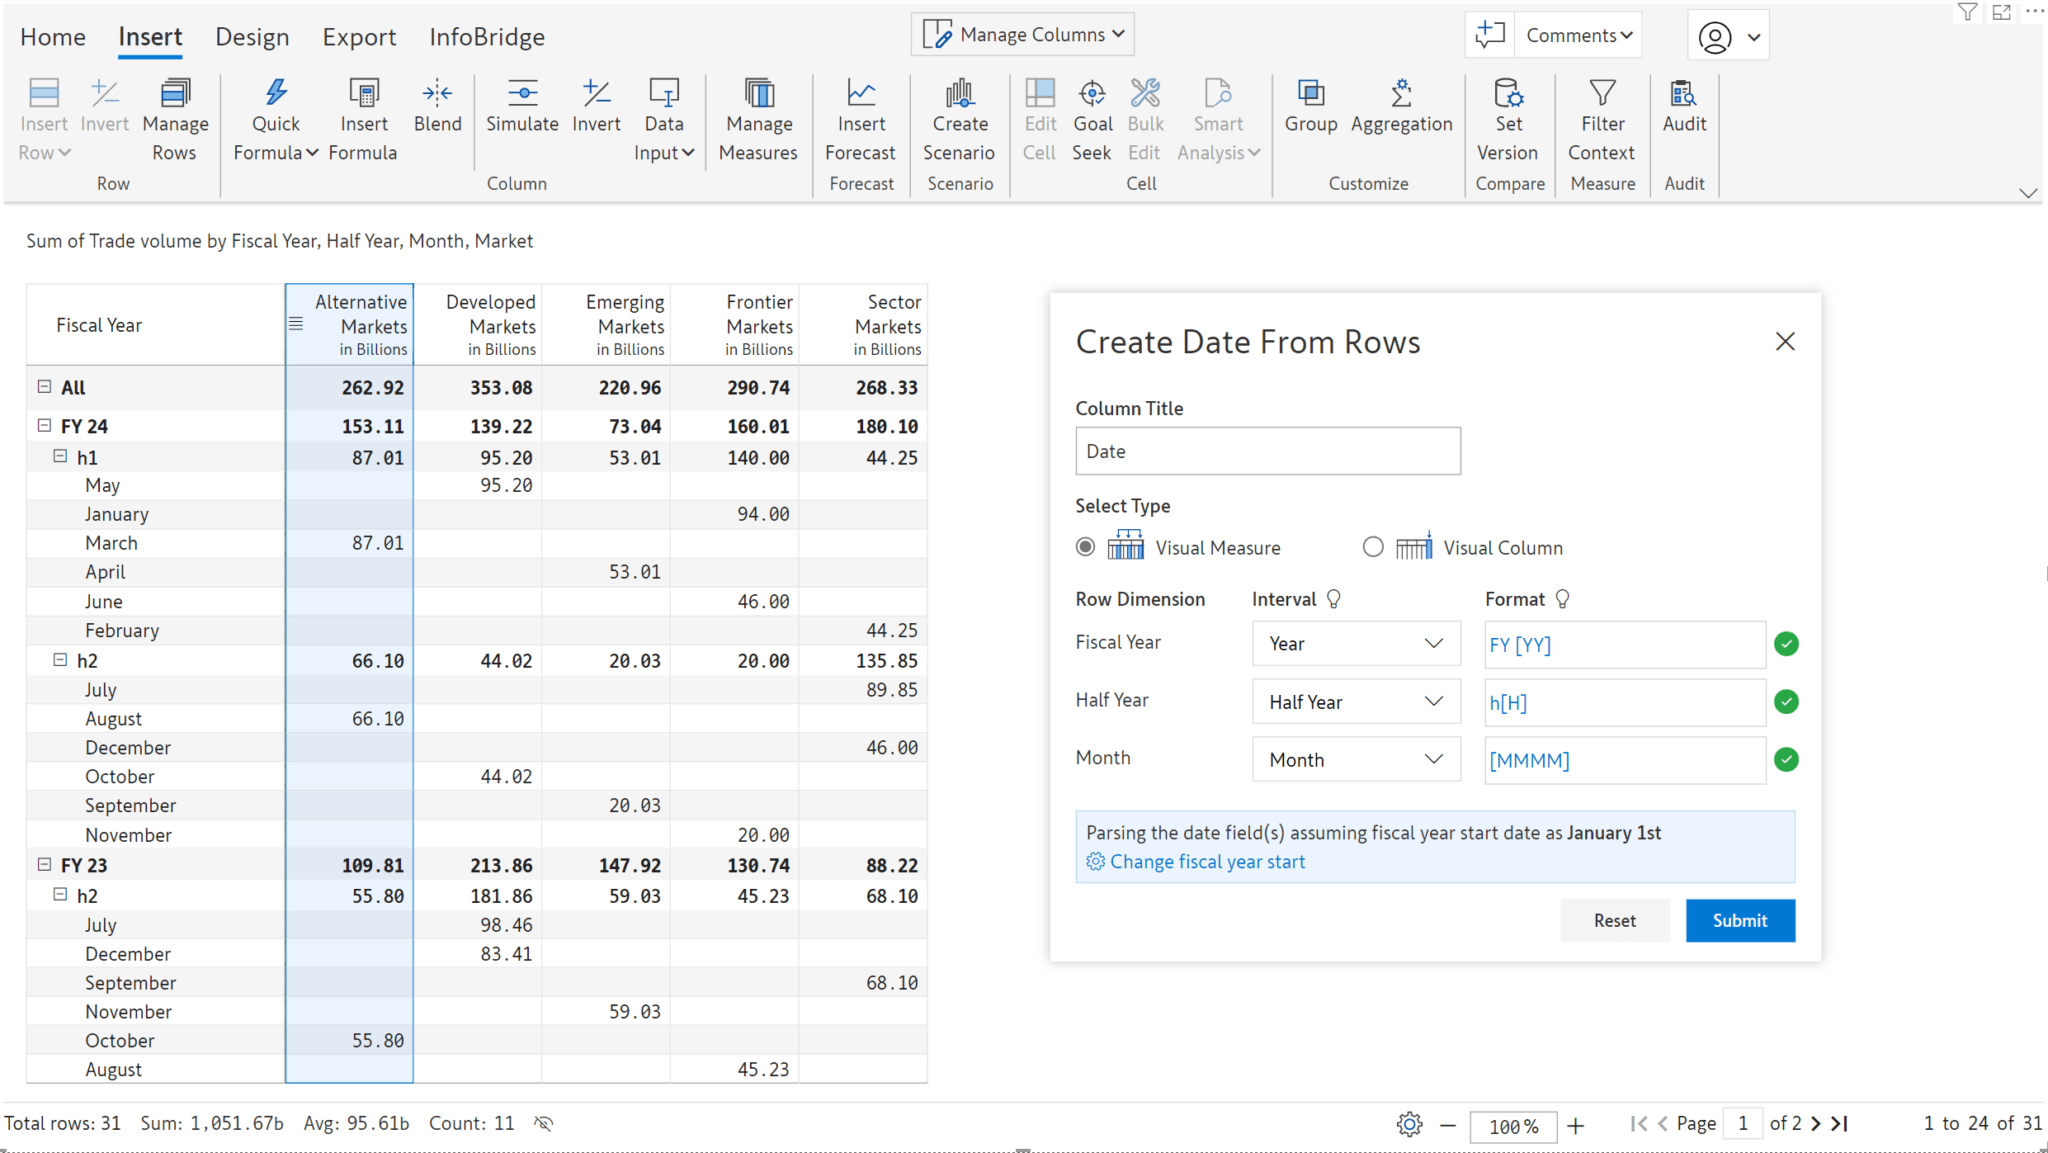
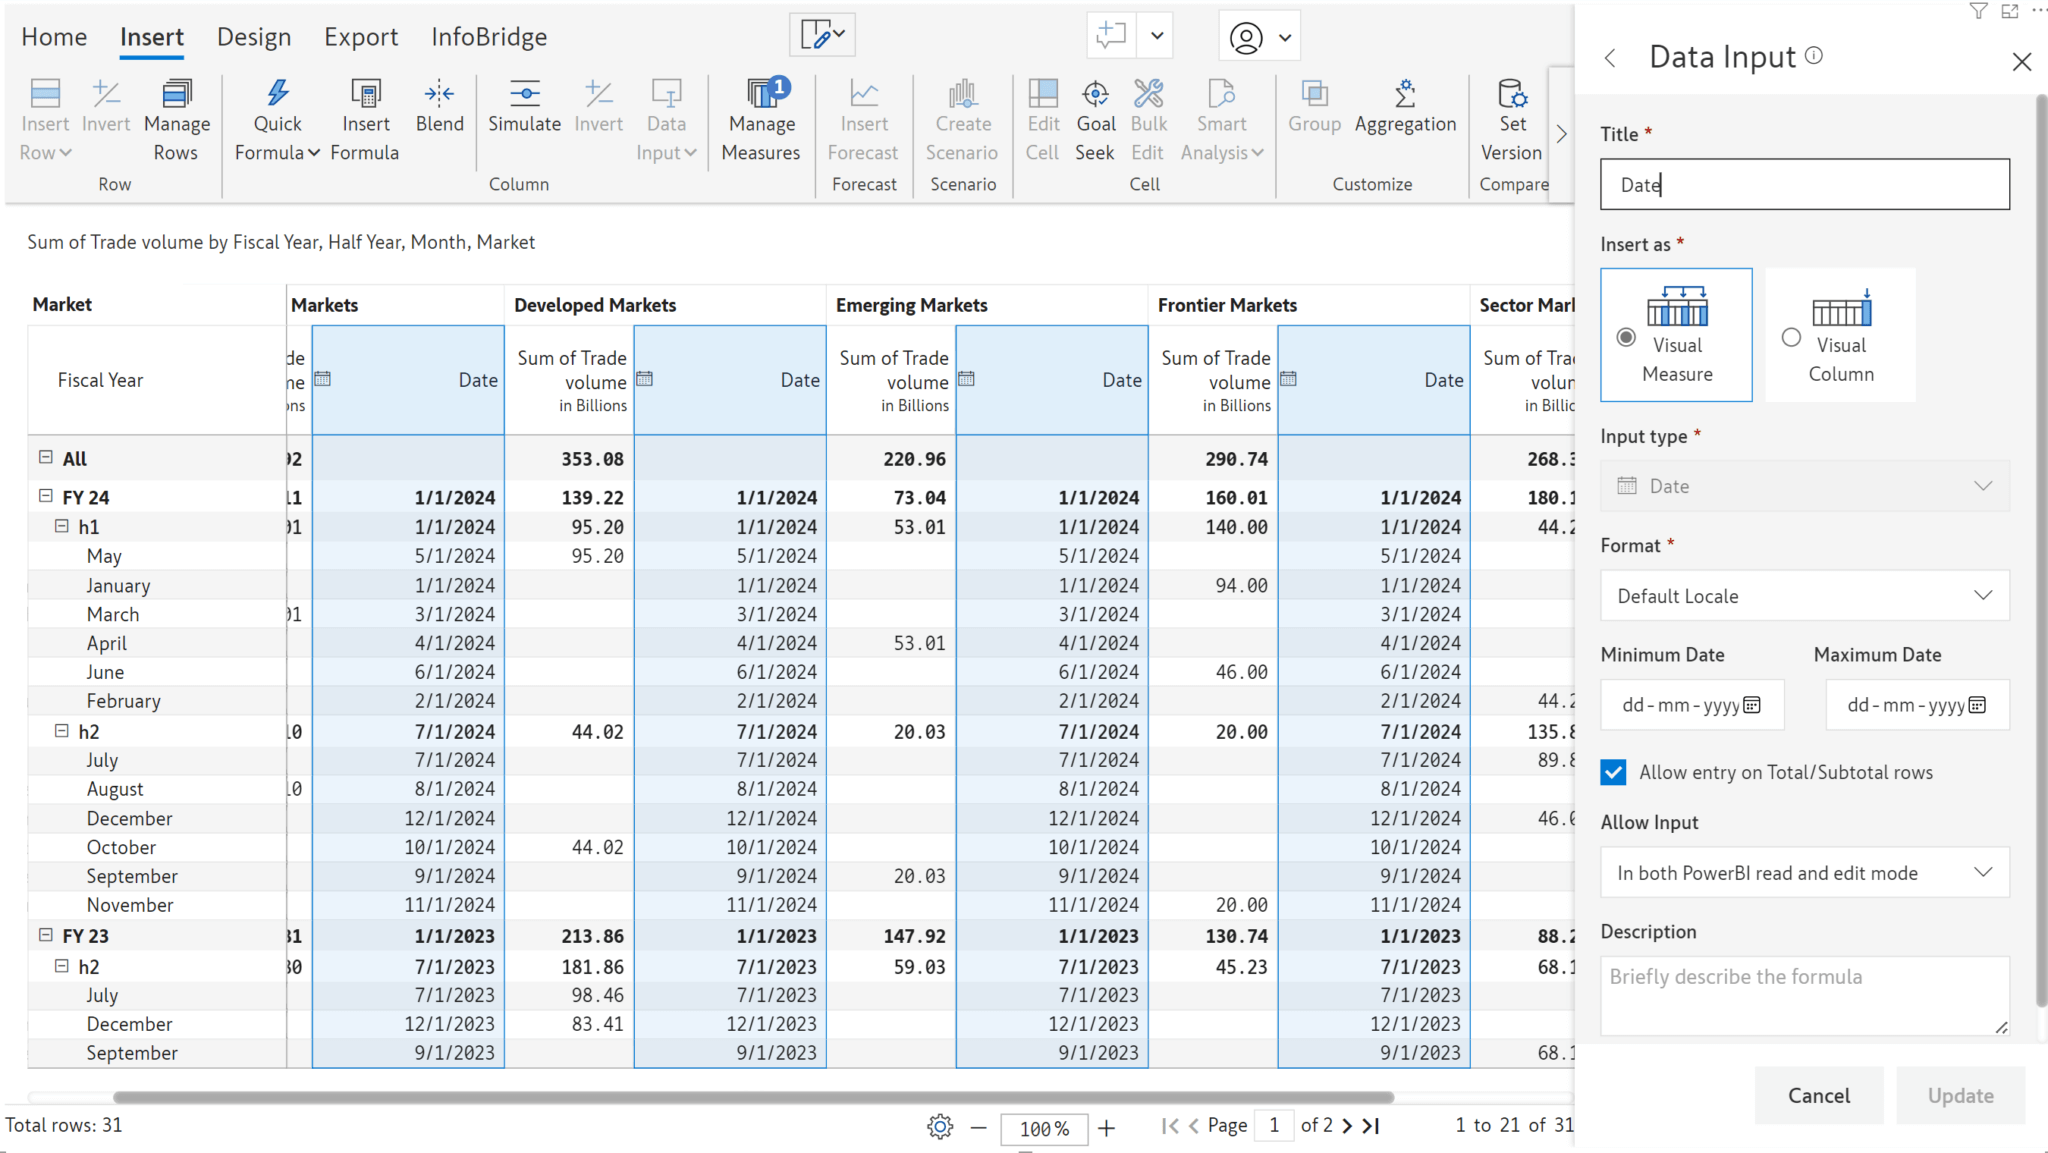
Inforiver allows you to input date values. When you have a date dimension in your rows, you can initialize data input dates with row dimension values. Navigate to Data Input > Date > Copy from rows to initialize. Even non-Power BI date formats are recognized by Inforiver.
You can see how the values in the date data input fields have been initialized from the rows.
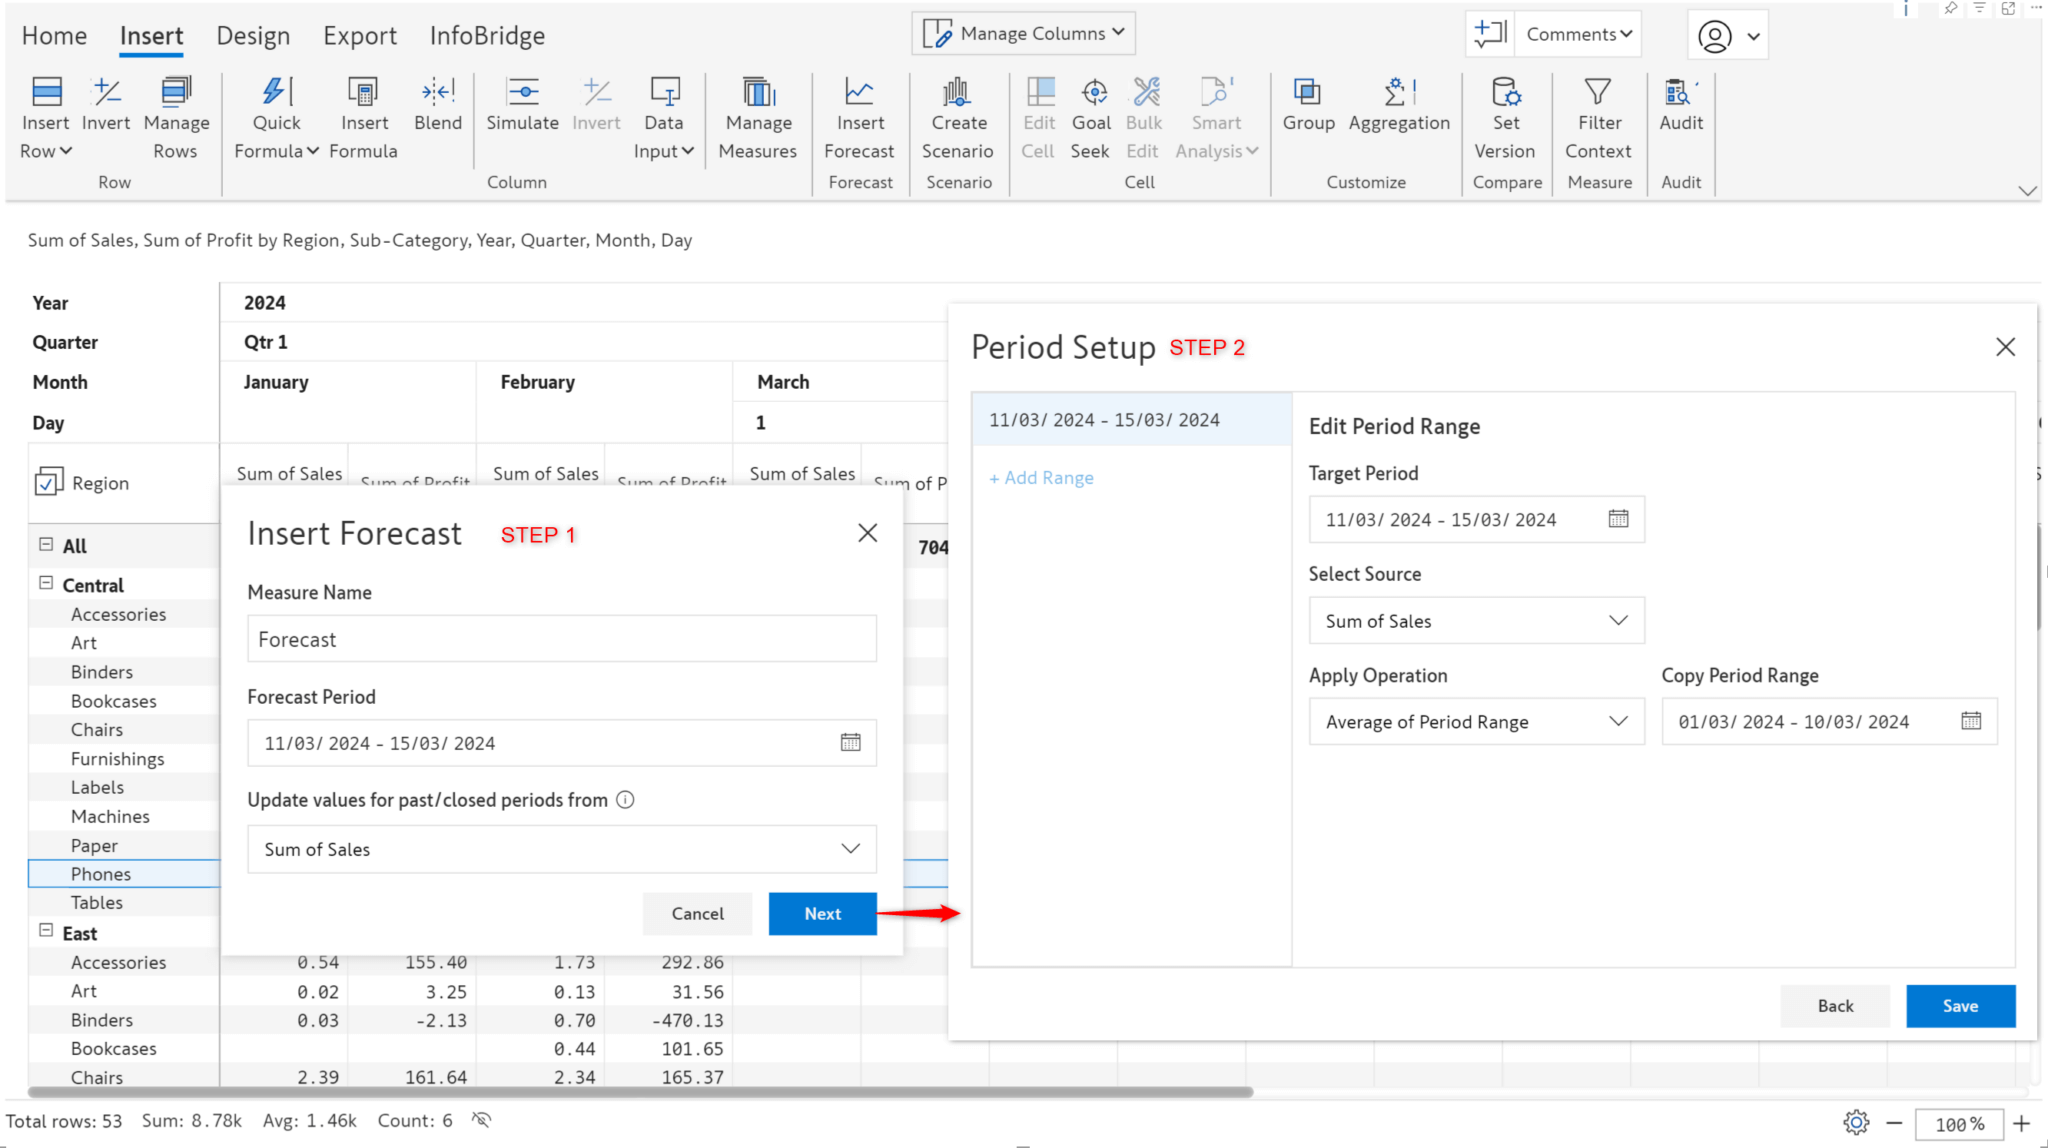
Inforiver’s robust forecasting feature provides various options for configuring and maintaining your forecasts. Inforiver already supports yearly, half-yearly, quarterly, and monthly forecasts. We have added the capability to forecast for a specific number of days or generate weekly forecasts.
Daily forecasts
Daily forecasts can be applied to areas like
Forecast configuration from March 11th to March 15th.
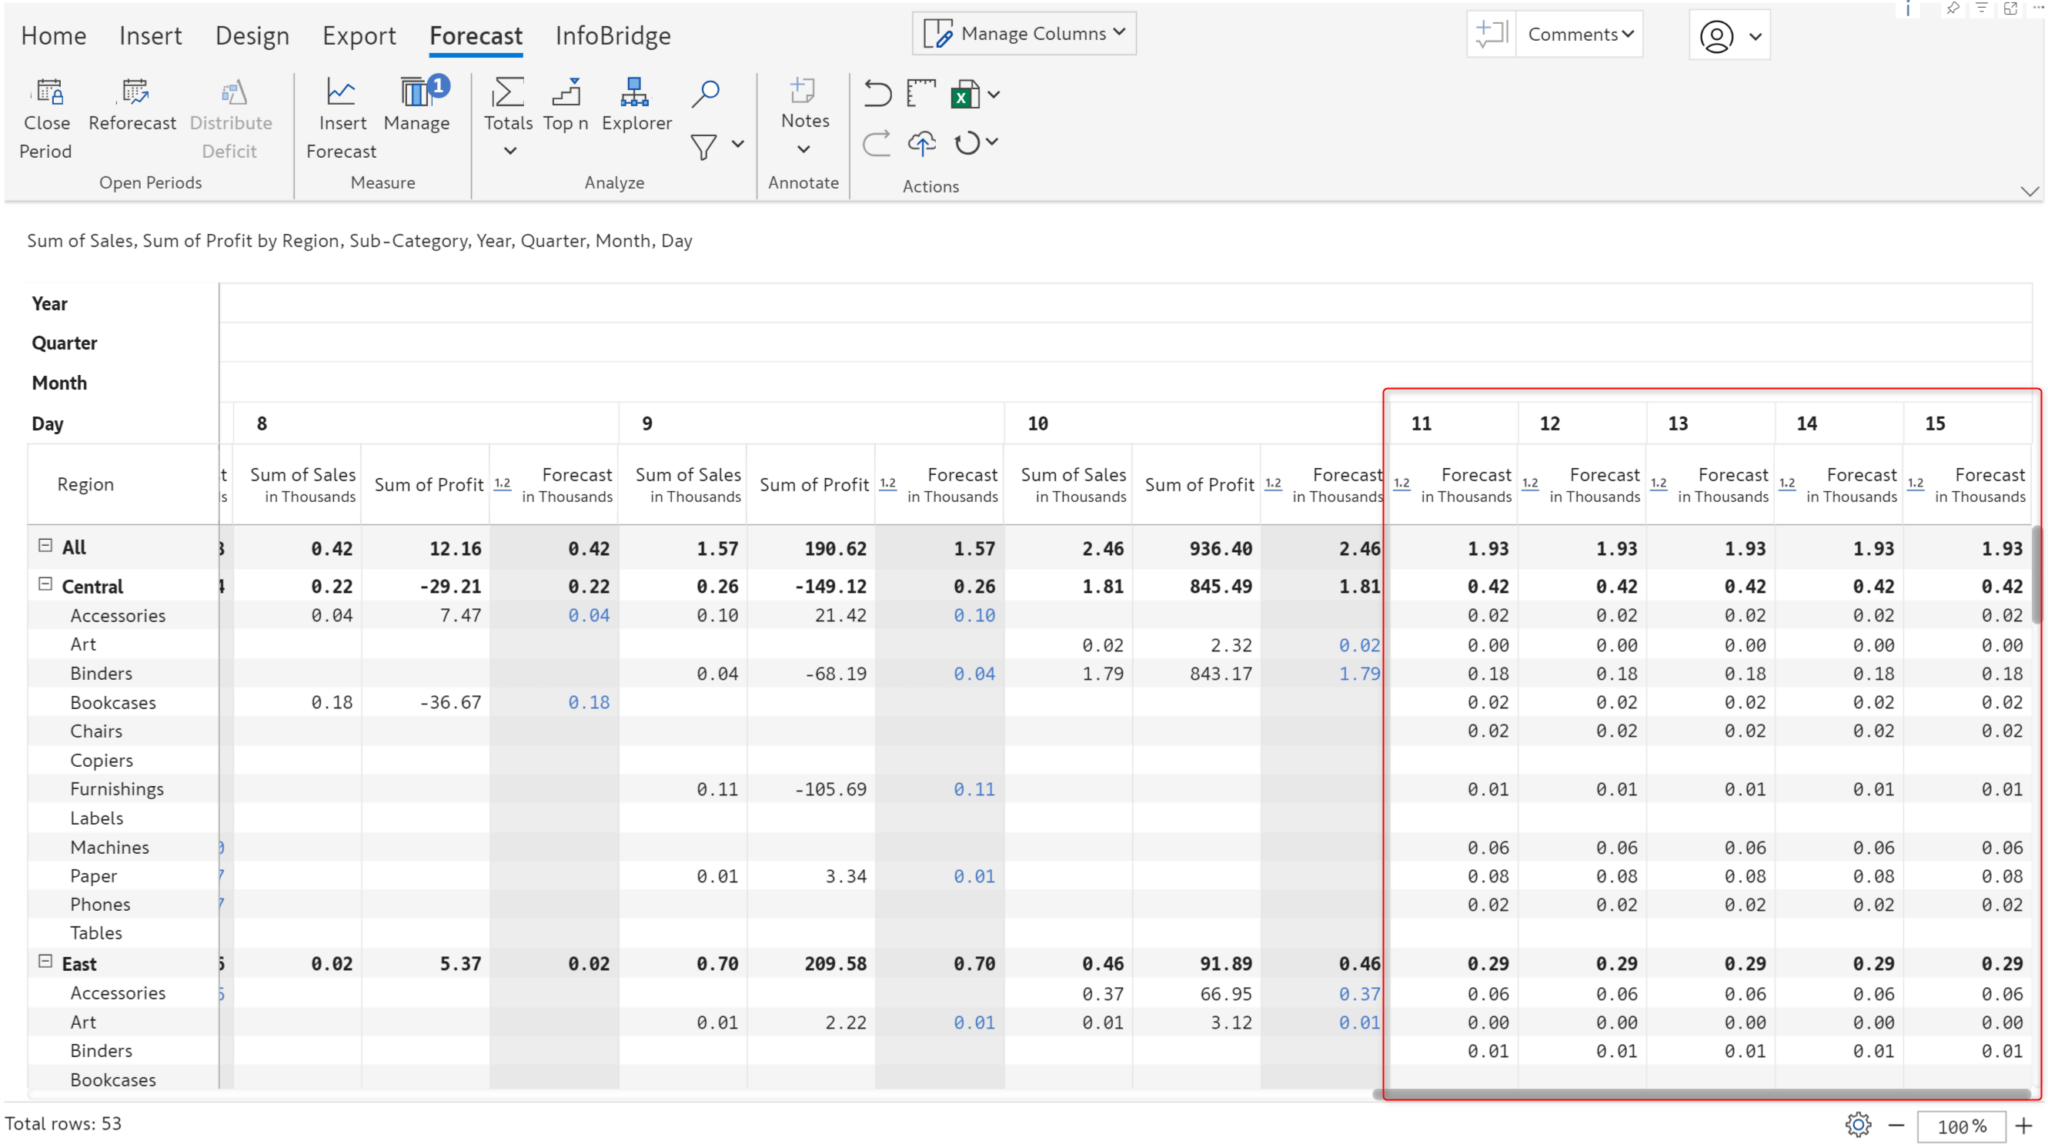
Daily forecast generated from March 11th to March 15th.
Weekly forecast
When you have weeks in your column dimension, Inforiver automatically detects the week numbers while configuring the forecast.
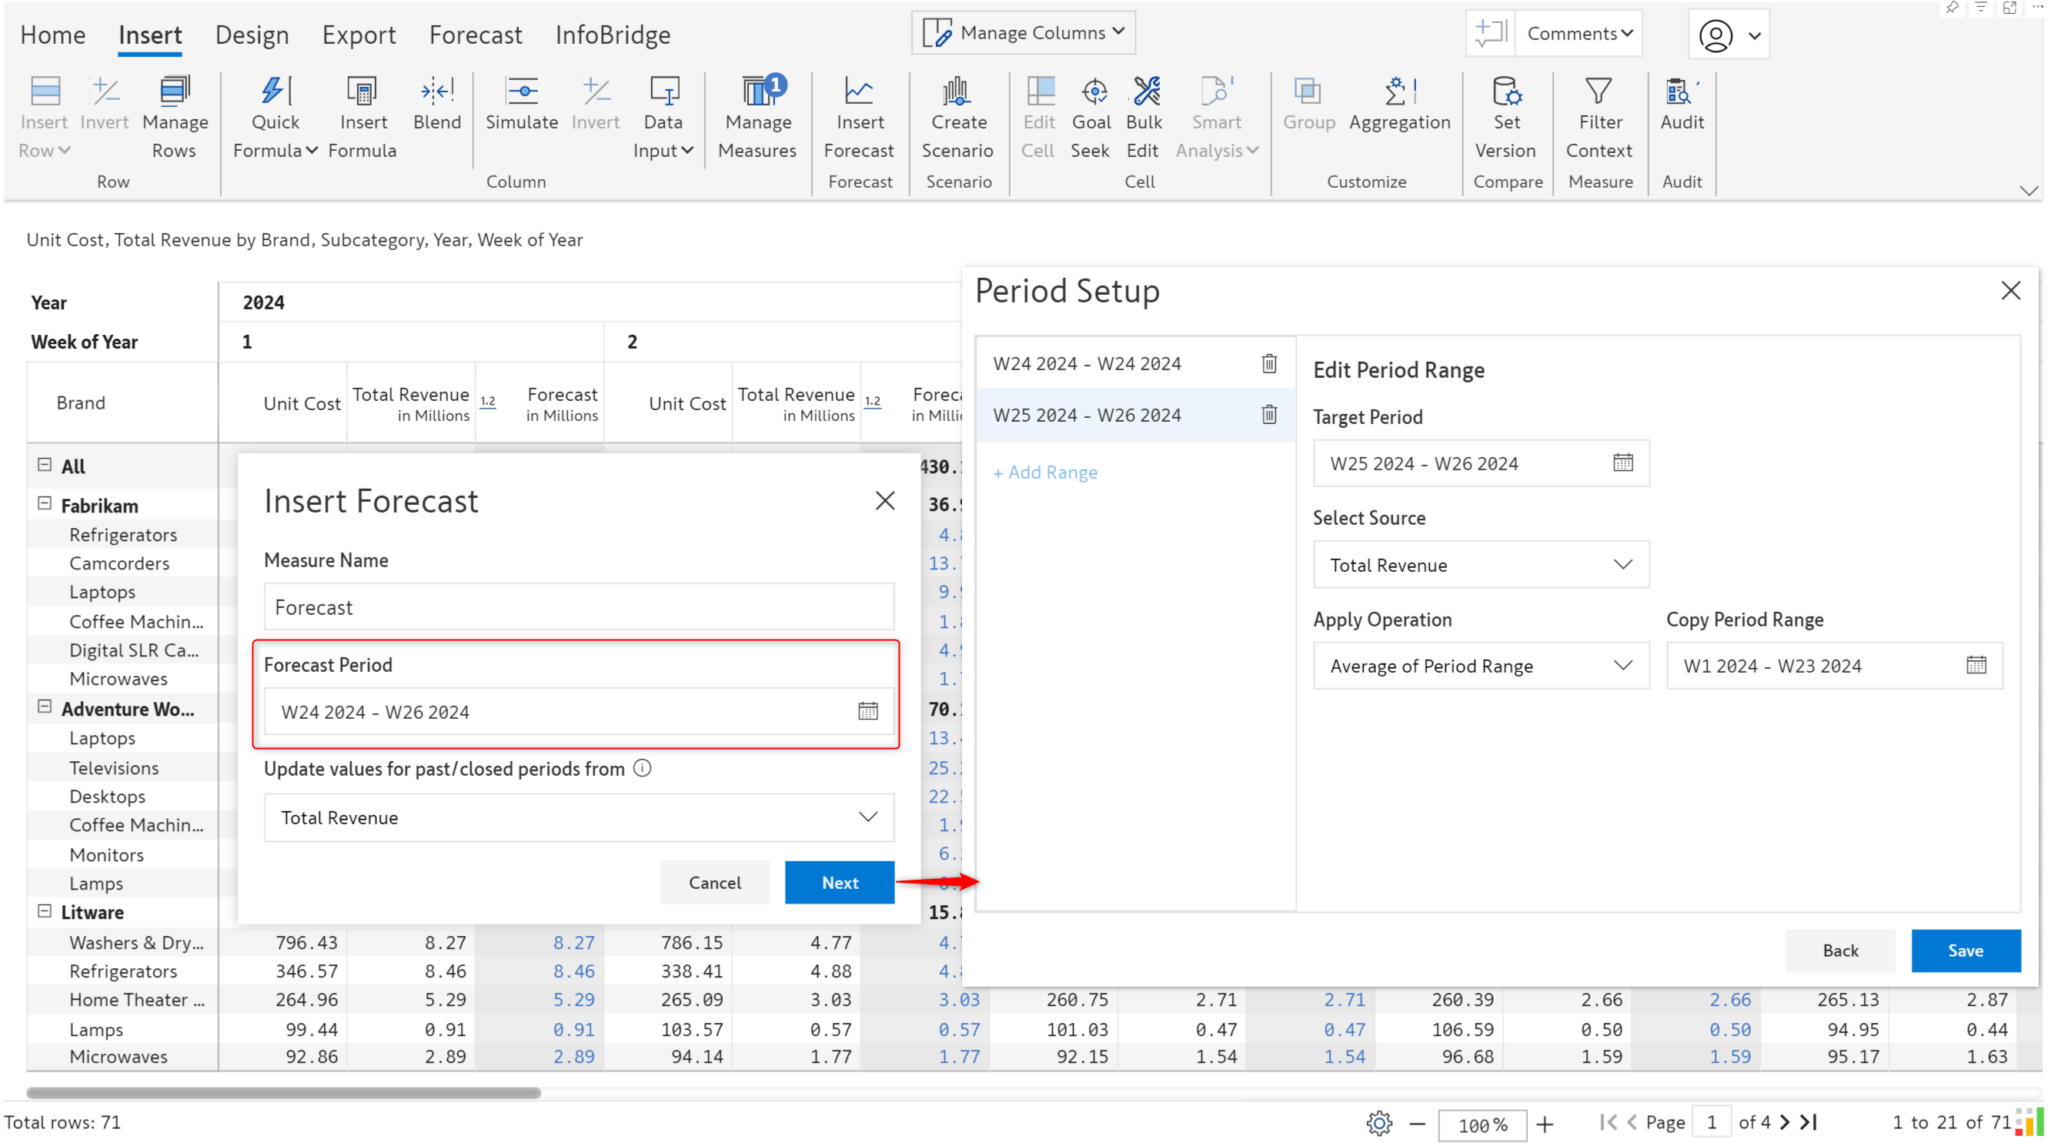
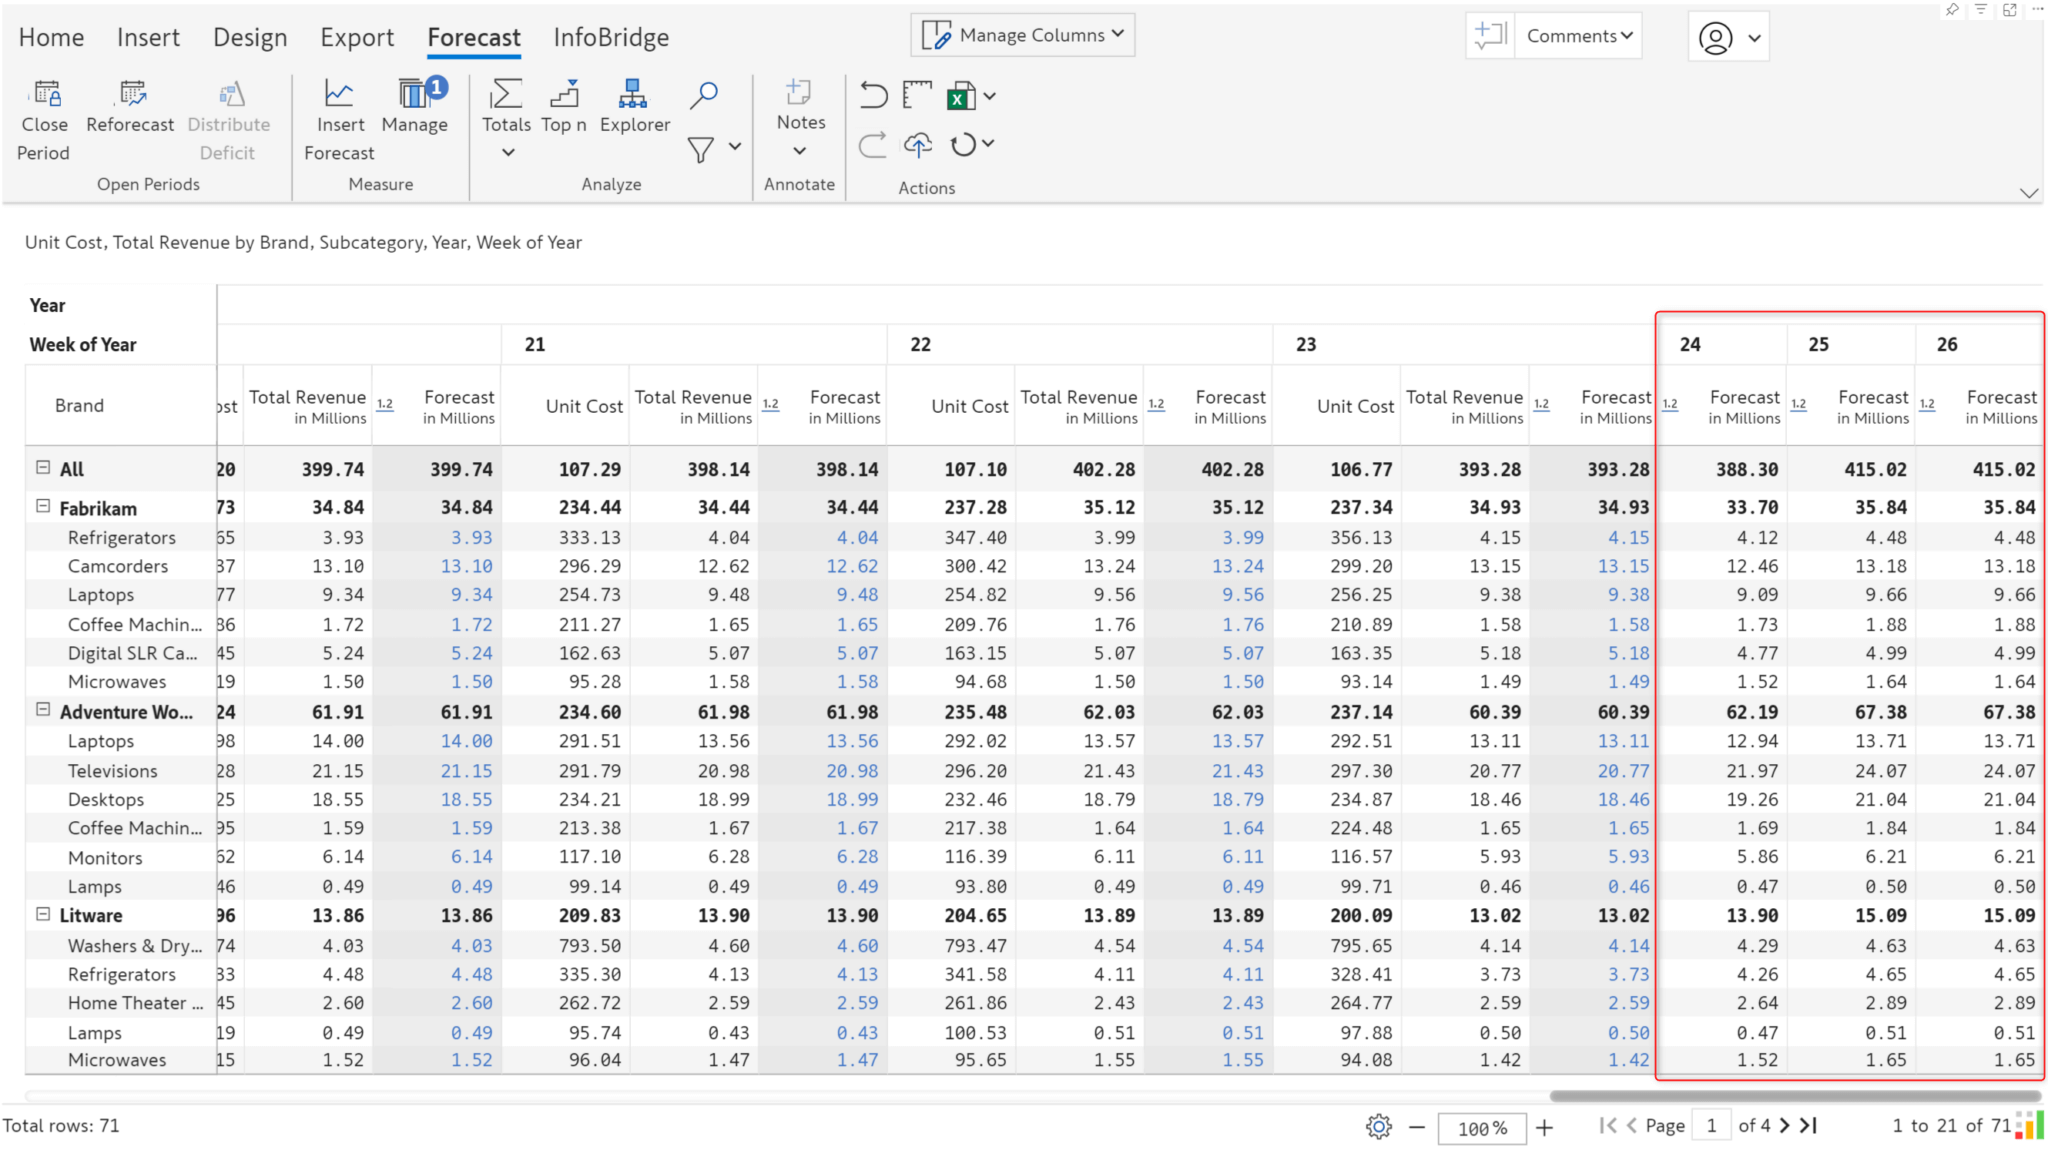
We’ve generated a weekly forecast for the last 3 weeks of June.
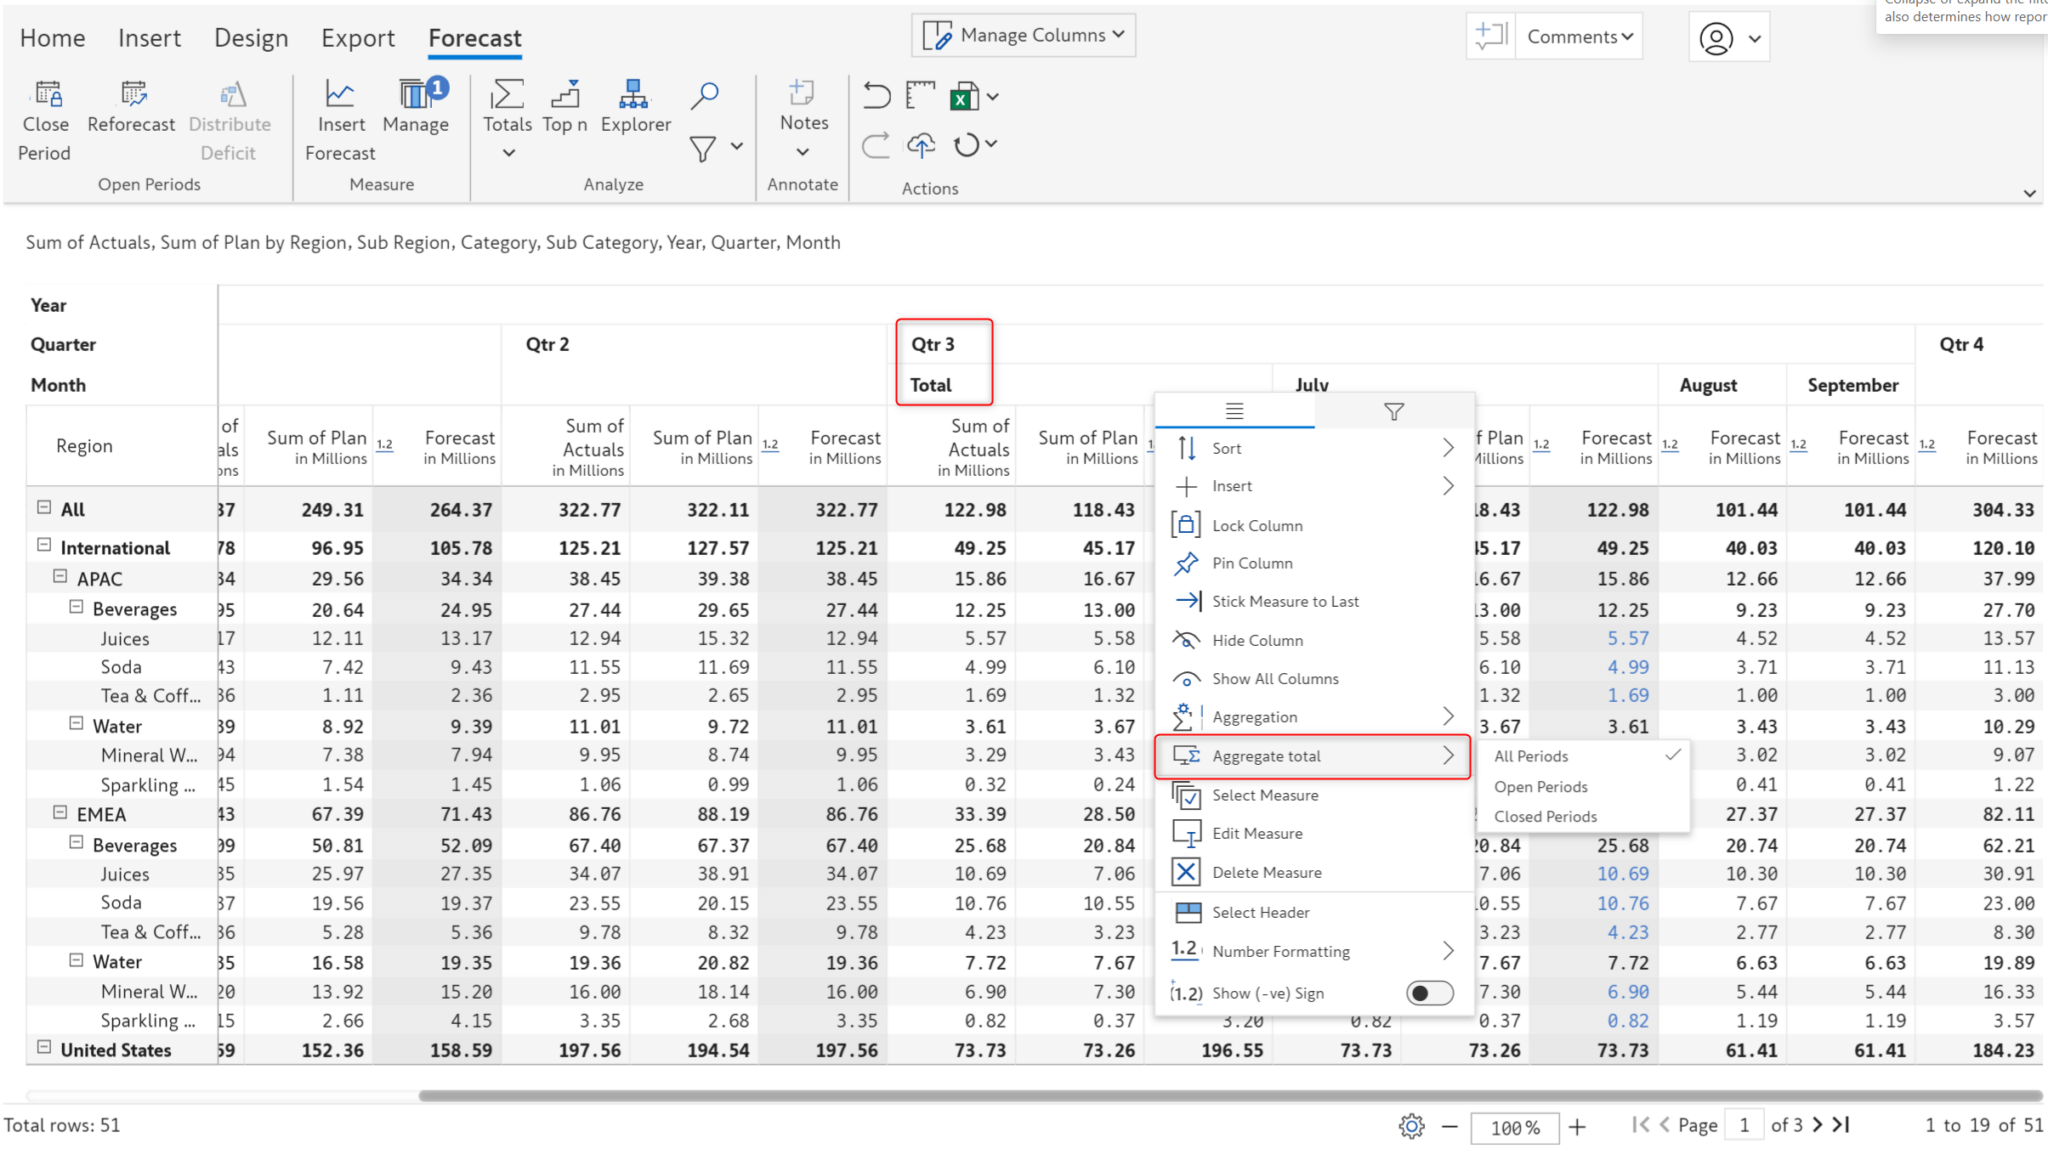
When you generate forecasts with Inforiver, you can determine whether the grand total forecast should be based on closed periods, open forecasts, or both. You now have the flexibility to determine the aggregation for forecast sub-totals . Use the column gripper for the sub-total forecast to choose between Closed, Open, and All-period options.
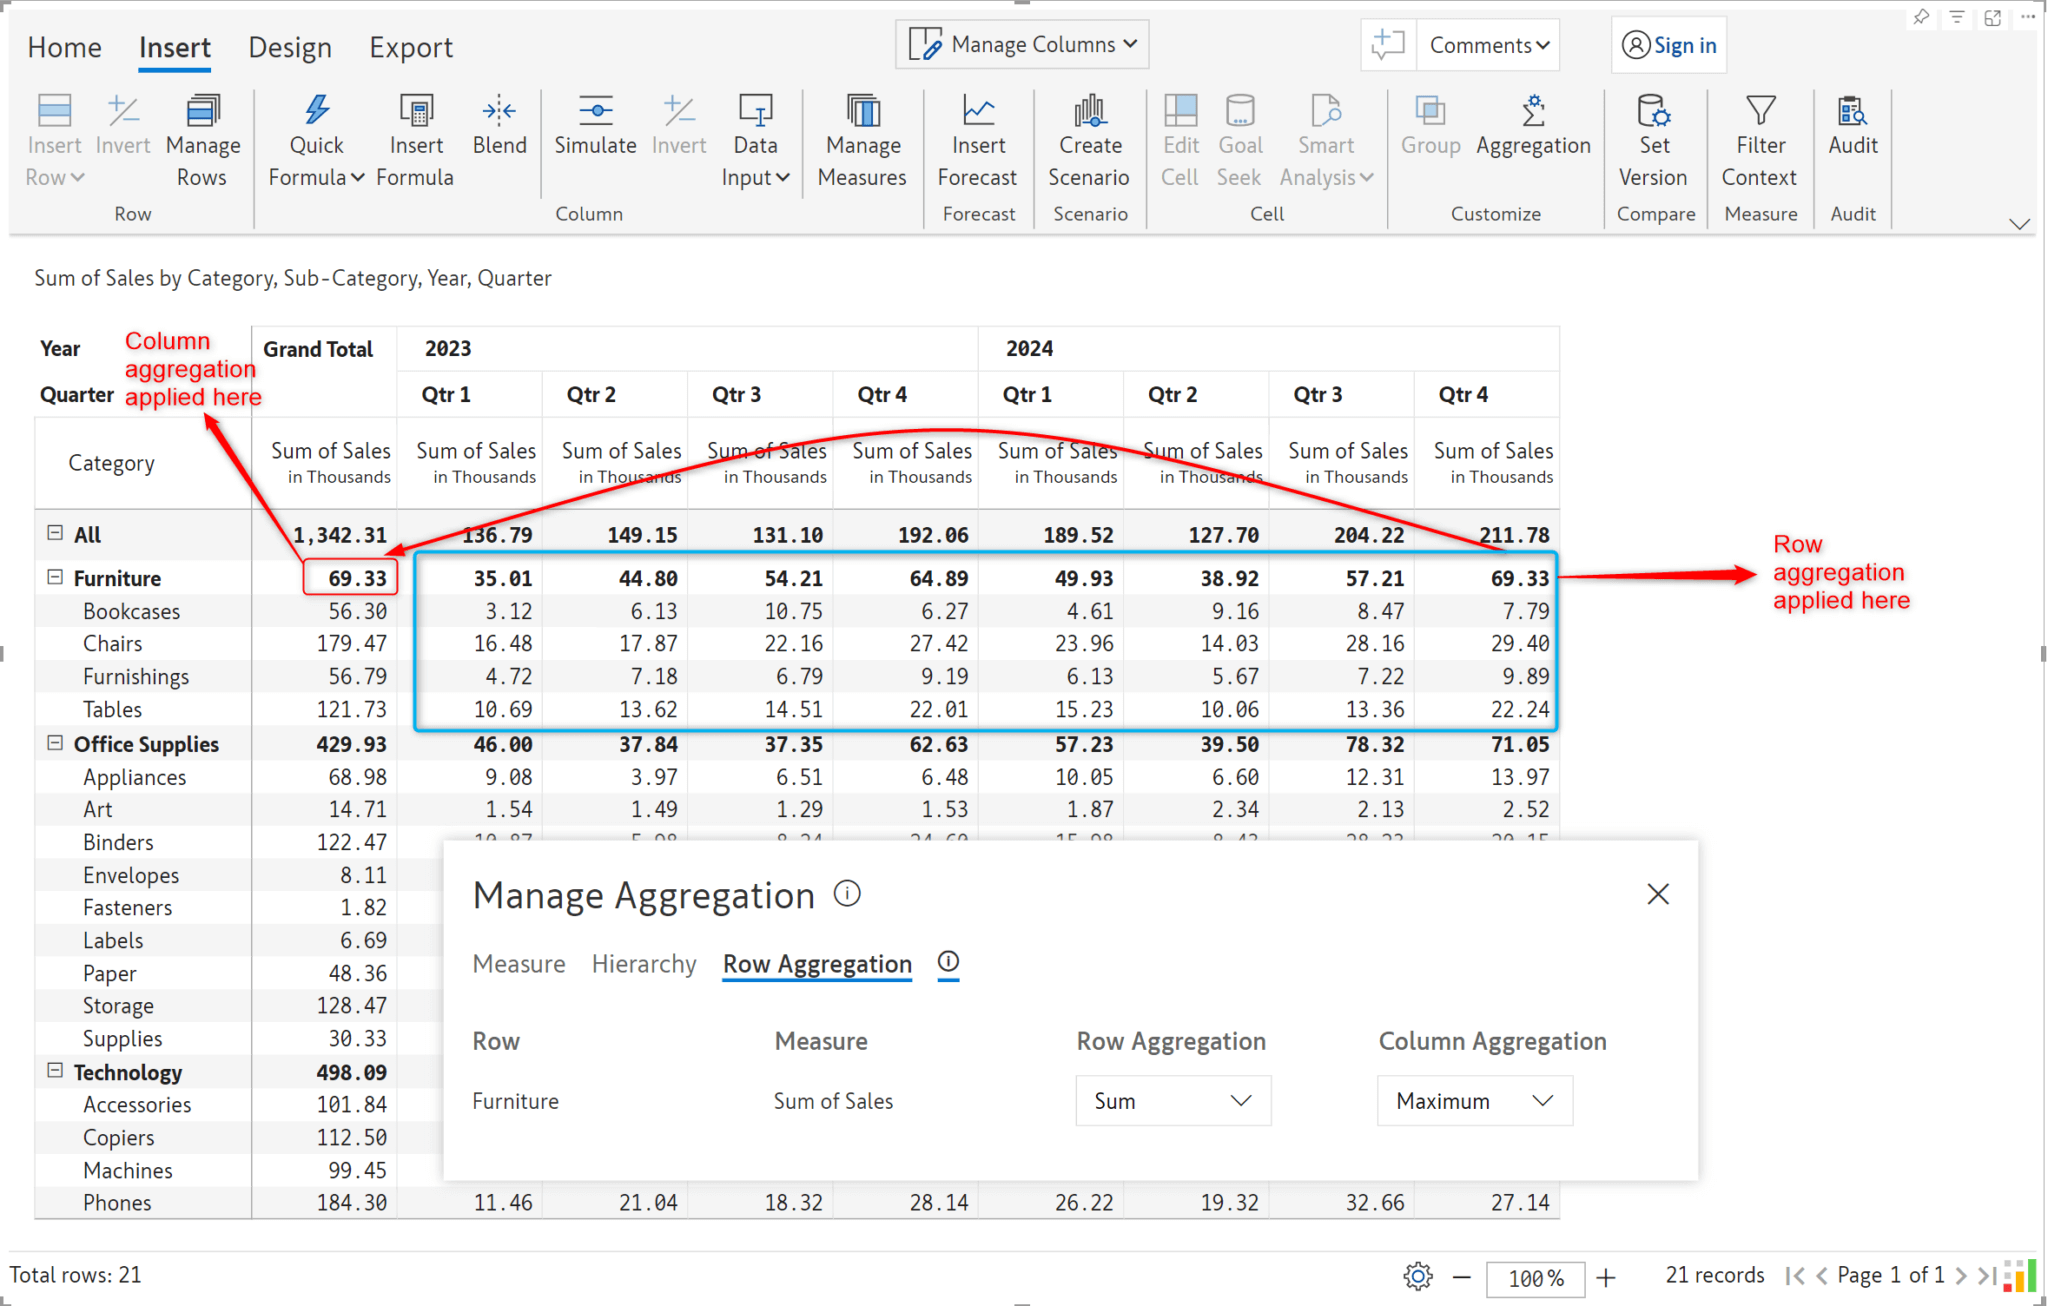
You can simultaneously apply row and column aggregation in Inforiver. Column aggregation applies only to subtotal and grand total columns – just like row aggregation applies to subtotal/grand total rows.
We’ve also enhanced the aggregation interface to display categories on which custom row or column aggregation has been applied, enabling you to track all your aggregations in a single window. In this example, notice how we have applied column aggregation (Maximum) on the Furniture grand total and row aggregation (Sum).
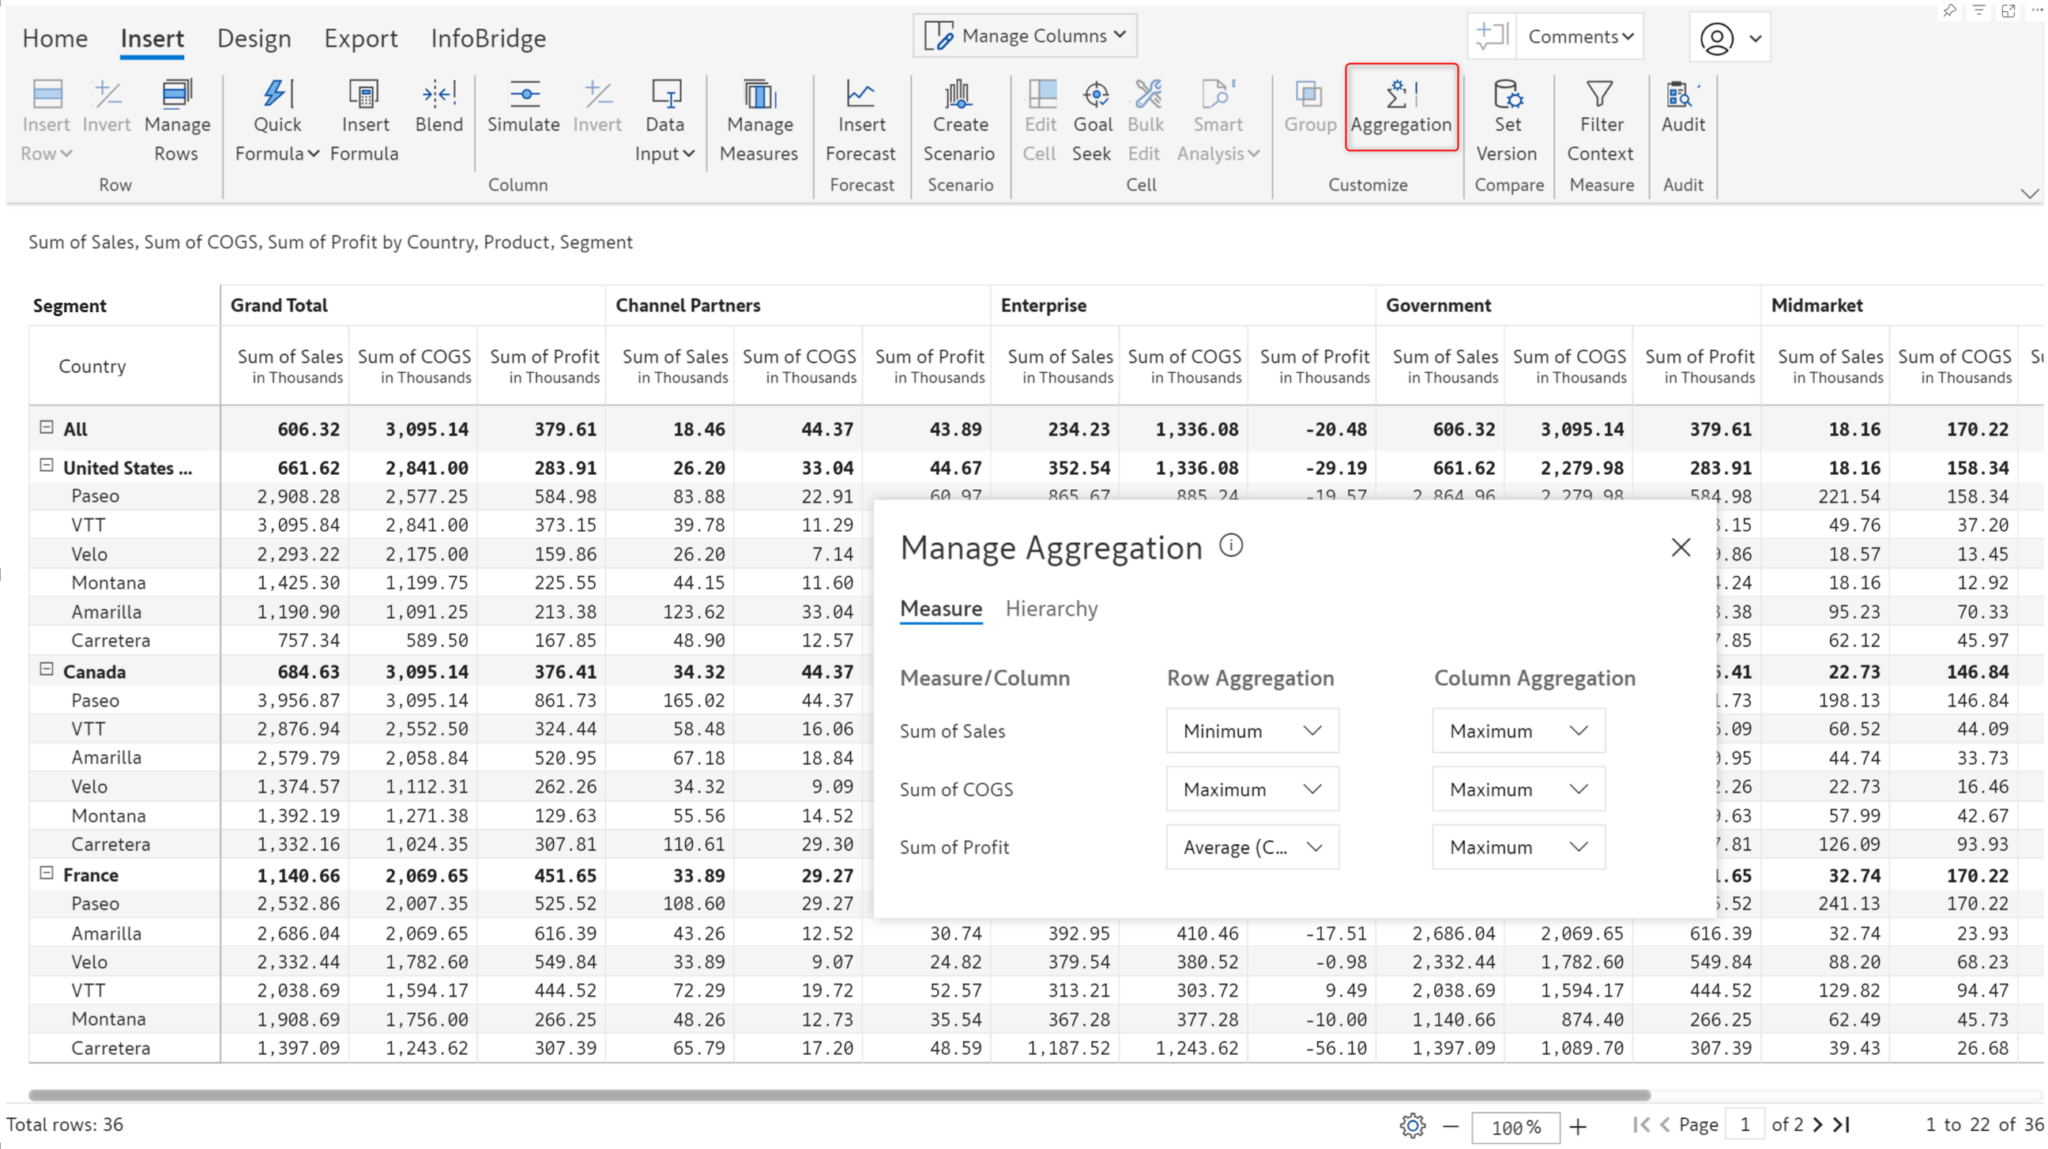
With Inforiver, you can set aggregation at multiple levels: category, measure, and report. The Manage Aggregation interface allows you to directly set each measure's row and column aggregation.
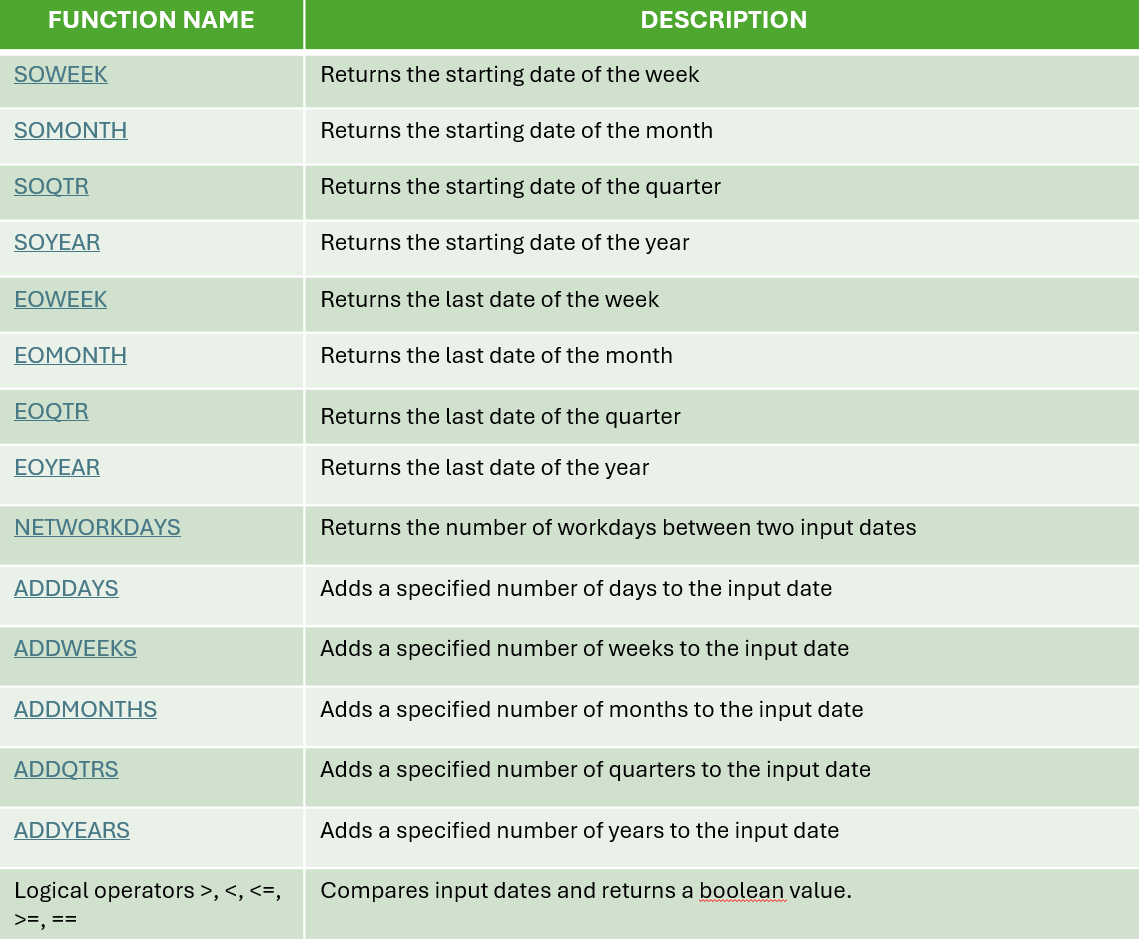
We’ve added many new data manipulation functions, such as the start of the month, the end of the quarter, the start of the year, etc.
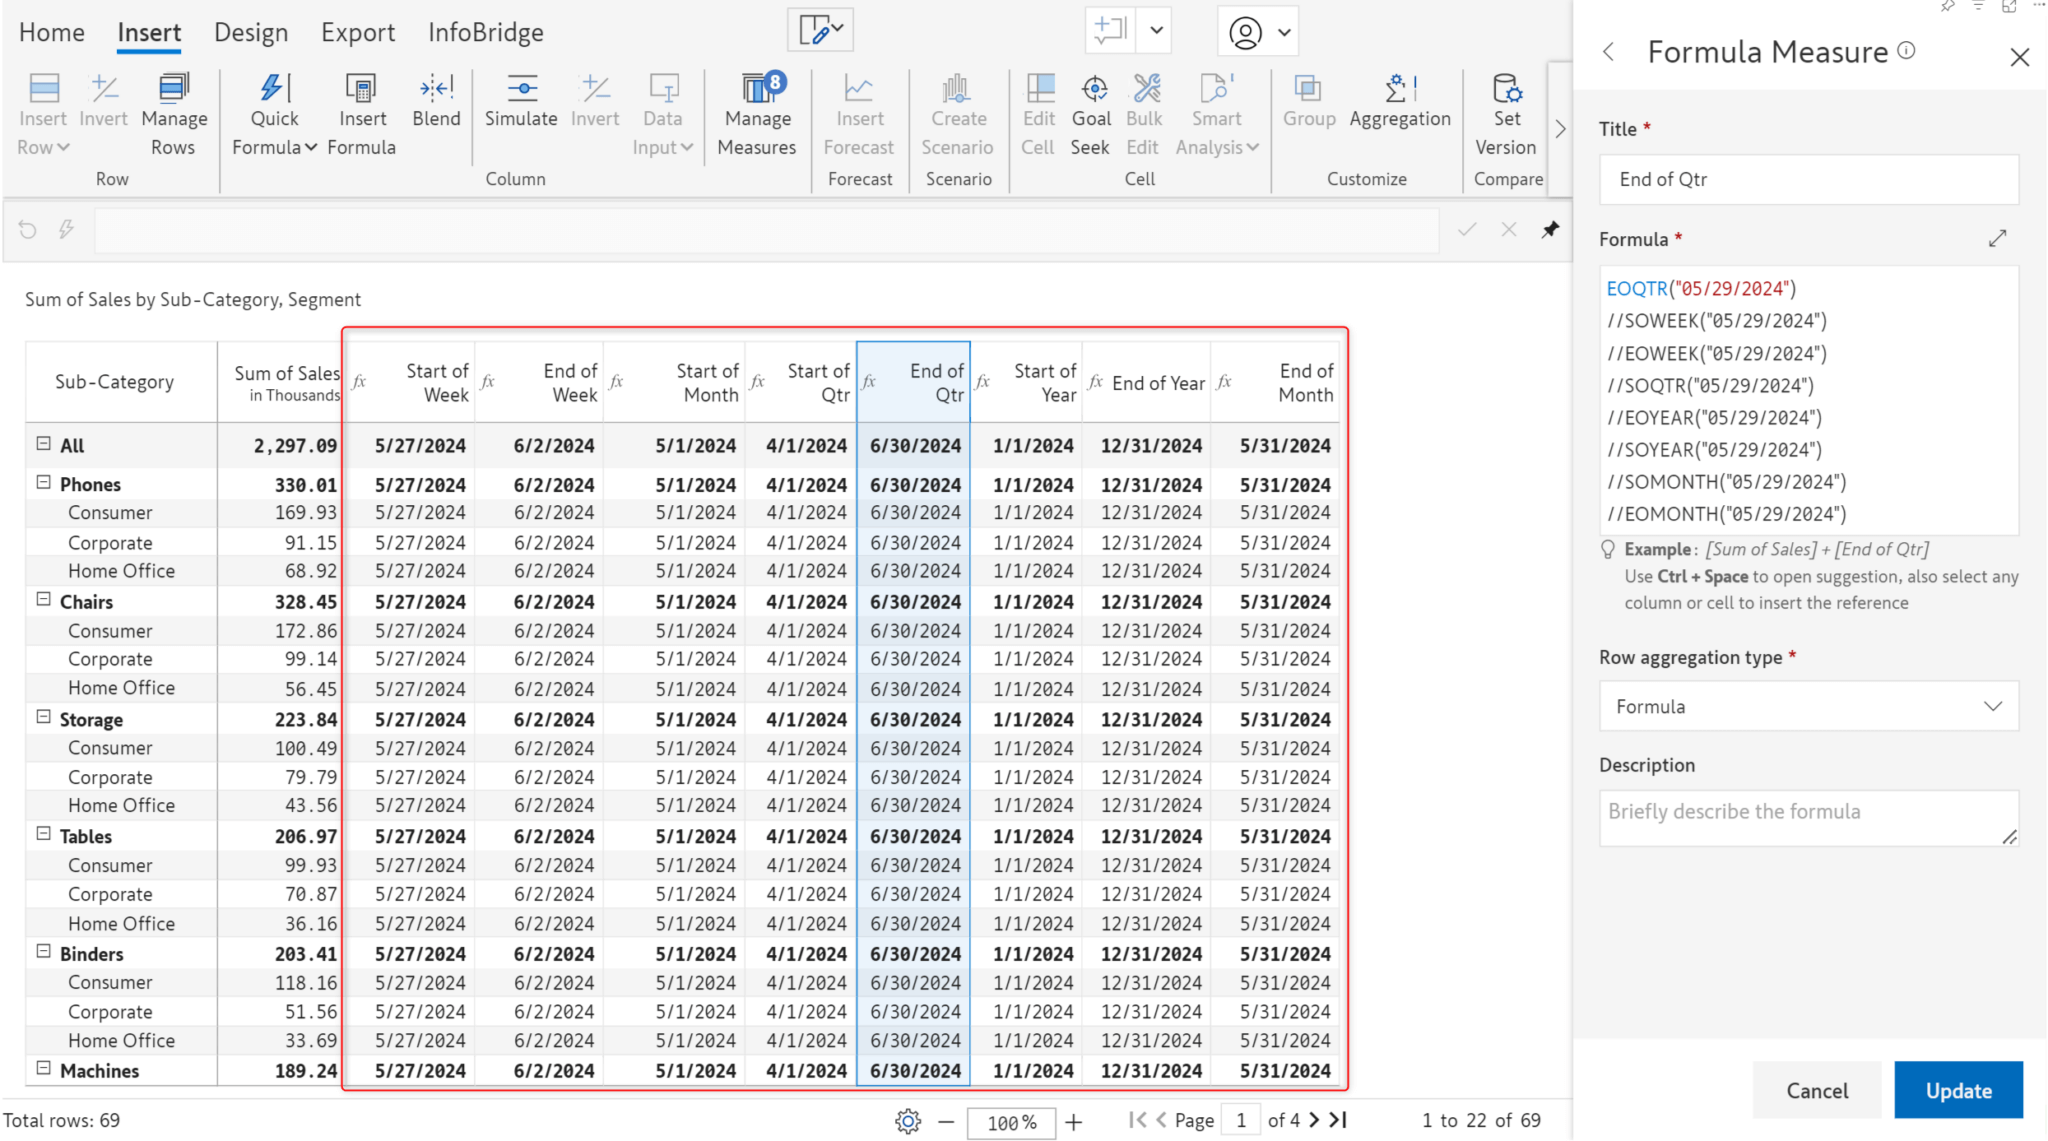
We have also introduced formulas to add days/quarters/months/years to an input date. Additionally, you can calculate the number of working days between 2 dates using the NETWORKDAYS formula. The DATE function has been enhanced to parse date values in different formats.
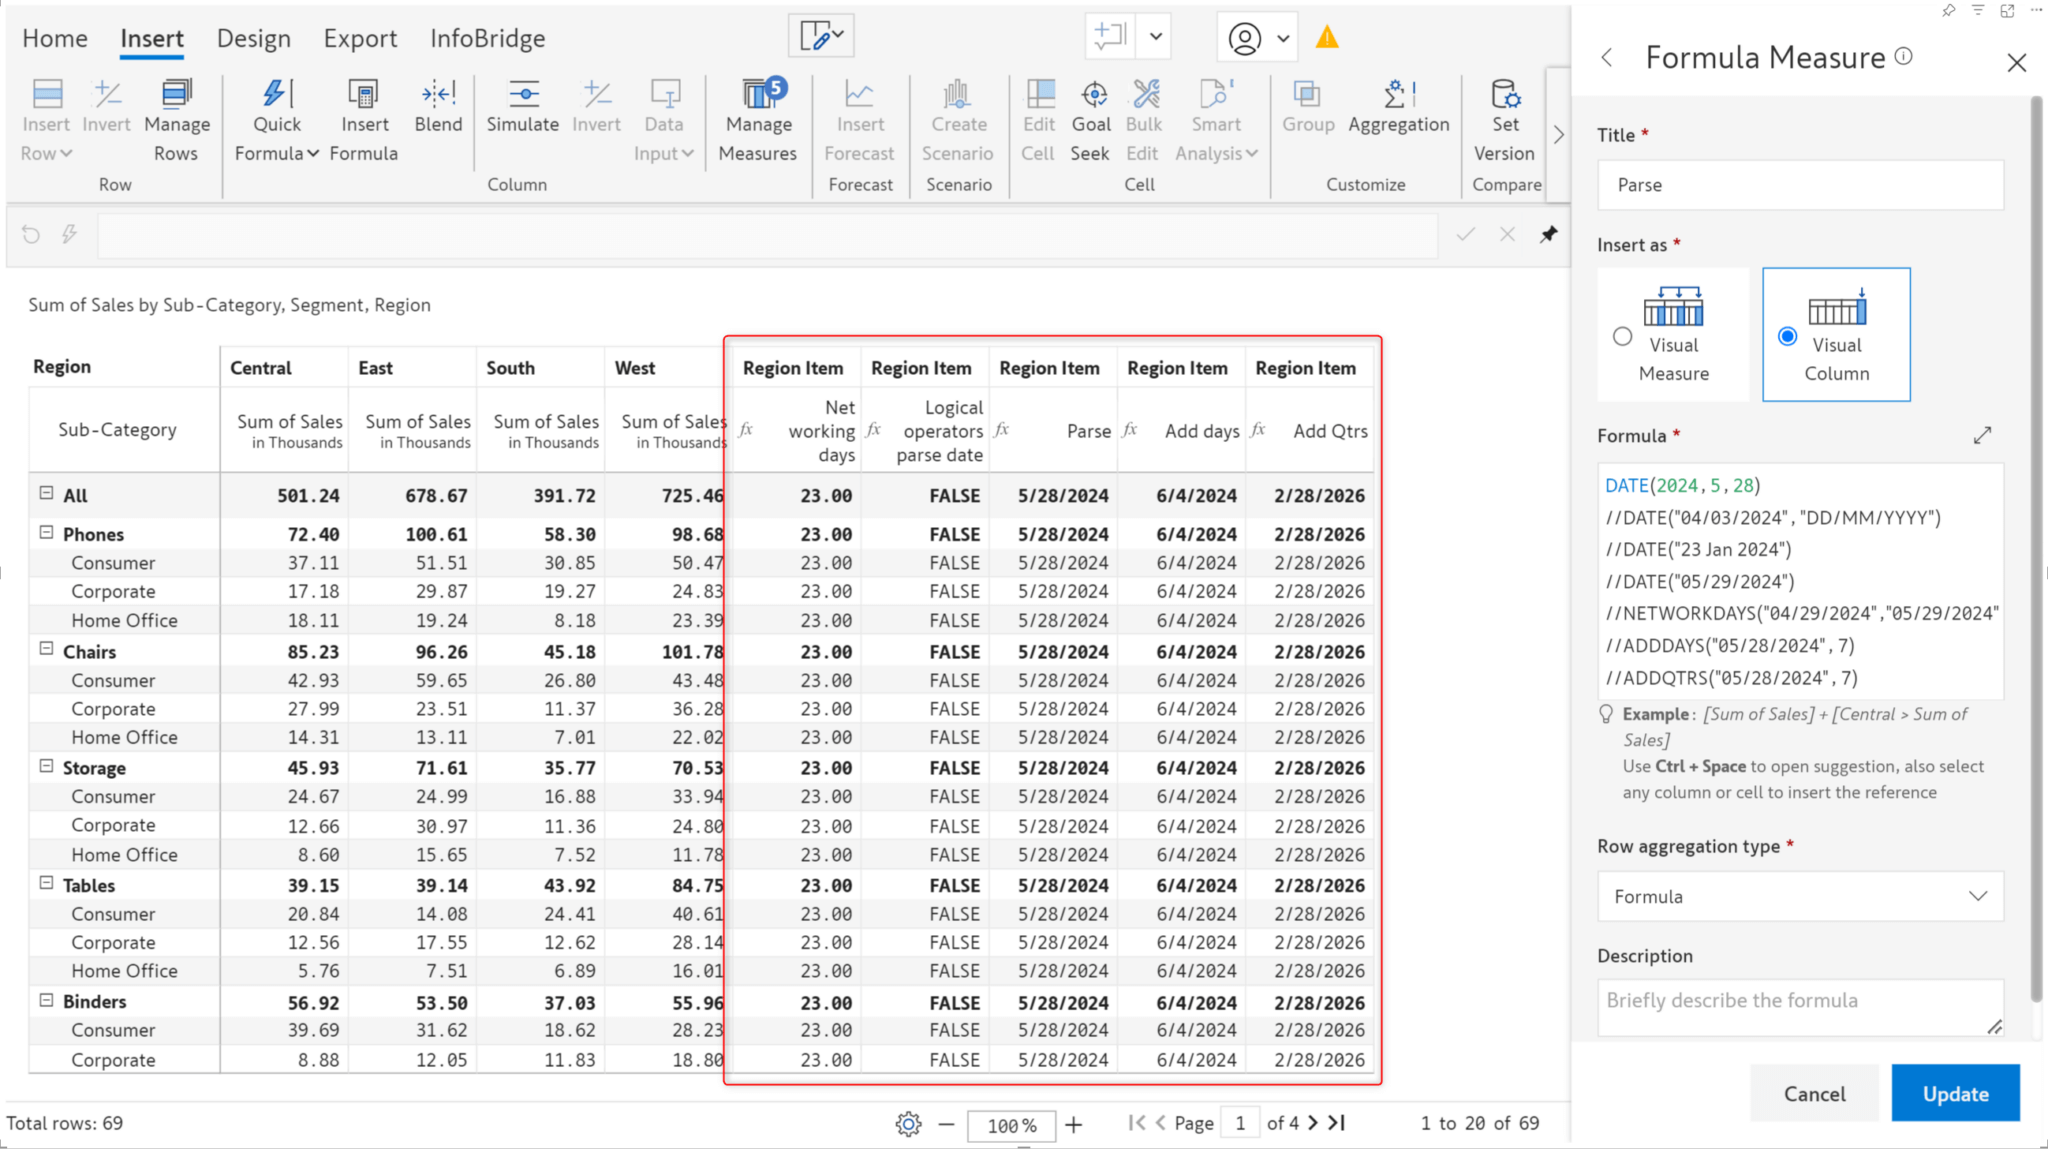
Have you written large, complex formulae and struggled with locating and fixing errors? We now display clear and concise error messages. In the maximized formula editor view, you will also notice that we have added line numbers, enabling you to quickly find and fix errors.
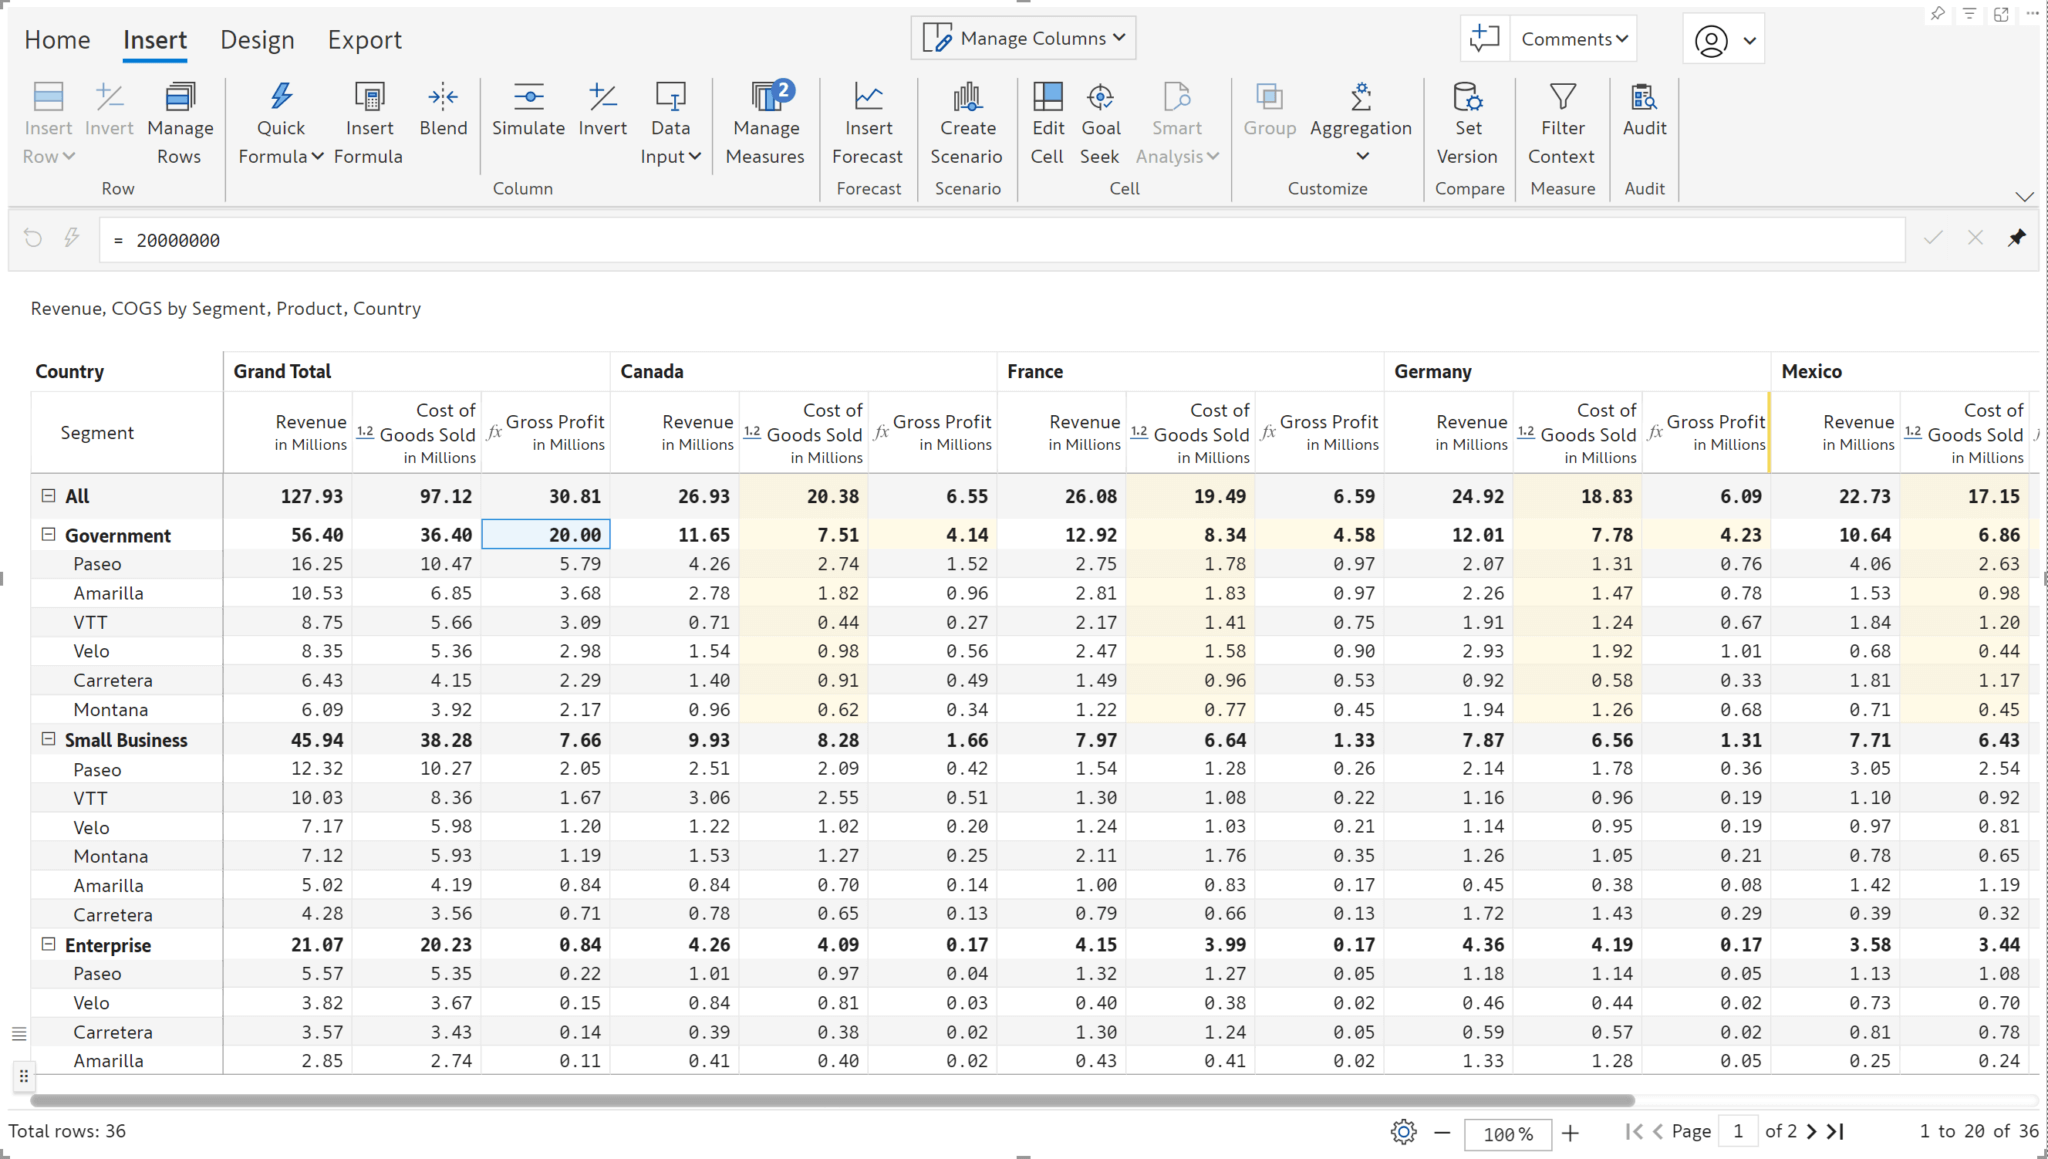
Increase your productivity with the Goal Seek feature that enables you to set targets in calculated cells. Inforiver can dynamically compute and adjust data input values to achieve the target. When you use Goal Seek for grand totals or subtotals, Inforiver will adjust all the child cells, saving you repeated computations.
In the demonstration, we have calculated Gross Profit using the formula Revenue – COGS.
To set an overall target of 20m Gross Profit for the Government segment, we can configure the Goal Seek options as shown below:
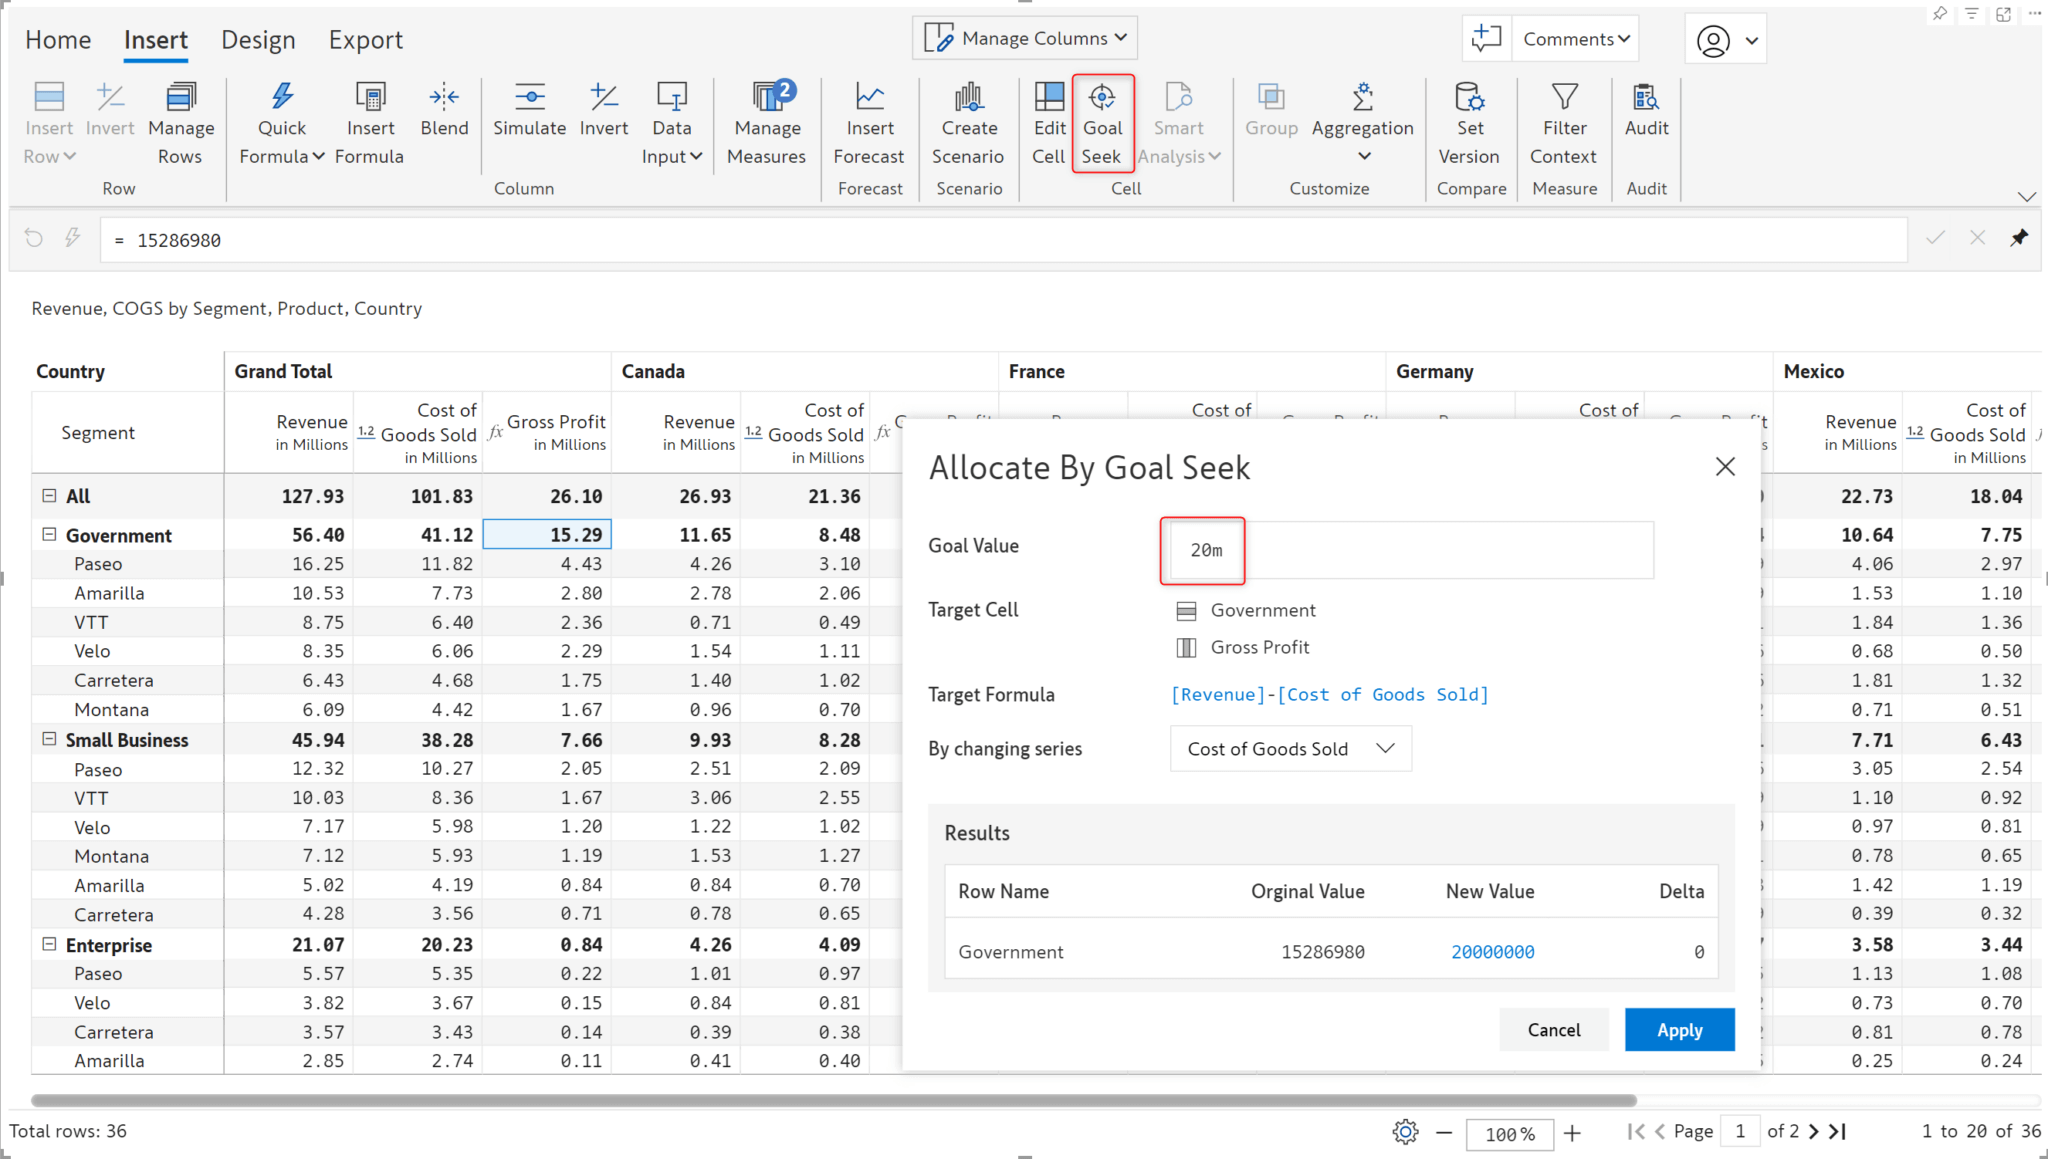
Notice how Inforiver automatically updates all the COGS cells that contribute to the Government segment's gross profit. The cells that are updated to align with the target value are highlighted. You can set goals for individual measure cells, too—not just at the grand total level.
Report viewers may apply formatting/Inforiver filters for data analysis and save their changes using the Power BI bookmarking feature. However, if the report author makes any changes to the report, the viewers may not be able to see these changes when bookmarks are applied.
A new option has been added to the Allowed User Controls window, which allows users to use bookmarks.
When the Show Read View Bookmark option is enabled in Allowed user controls, you will notice a Read view bookmarking toggle in the reading view. When the toggle is disabled, users can create bookmarks, but changes will not be persisted.
Inforiver and all of our planning and analytics products continue to be updated to provide a diverse range of users with optimal performance. With continual improvements and innovations planned, we welcome your feedback. Visit the Inforiver Community to share your ideas, vote on others’ submissions, and interact with other users.
Discover new planning, reporting, and analytics innovations with Inforiver today.

Inforiver helps enterprises consolidate planning, reporting & analytics on a single platform (Power BI). The no-code, self-service award-winning platform has been recognized as the industry’s best and is adopted by many Fortune 100 firms.
Inforiver is a product of Lumel, the #1 Power BI AppSource Partner. The firm serves over 3,000 customers worldwide through its portfolio of products offered under the brands Inforiver, EDITable, ValQ, and xViz.