Upcoming webinar on 'Inforiver Charts : The fastest way to deliver stories in Power BI', Aug 29th , Monday, 10.30 AM CST. Register Now
Upcoming webinar on 'Inforiver Charts : The fastest way to deliver stories in Power BI', Aug 29th , Monday, 10.30 AM CST. Register Now
Welcome to the Inforiver Writeback Matrix 3.1. release updates!
The June deployment was a landmark release introducing inter-visual communication, real-time updates, and data transformation with the Infobridge integration. In the July release, we’ve made collaborative adjustments possible between the Infobridge source and target measures. The latest version of Infobridge also supports time extensions for forecast measures and ragged hierarchies.
Other key initiatives include bulk editing for scenarios, dynamic subscriptions, data input rows from semantic models, the ability to handle high data volumes in the scheduler, and accessibility with keyboard shortcuts. We have also refined comments processing in Inforiver by optimizing the number of API calls.
Discover the innovations driving our product as we continue to deliver the features most anticipated by the Inforiver community. Thank you for choosing Inforiver!
The release notes are organized into toolbar sections. Feel free to explore the sections that interest you.
1.1. Importing forecasts with time extensions
1.3. Dynamic inter-visual sync event notifications
1.4. Row ID mapping in source and destination visuals
1.5. Collaborative adjustments to measures imported from Infobridge
1.6. Totals and subtotals in Infobridge writeback
1.7. Reinstate measure values after dimension changes
2.1. Simplified authentication for Databricks writeback destination
2.2. Ten-digit decimal precision and non-numeric field length for writeback data
3.1. Add default date value for date data input column
3.2. Bulk editing for all data input types
3.3. Display style options for single and multi-select
3.4. Insert rows from semantic models
3.5. Insert rows – support for blank categories
4.1. Aggregation for sub-total forecasts
5.1. Support for bulk editing in scenarios
6.1. Formula reference for forecast-open and closed periods
6.2. Error messages with line number support in the formula bar
6.3. Reference date values in measure headers
7.1. Add report-level comments
8.2. Support for high data volume
9.1. Keyboard shortcut keys to improve accessibility
9.2. License details in admin console profile
9.3. Disable bookmarks in reading view
You can have historical and current data in one visual and may have configured your forecasts in a different Inforiver visual. In the latest version, you can import forecasts using Infobridge. Inforiver can detect and seamlessly integrate future periods from a bridge.
To demonstrate this feature, we created a Forecast for 2025 and then created a bridge to access the forecast data.
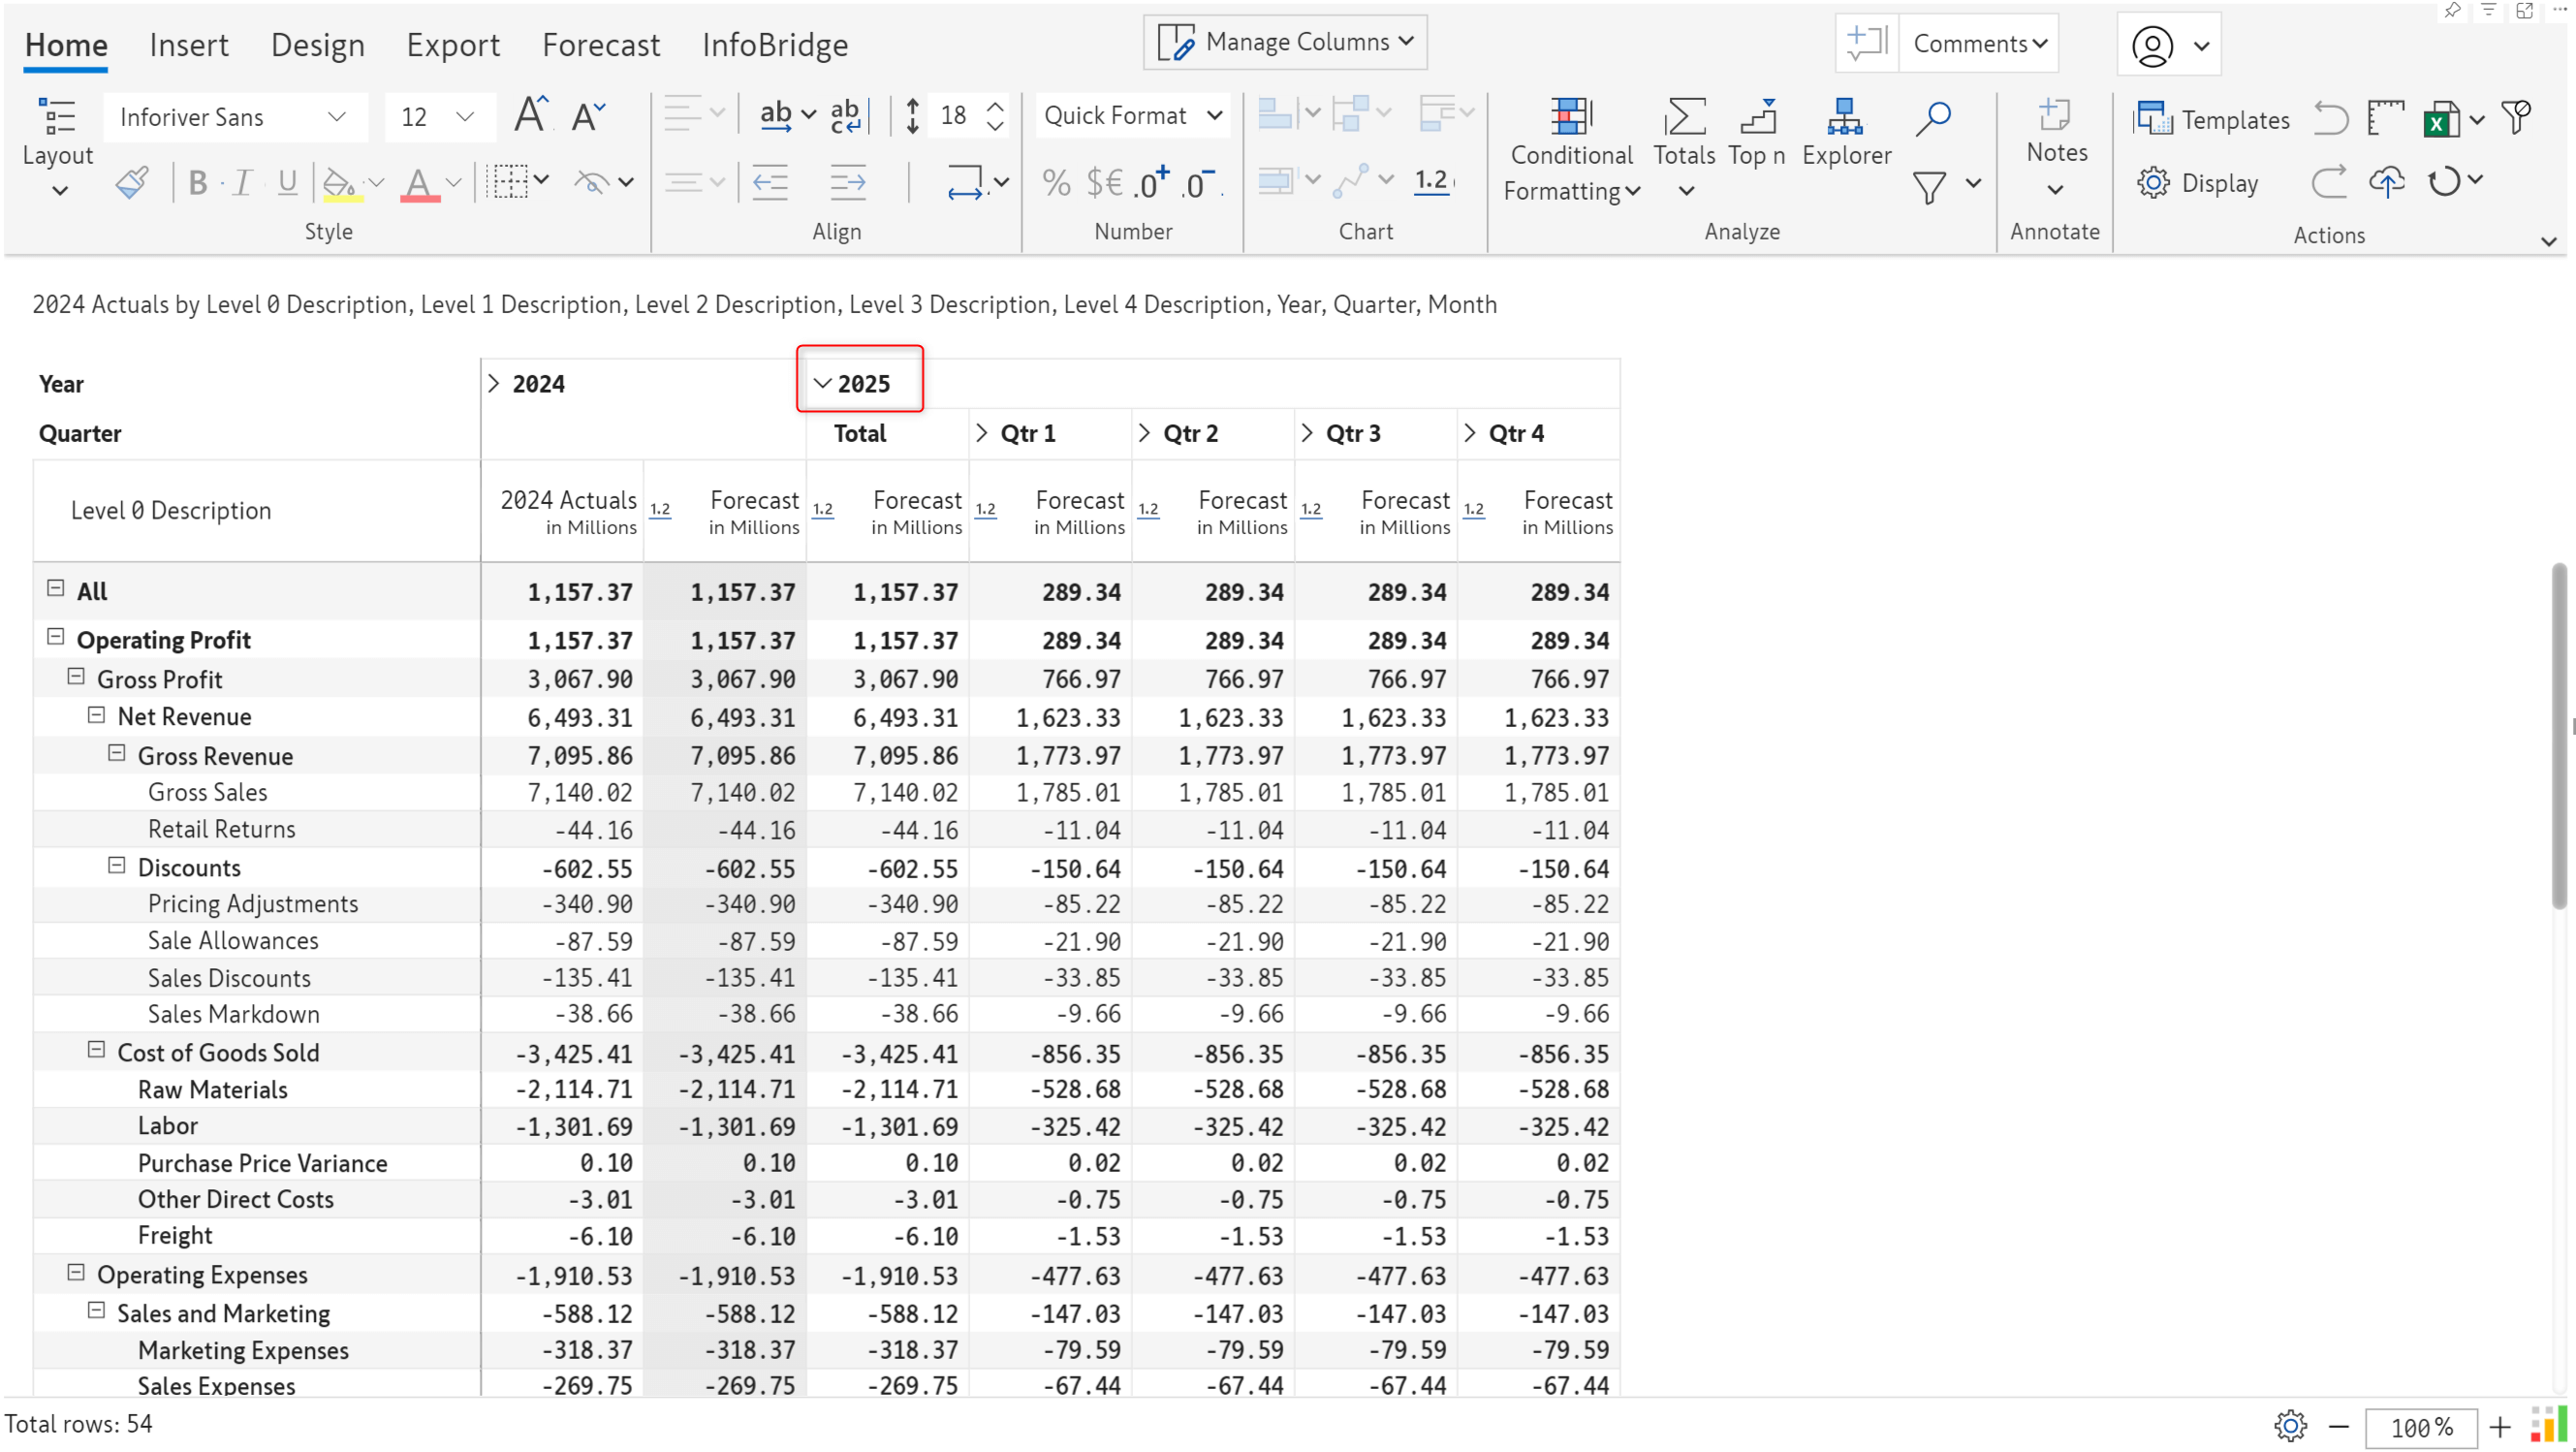
The target visual contains historical/current sales for 2022, 2023, and 2024 – we integrated the forecast into this visual.
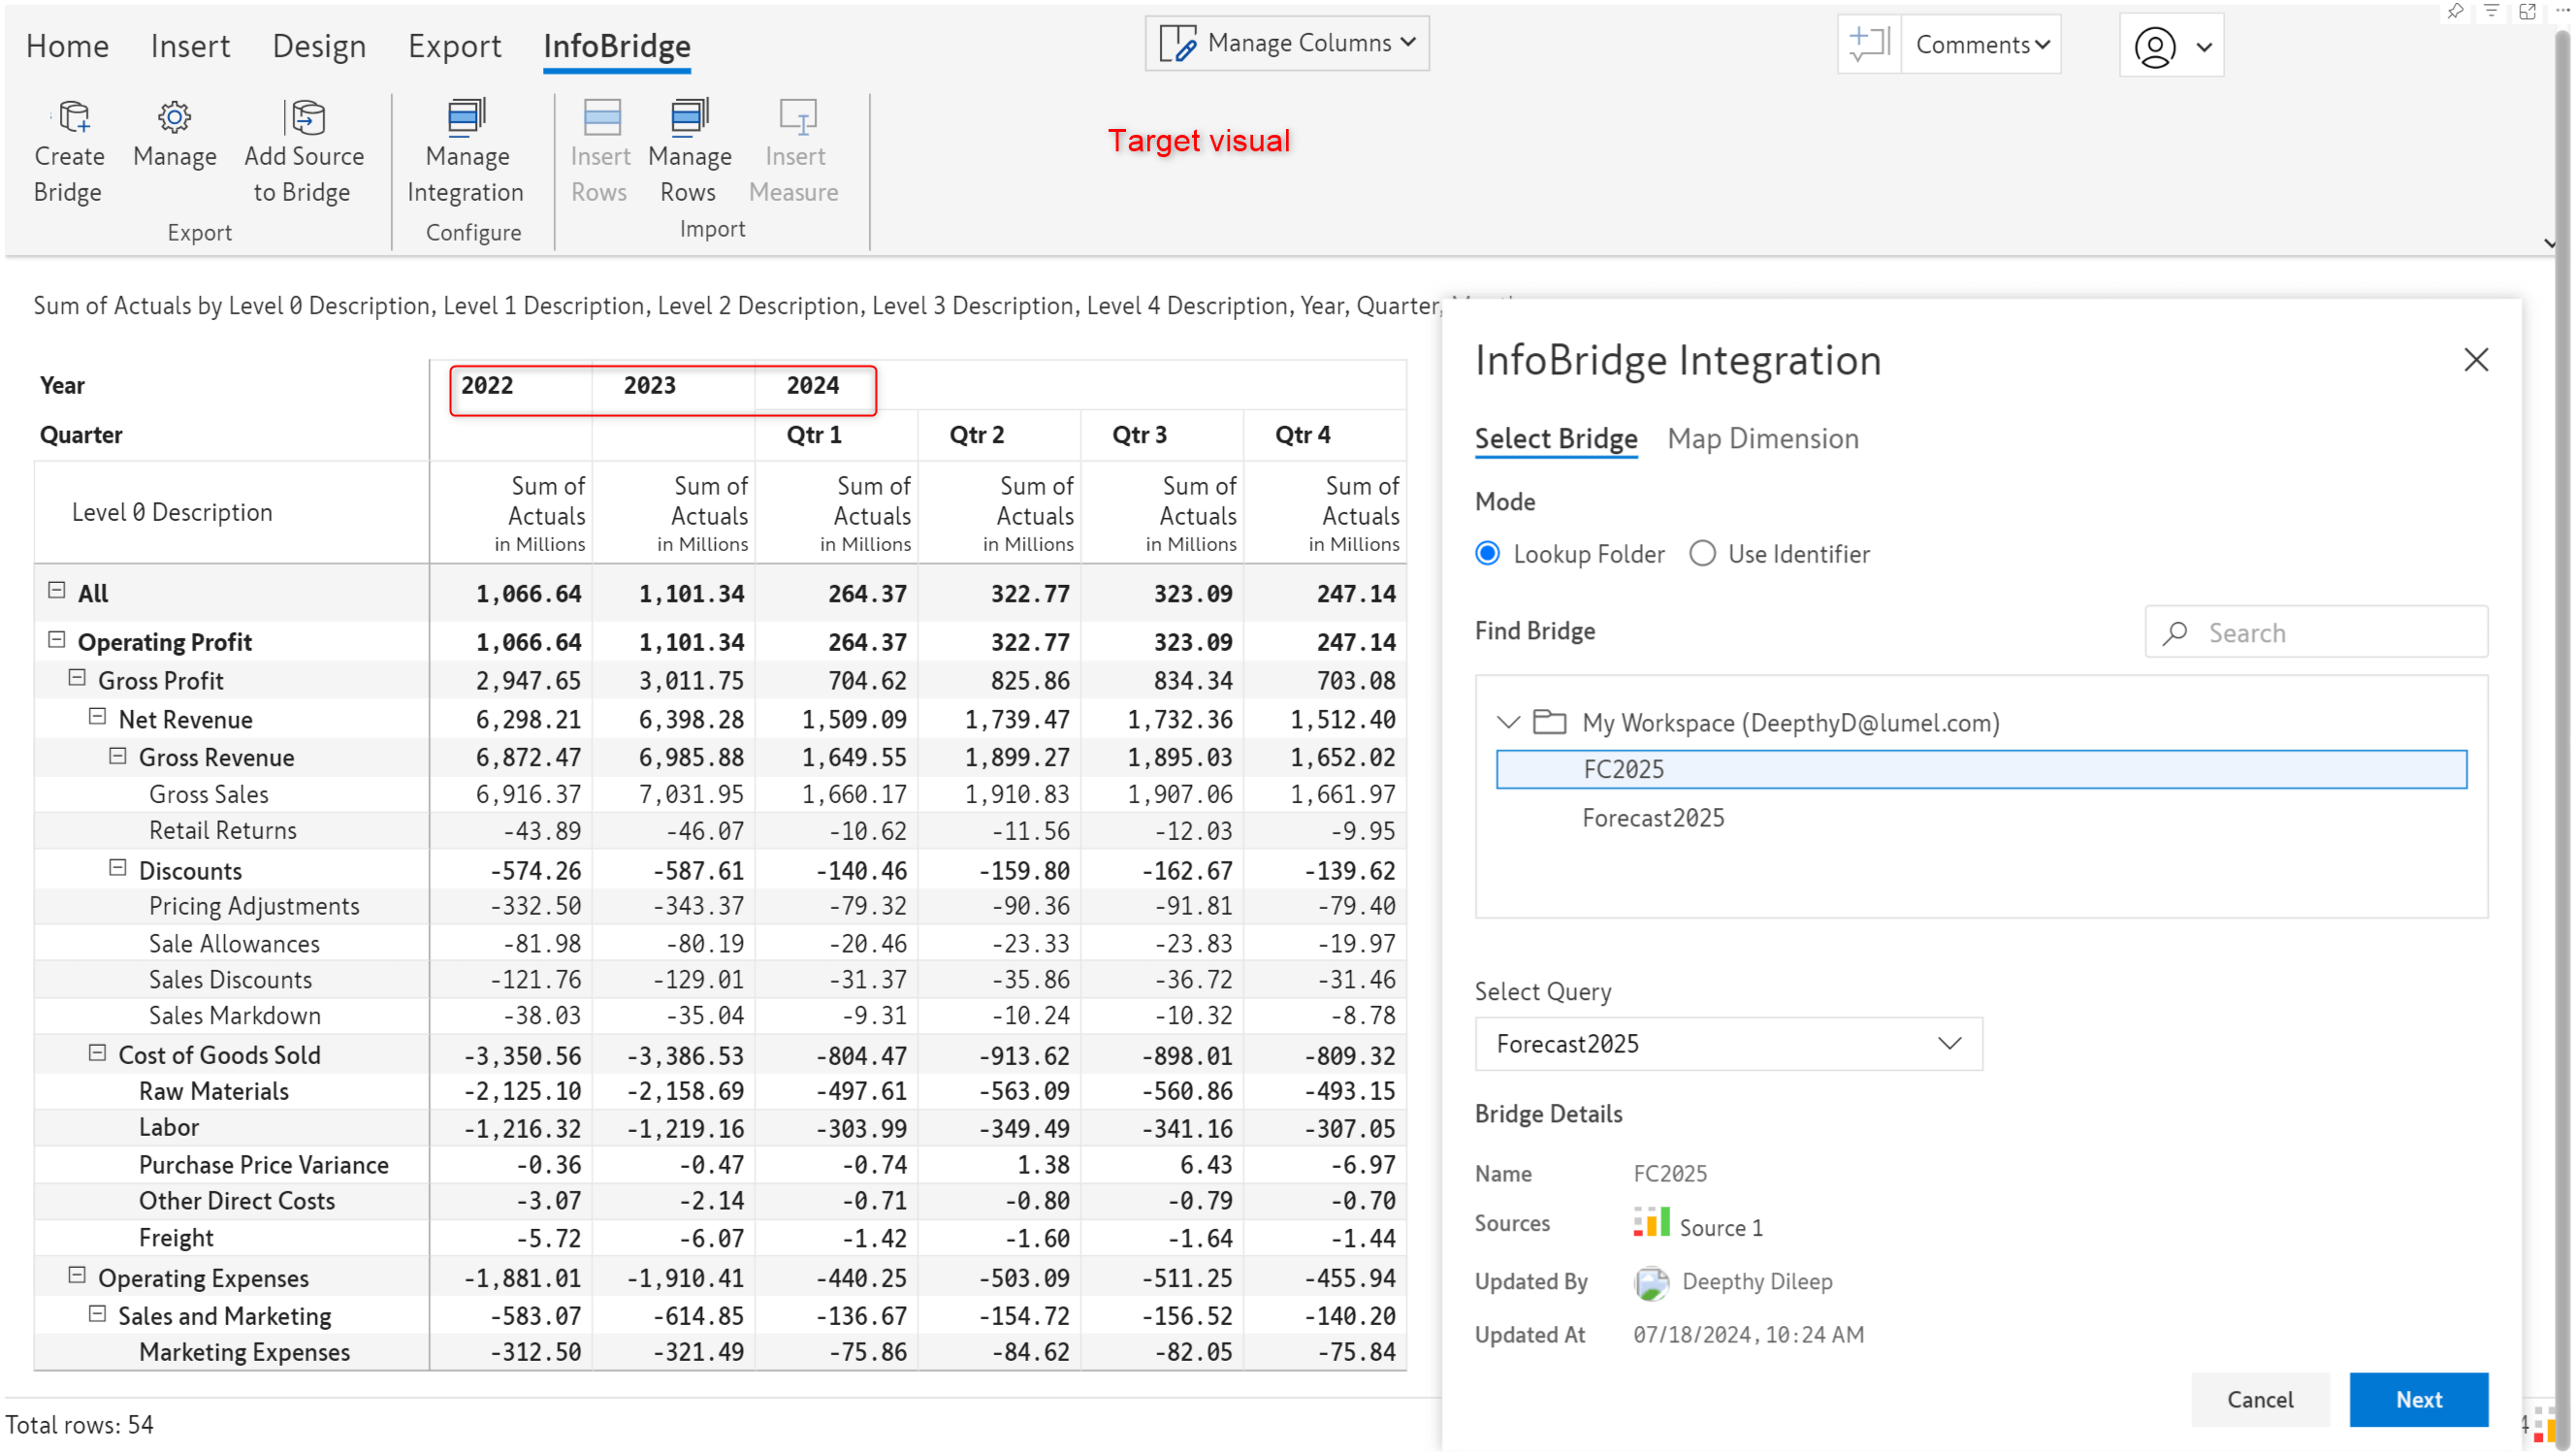
In the June version of Inforiver, you would have to create placeholder columns in your target report and map the forecast measure to them. In the latest version, you can directly use the Insert Measure option, and Inforiver can create the time extension without manual intervention.
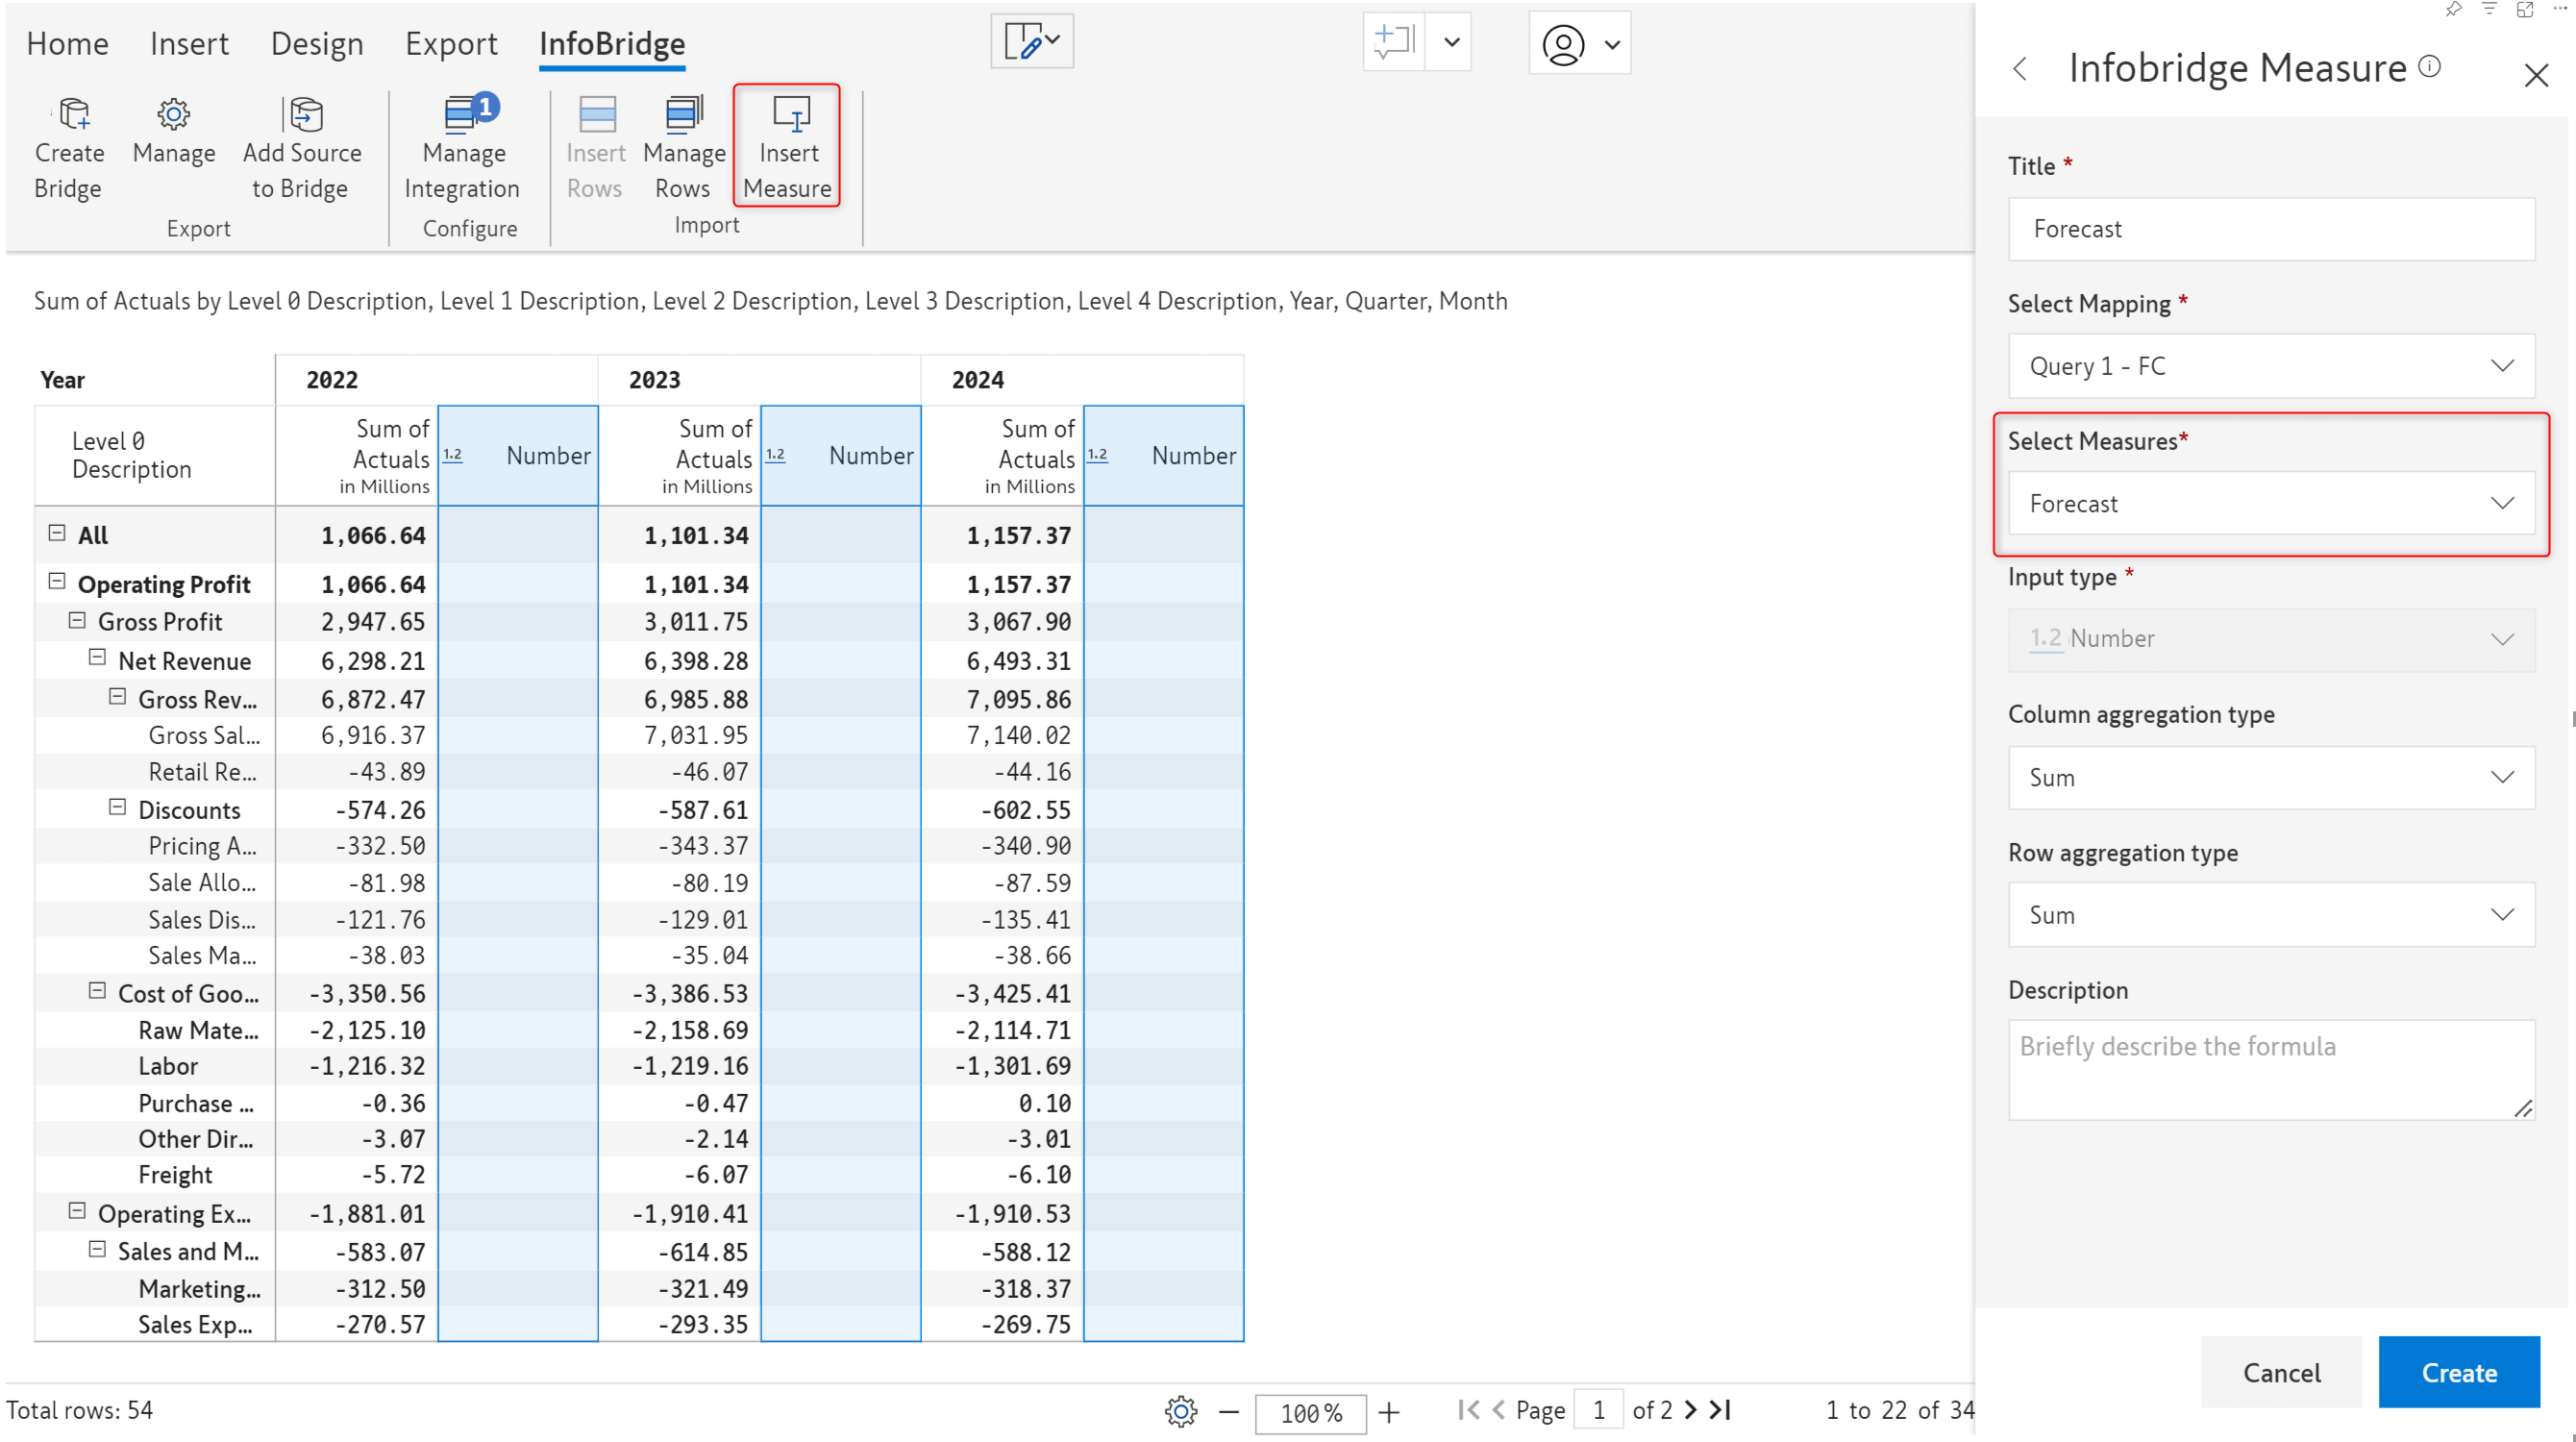
The forecast for 2025 is automatically imported from the bridge.
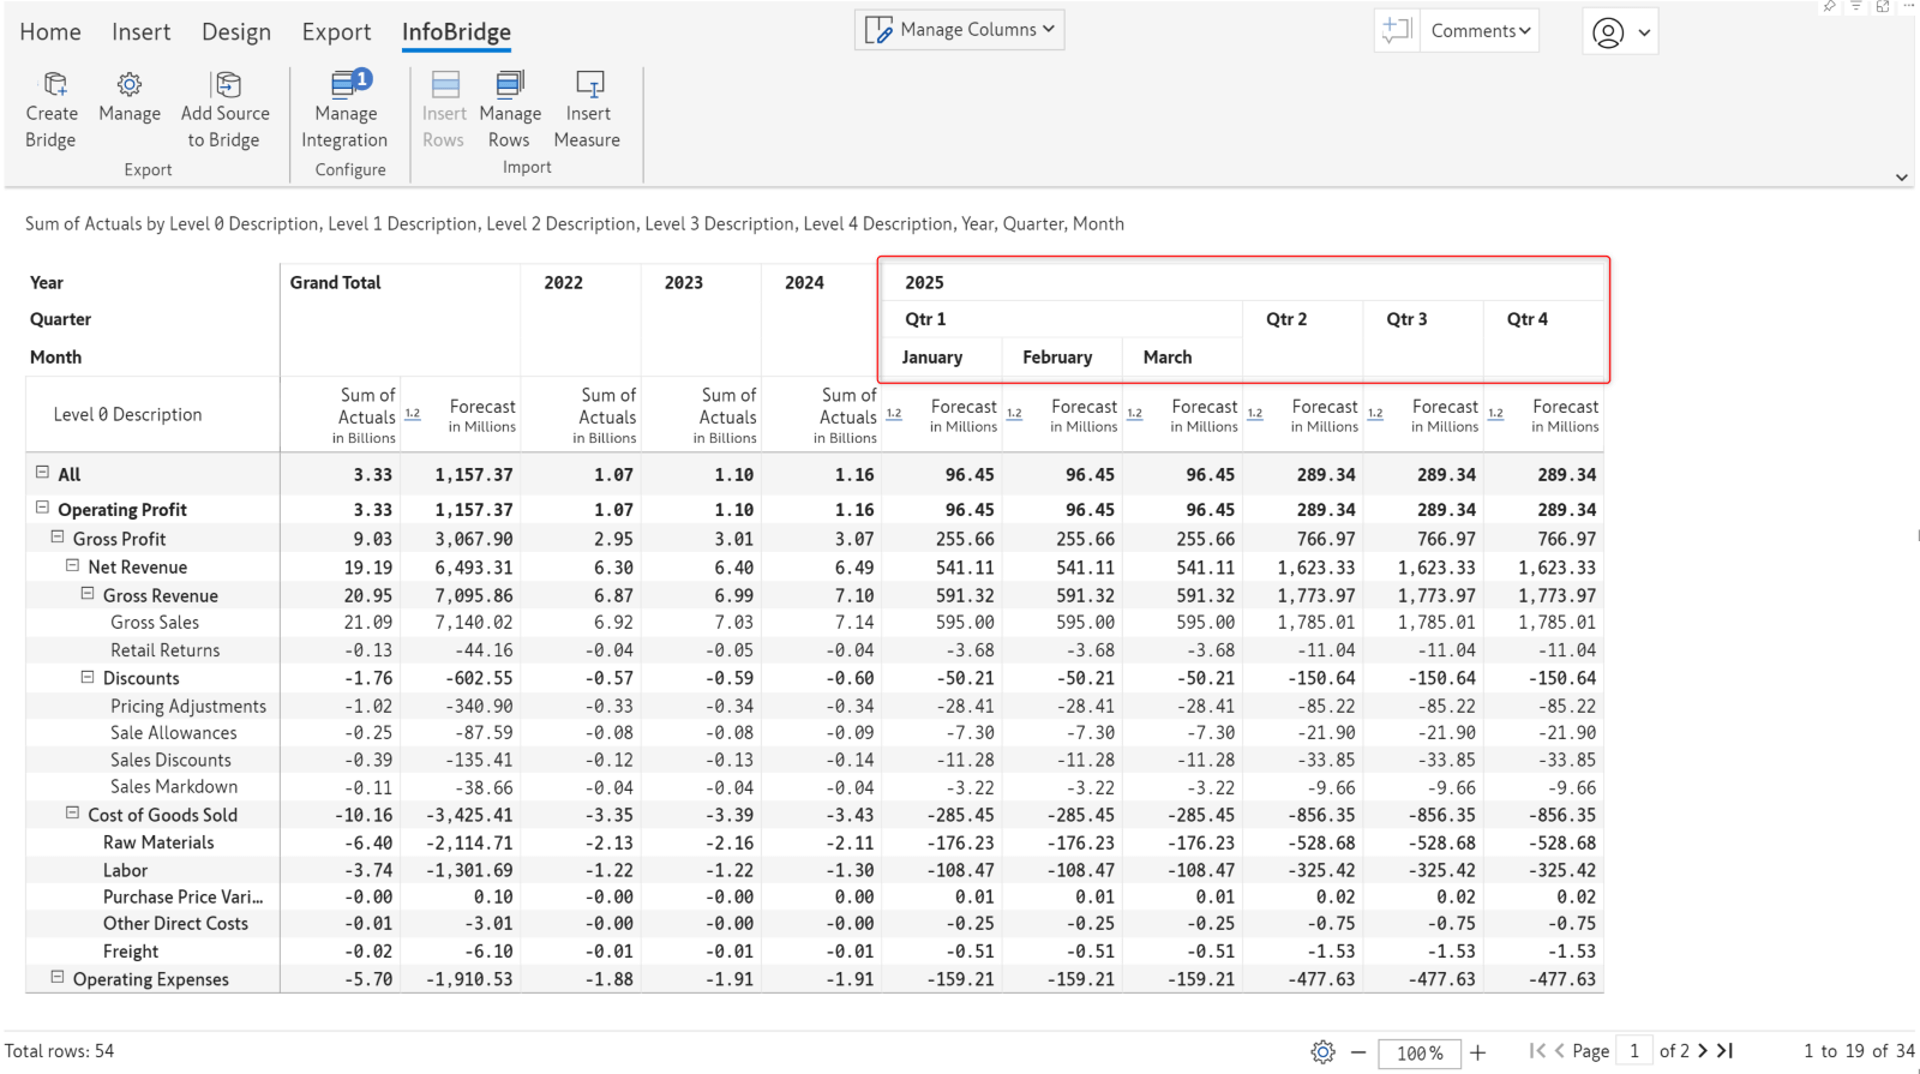
*The forecast columns inserted for previous years will be blank. We’ve hidden them using the column gripper options.
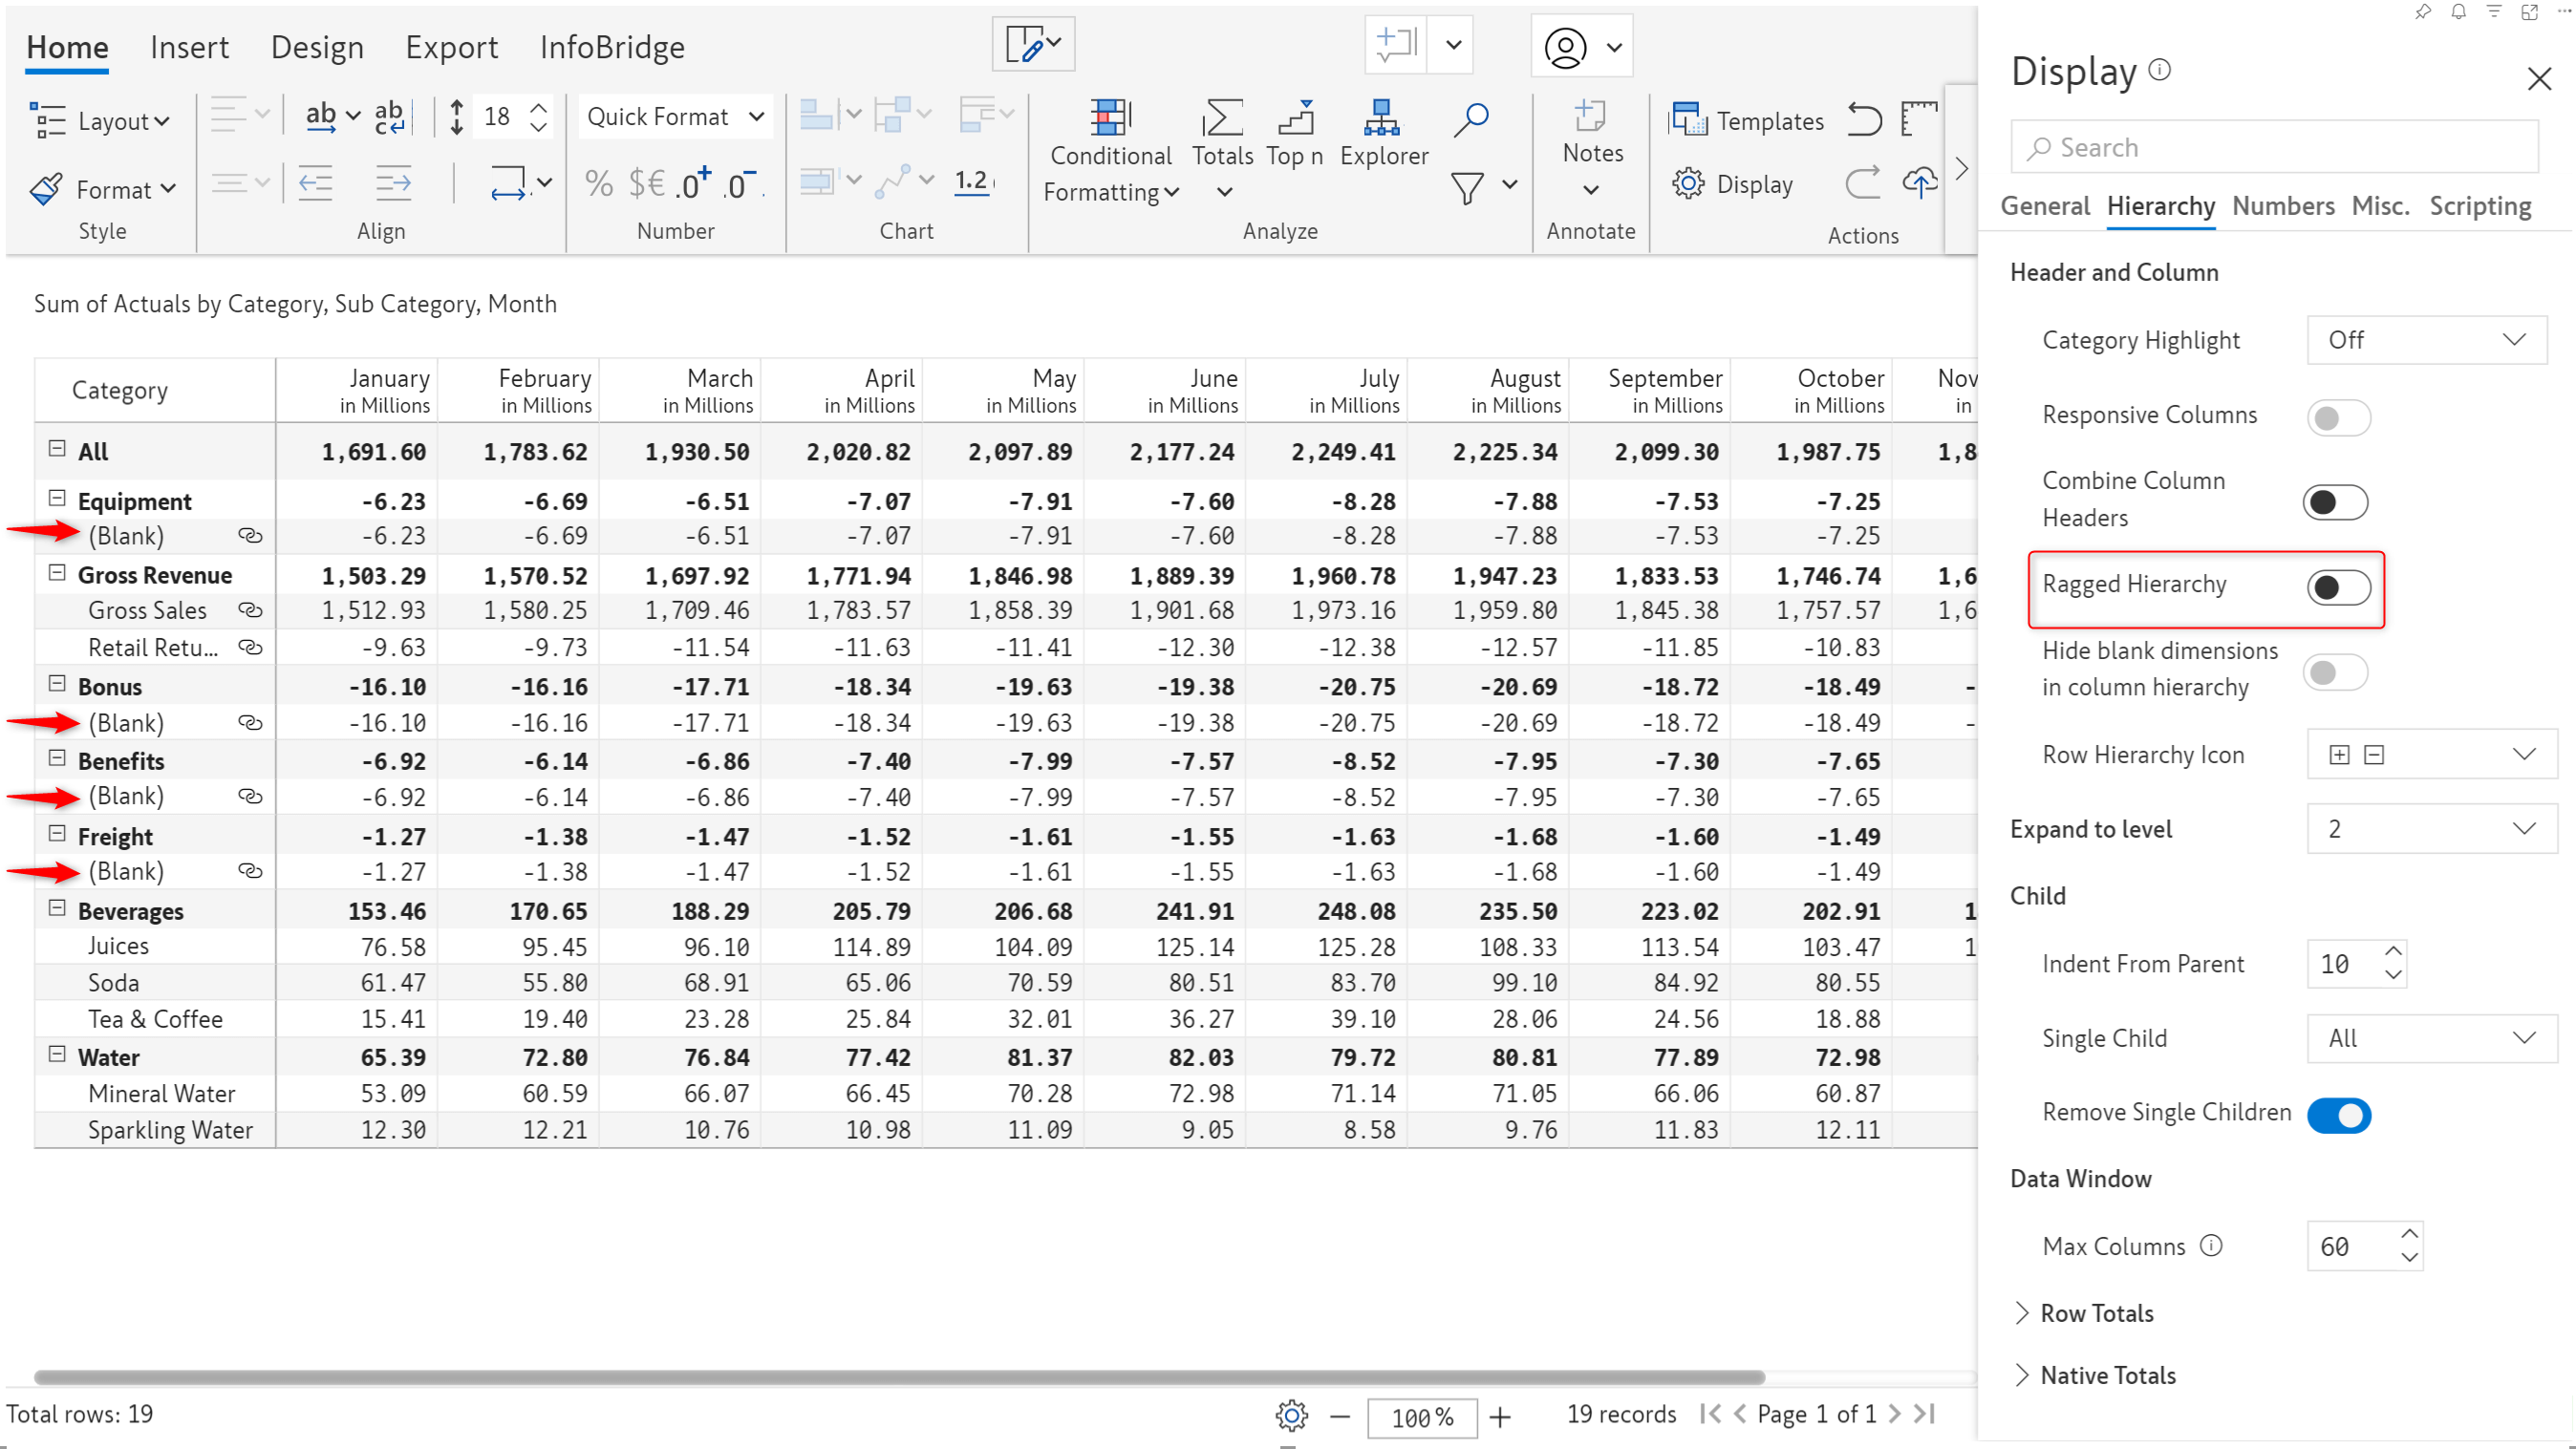
Infobridge enables you to smoothly integrate uneven hierarchical data that contains blank categories. The bridge created for the account-wise projections contains blank row categories highlighted in the image.
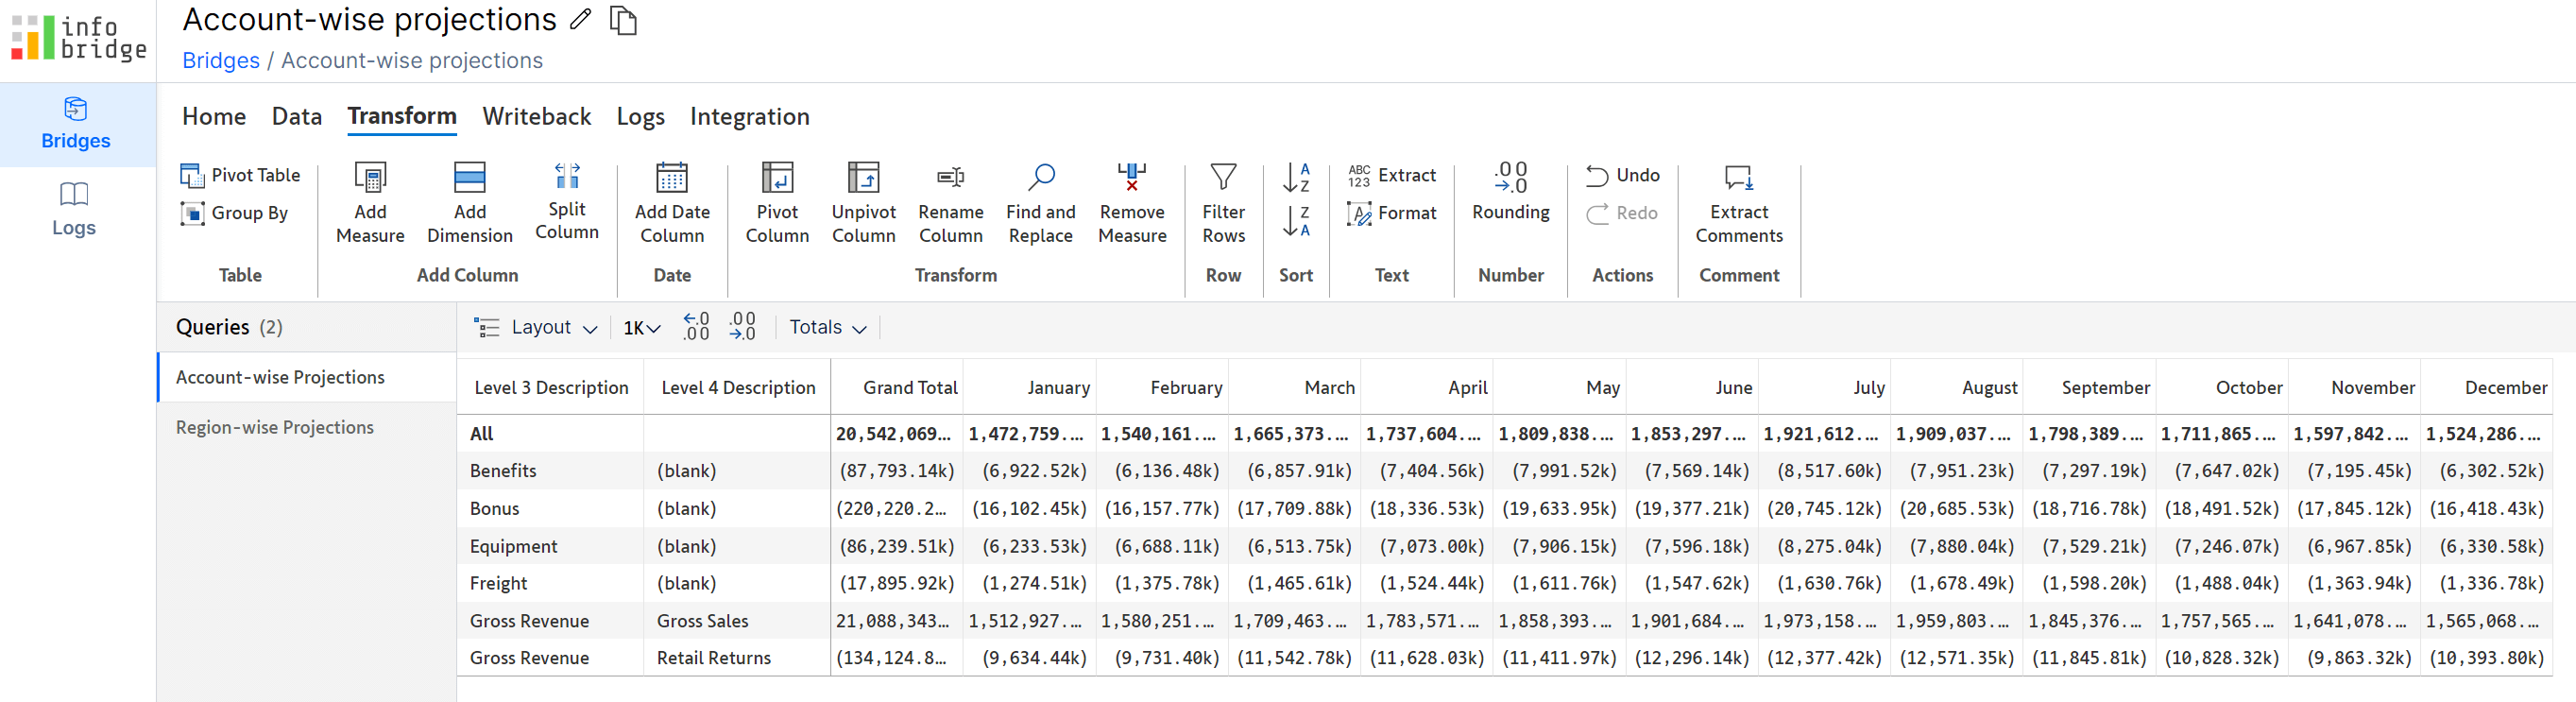
Notice how the blank categories (ragged hierarchy) are retained when we consolidate the category-wise projections with the account-wise projections from the bridge.
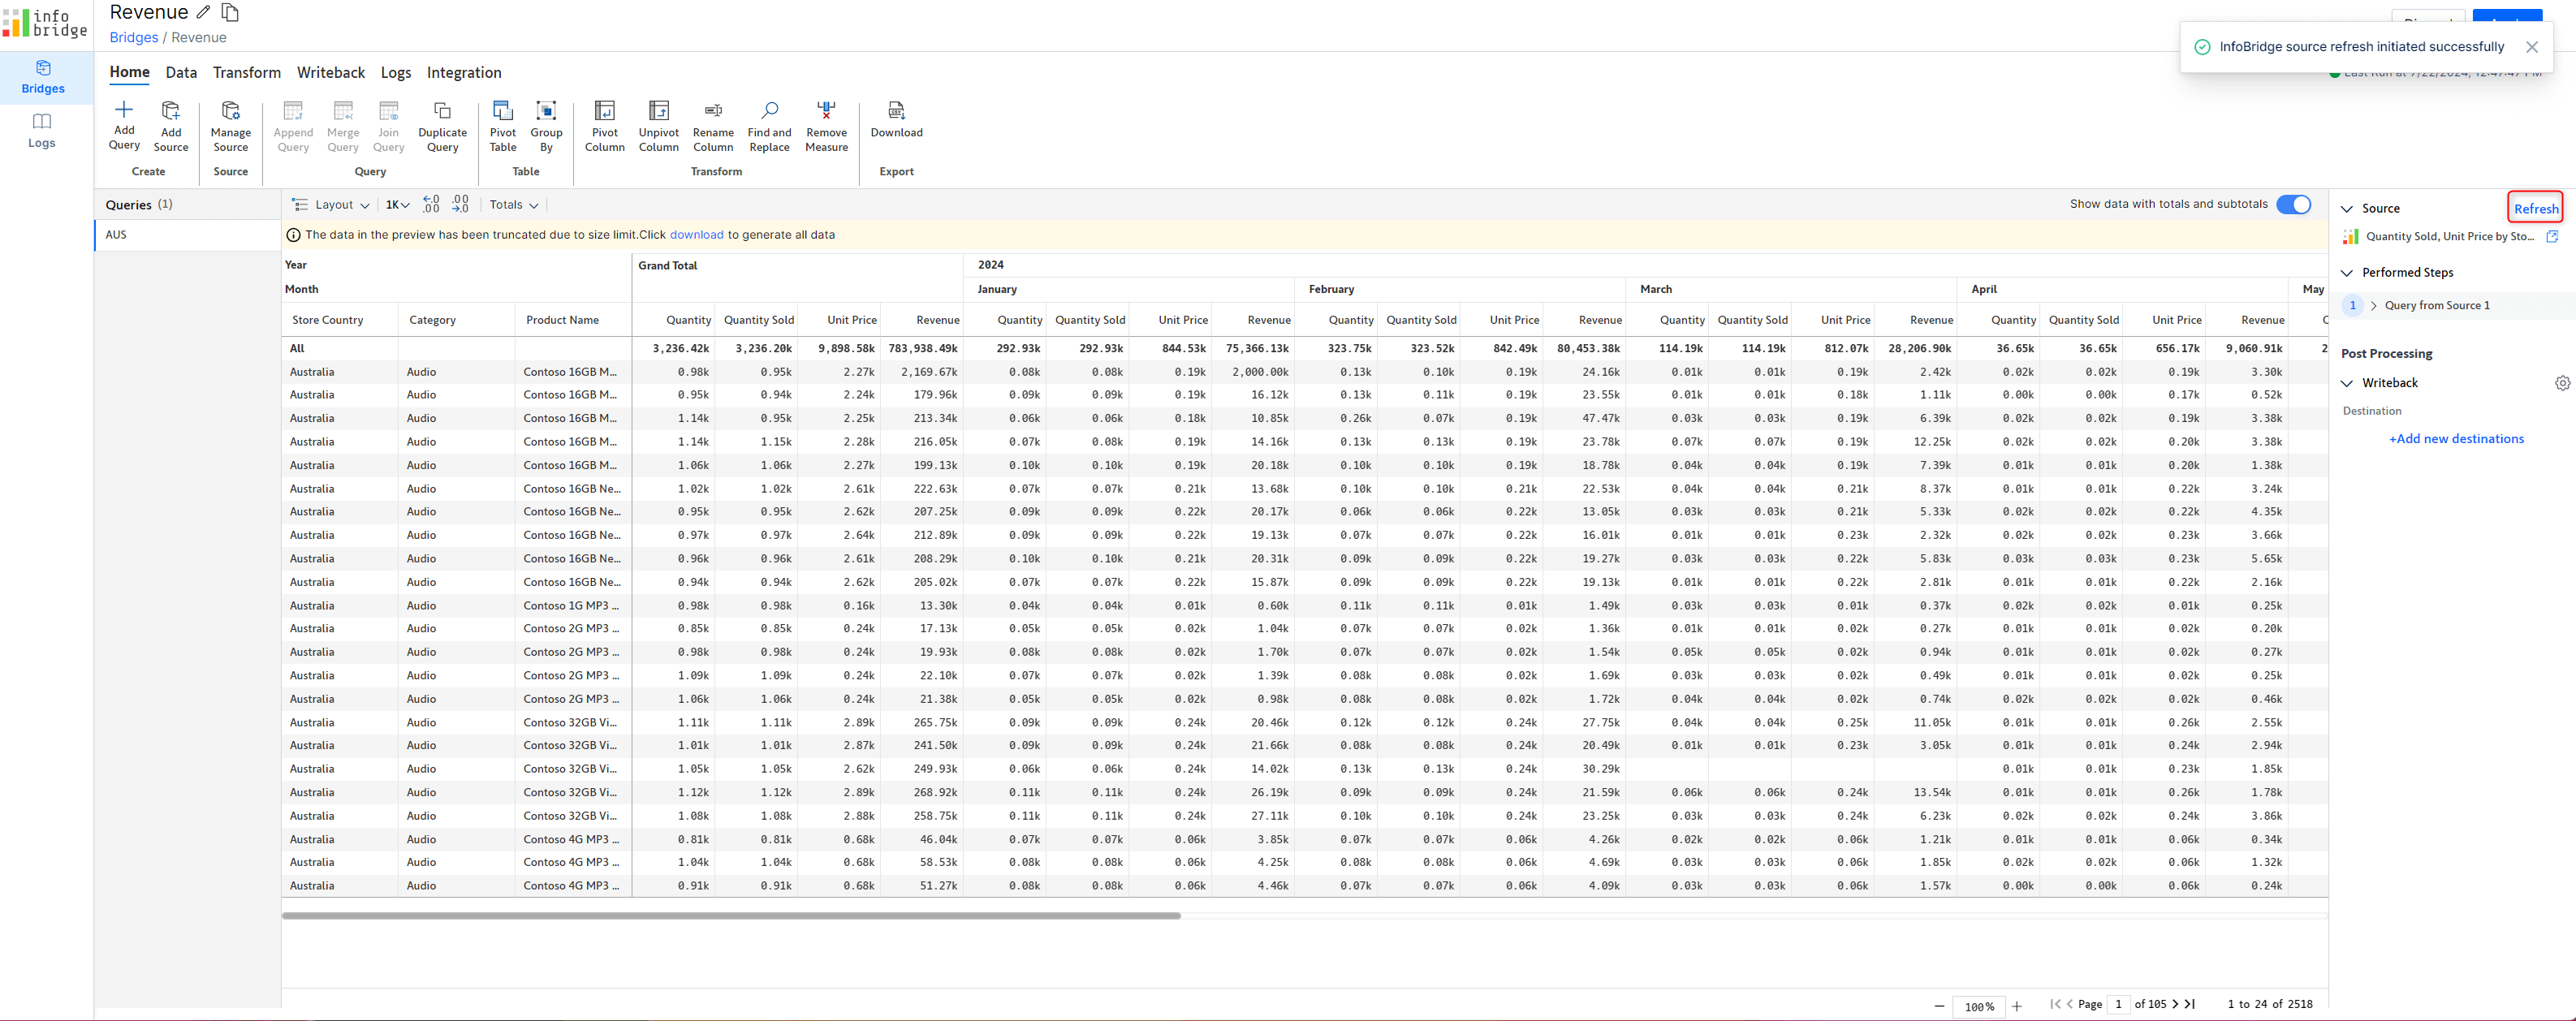
After you insert rows/columns from a bridge, any value updates made to numeric data input measures in the source visual will be reflected in real time in the target visual. As shown in the image, we’ve inserted rows from the Australia Revenue Statement bridge into the Global Revenue Statement target visual.
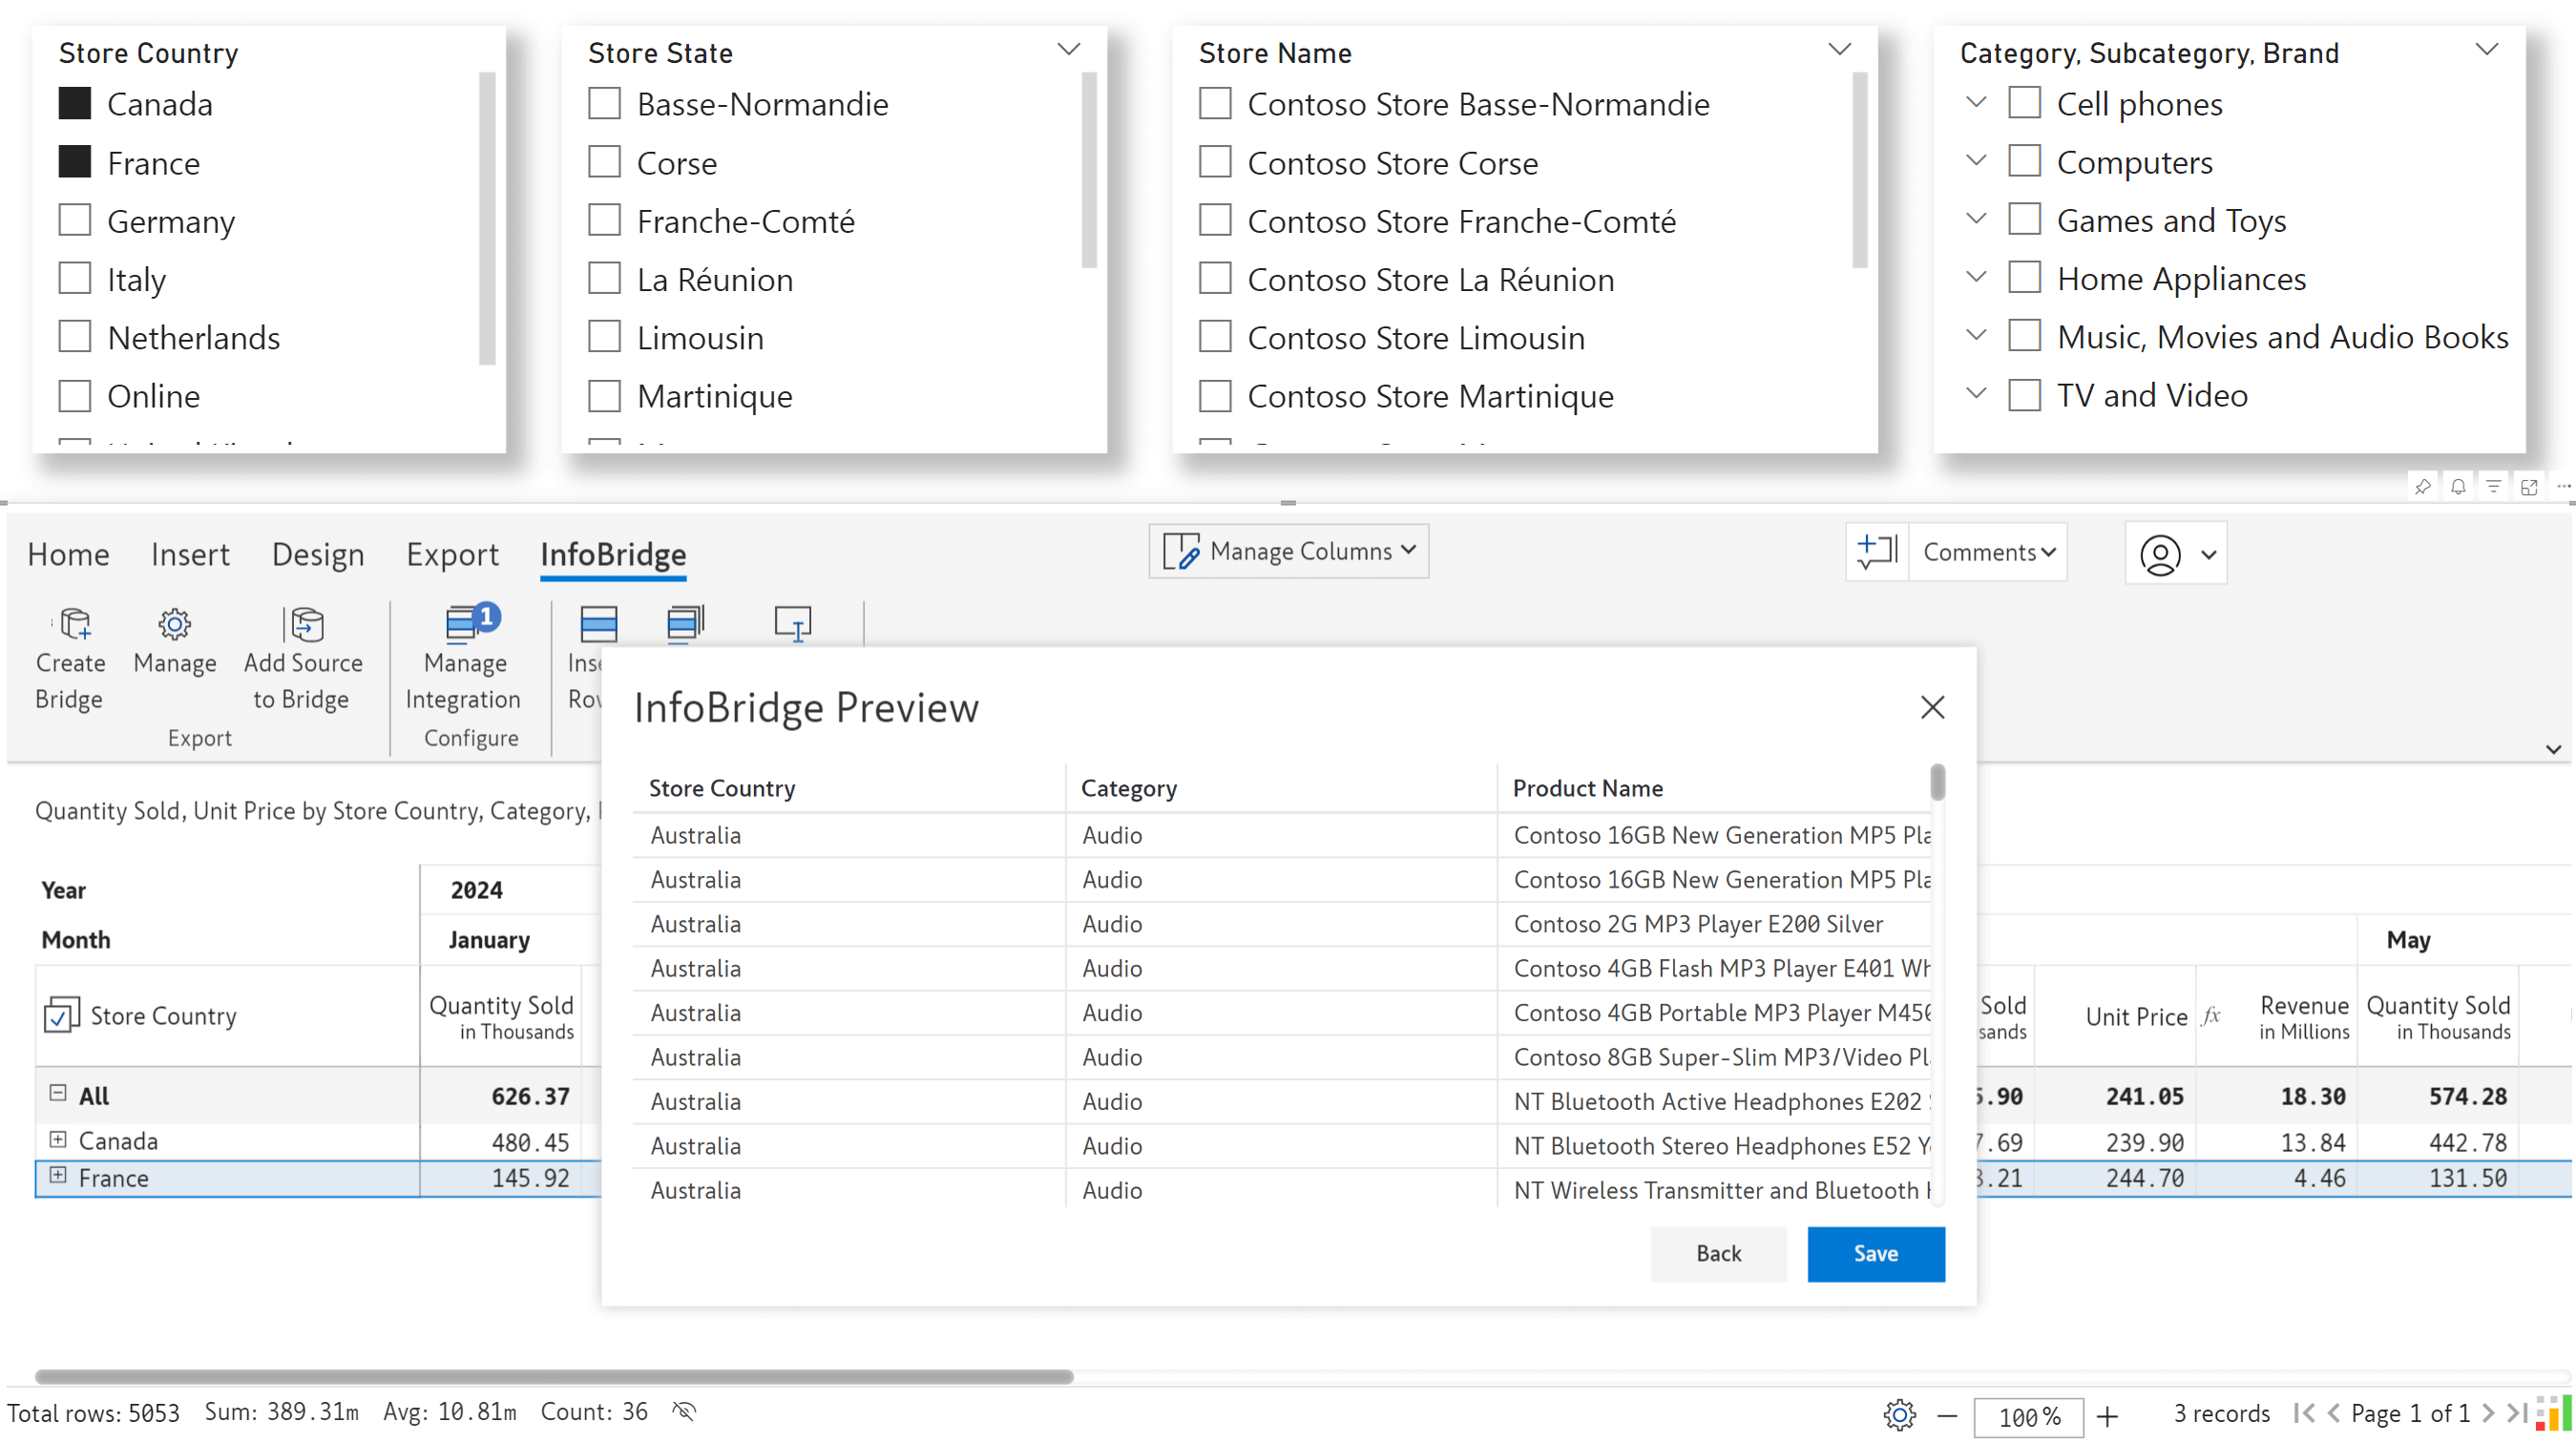
When you edit a data input value in the source visual, you can track the progress of the sync with event updates in the target visual. Watch out for notifications such as “Updating the source” and “Applying transformation rules” in the status bar at the bottom of the target visual.
Please keep in mind that Infobridge automatically syncs only updates to numeric data input measures. Updates to formulas and native measures will be reflected in the target visual only after manually refreshing the bridge.
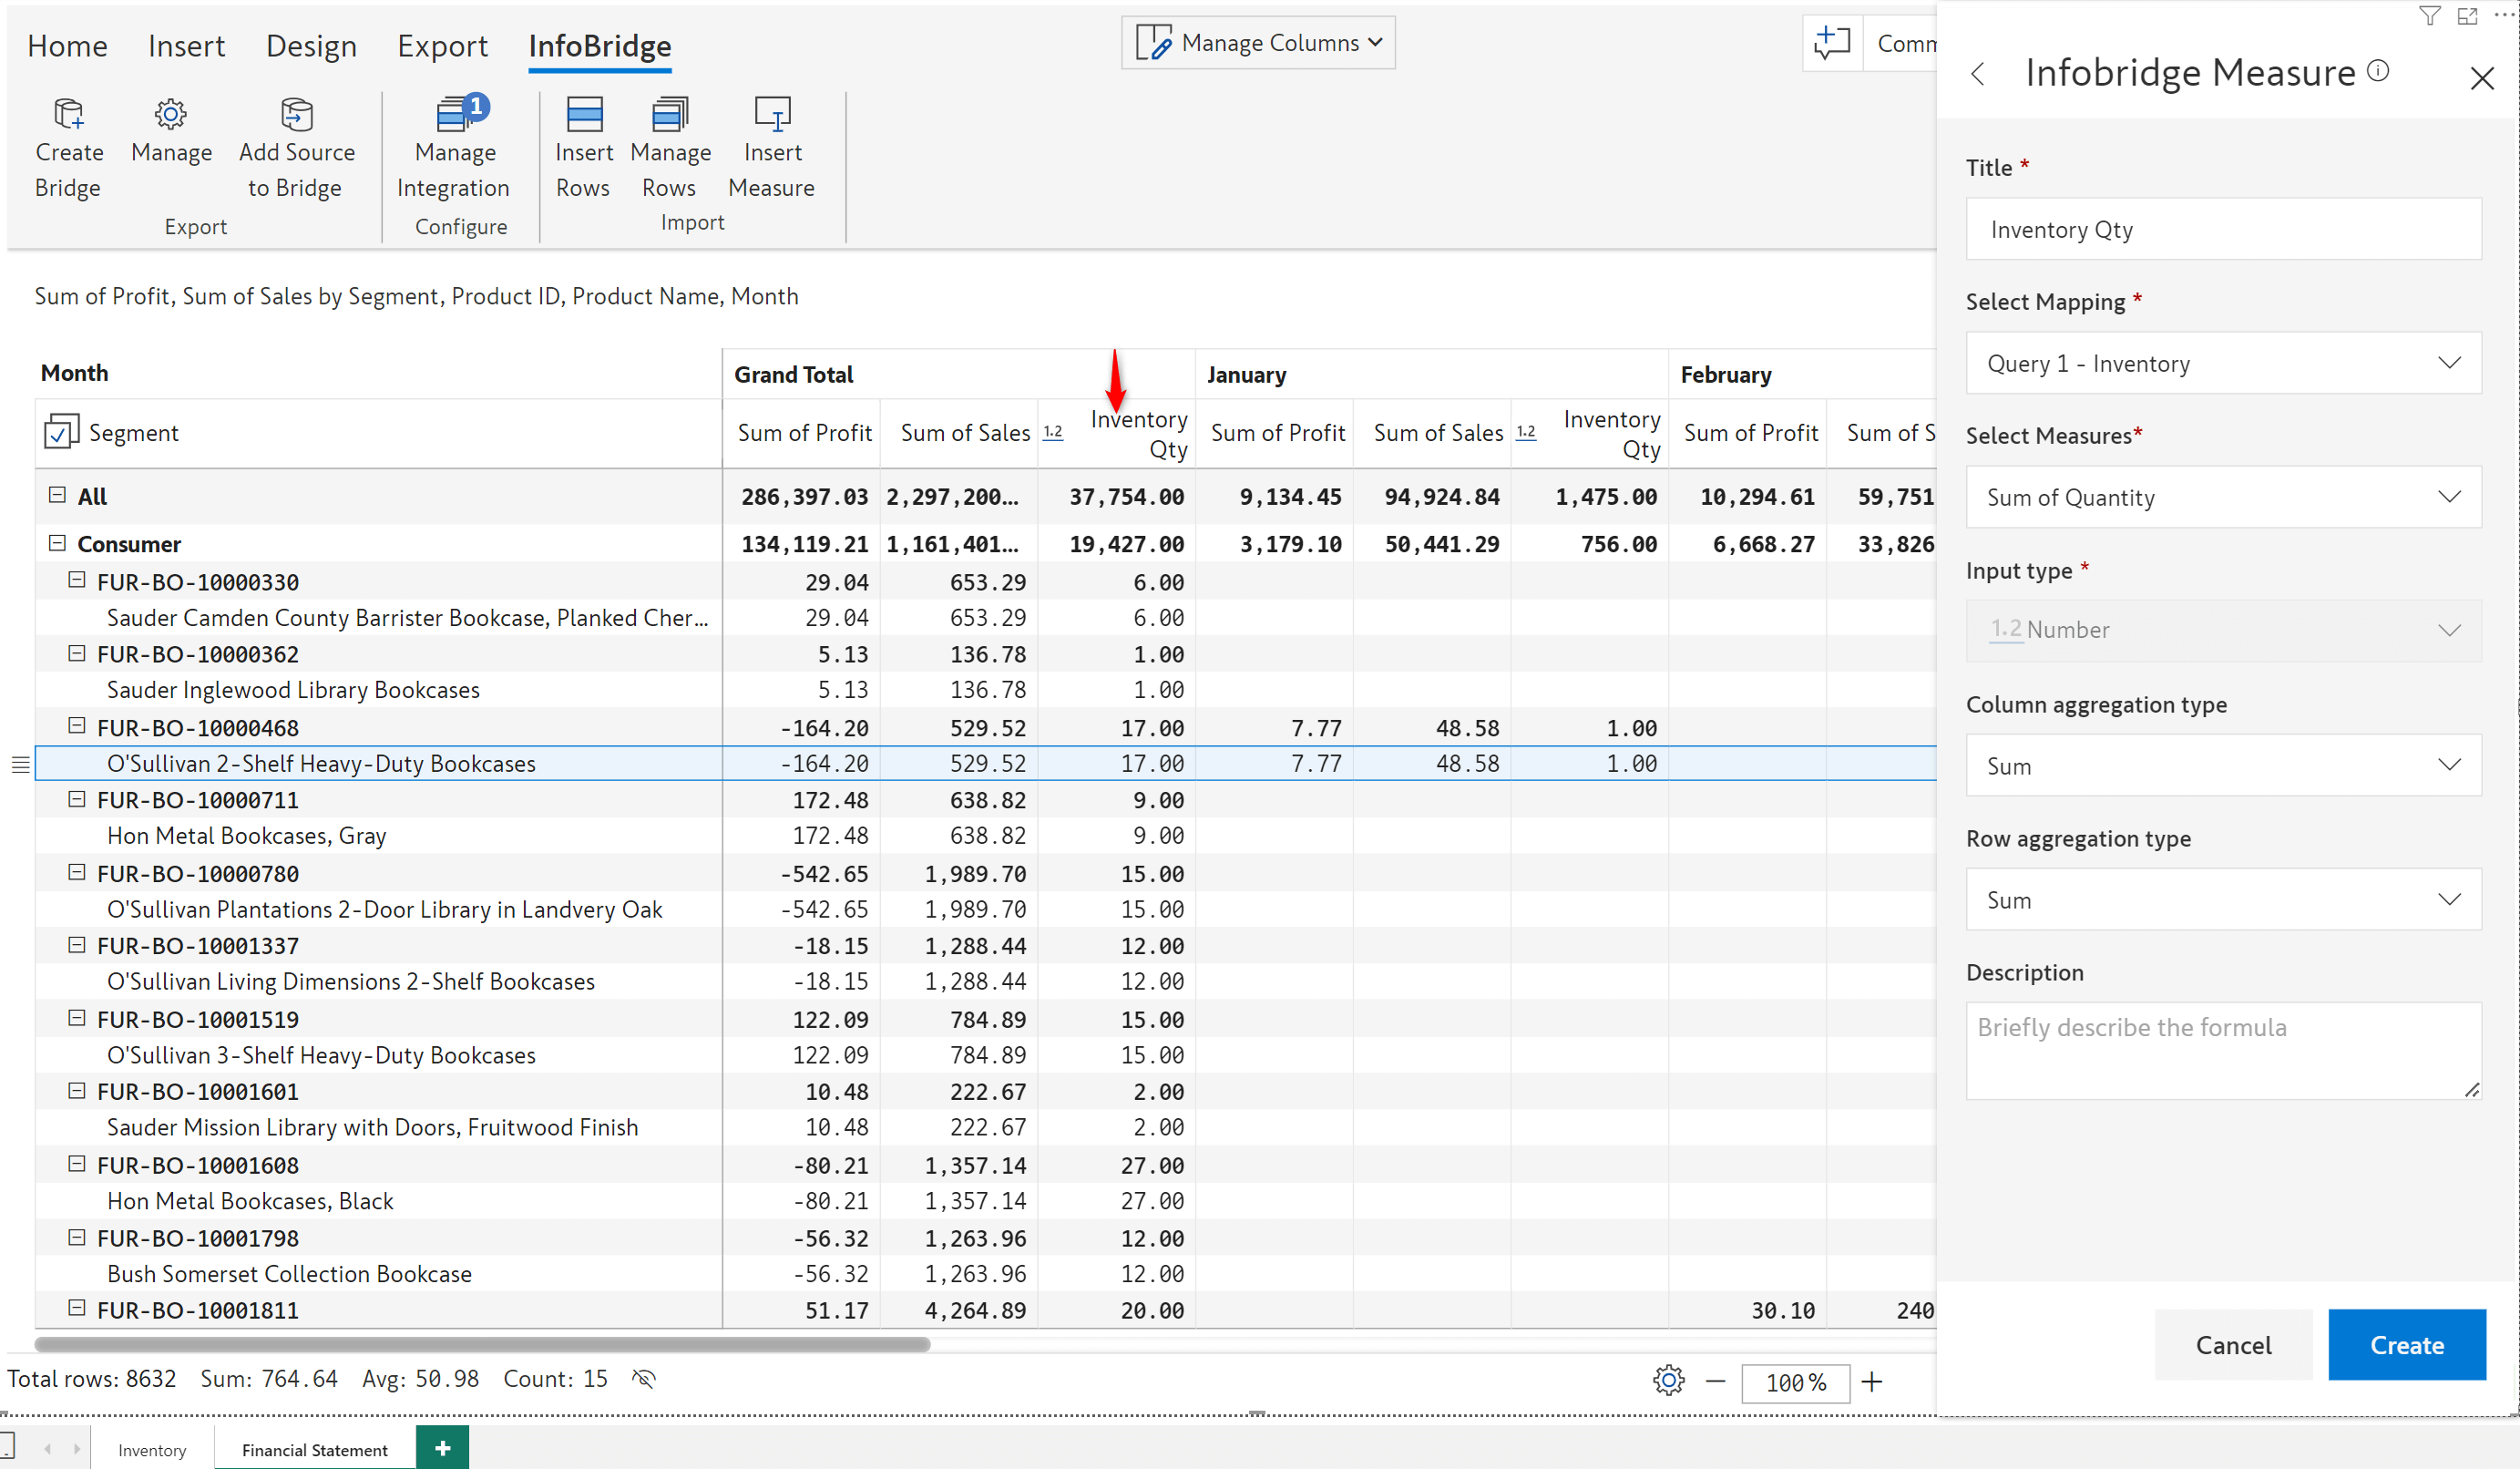
Inforiver allows you to assign dimensions to uniquely identify your rows with the Row Dimension ID Mapping feature. For instance, when you have a product ID and product name in your report, you can use just the product ID to locate a row.
When you work with multiple visuals connected via bridges, you can use the Row dimension ID mapping feature to ensure that even if a dimension category name is updated in the source visual – the consuming visual will not be impacted.
In the consuming visual, we’ve sourced the Inventory Qty from the Inventory visual.
We have created a row dimension ID mapping in the target visual that uses the product ID to identify a row. Although the product name has been updated from O’Sullivan 2-Shelf Heavy-Duty Bookcases to Bertie Wooster Bookcases, notice how the inventory quantity is not impacted.
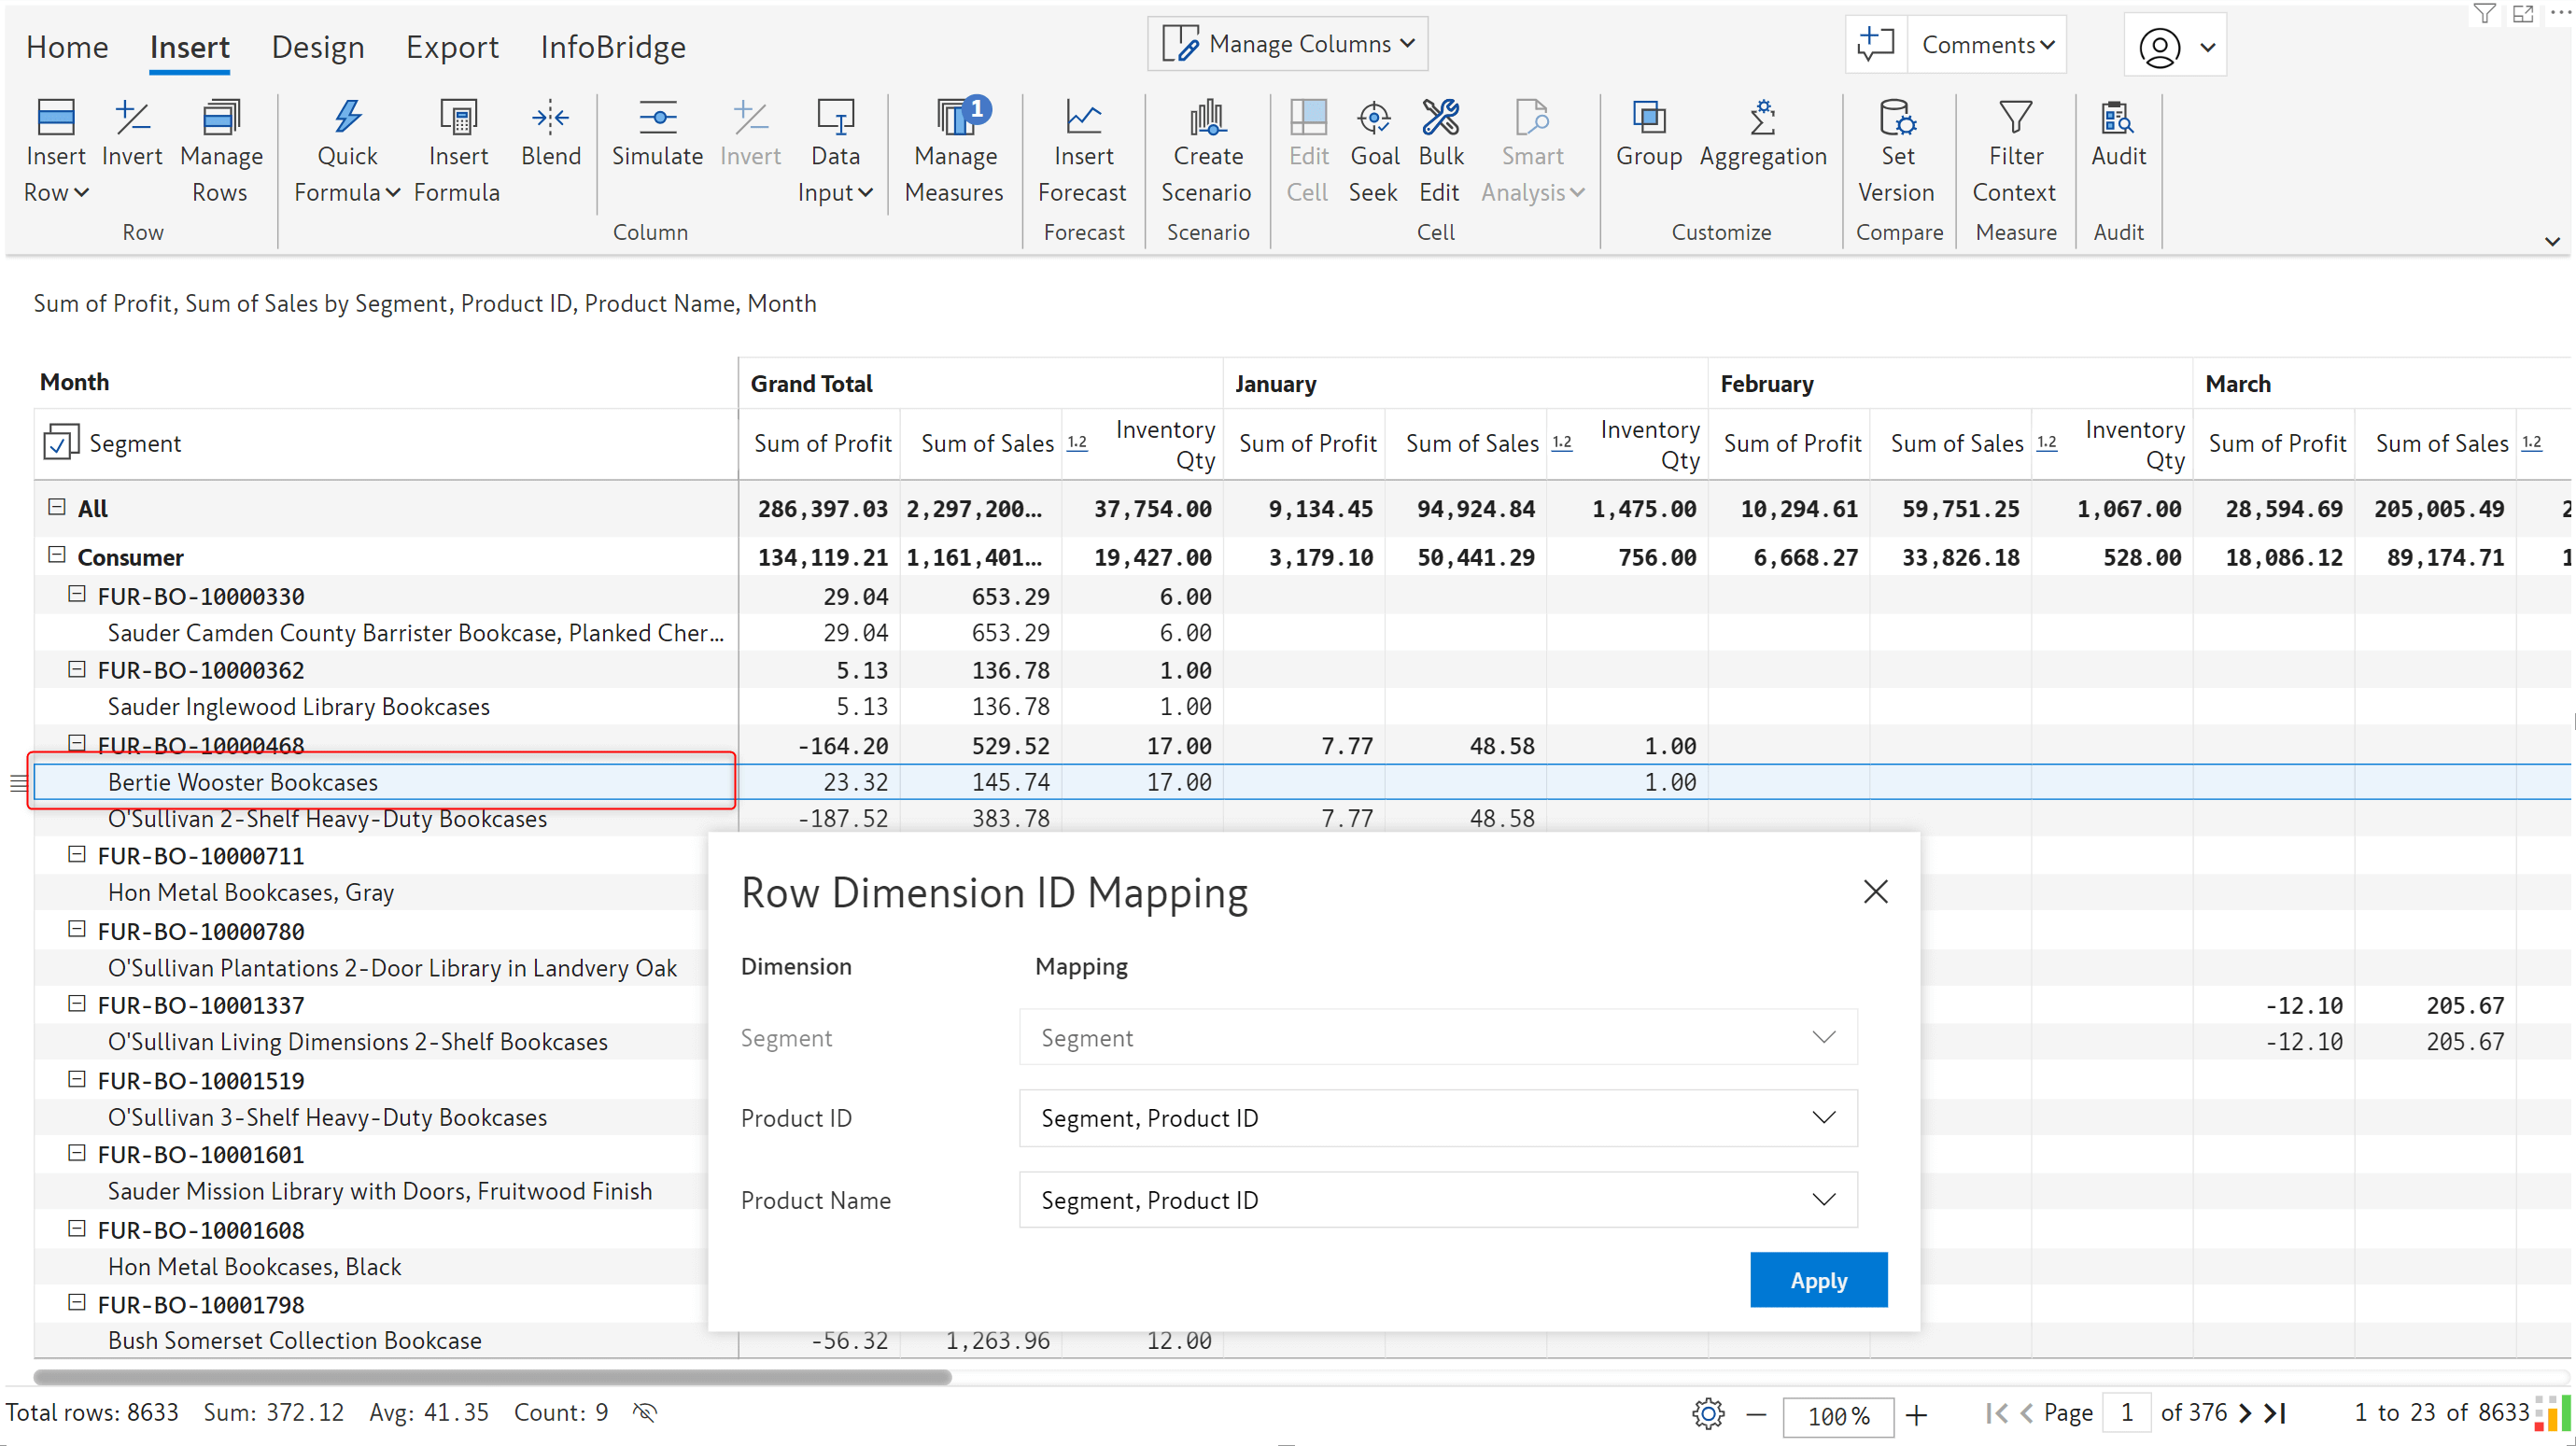
Infobridge can implicitly handle differences in the Row ID mapping between the source and target visuals. For instance, if the source does not have a row ID mapping and the target visual does, you will still be able to import data from the bridge seamlessly.
Inforiver is all about collaborative reporting. In the July release, we introduced an adjustment workflow to request updates to the data in the source visual.
To maintain data integrity, you will not be allowed to edit measures that you have imported from a bridge. However, in business reporting, you may encounter situations where data errors occur, or you need to adjust/correct the source data.
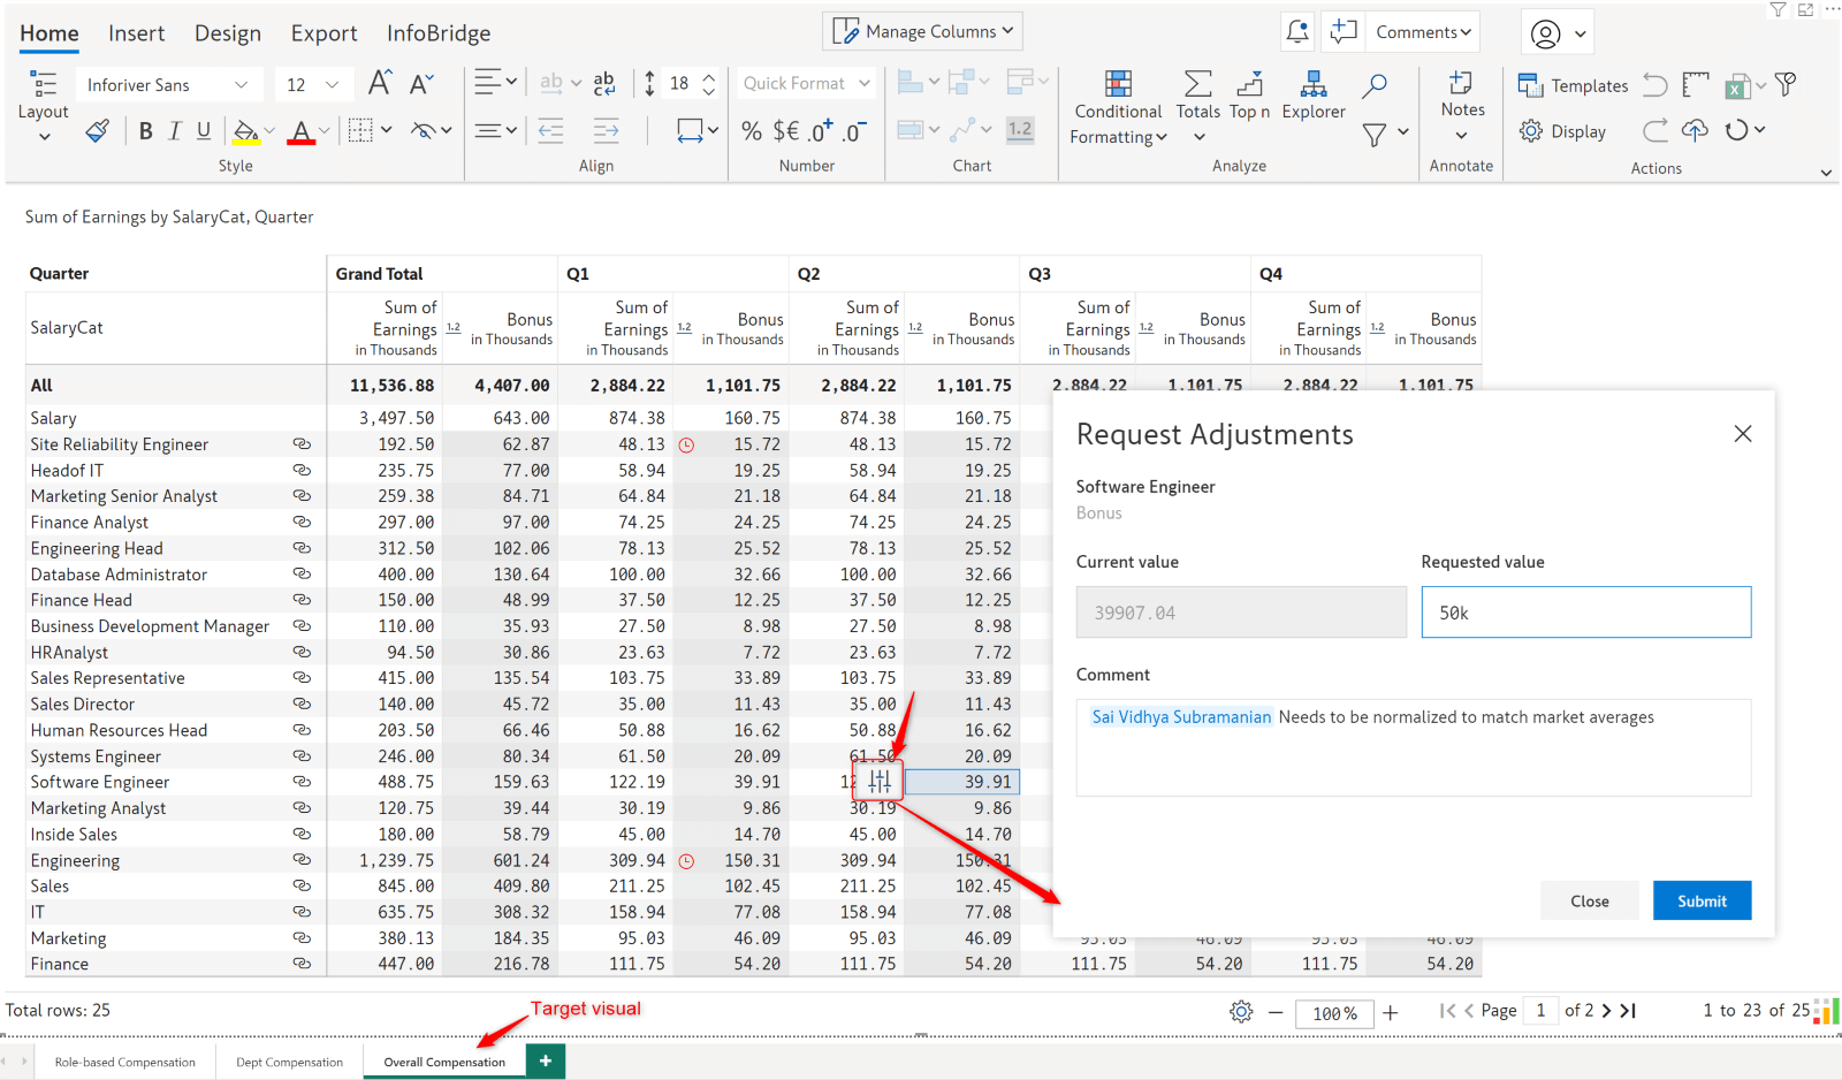
Let’s consider the case of a compensation report. The Overall Compensation page contains data from the Role-based compensation and Dept Compensation visuals. At an organizational level, if we need to update the bonus component (data input measure) for a particular department or role, we can leverage the new Infobridge adjustments workflow.
When you click on a cell that requires an update, an adjustment icon appears. Click the icon to open the Request Adjustments interface, where you can specify the new value. You can optionally add a comment and tag associates.
A red clock icon is displayed against each cell for which a value adjustment has been requested from the target visual.
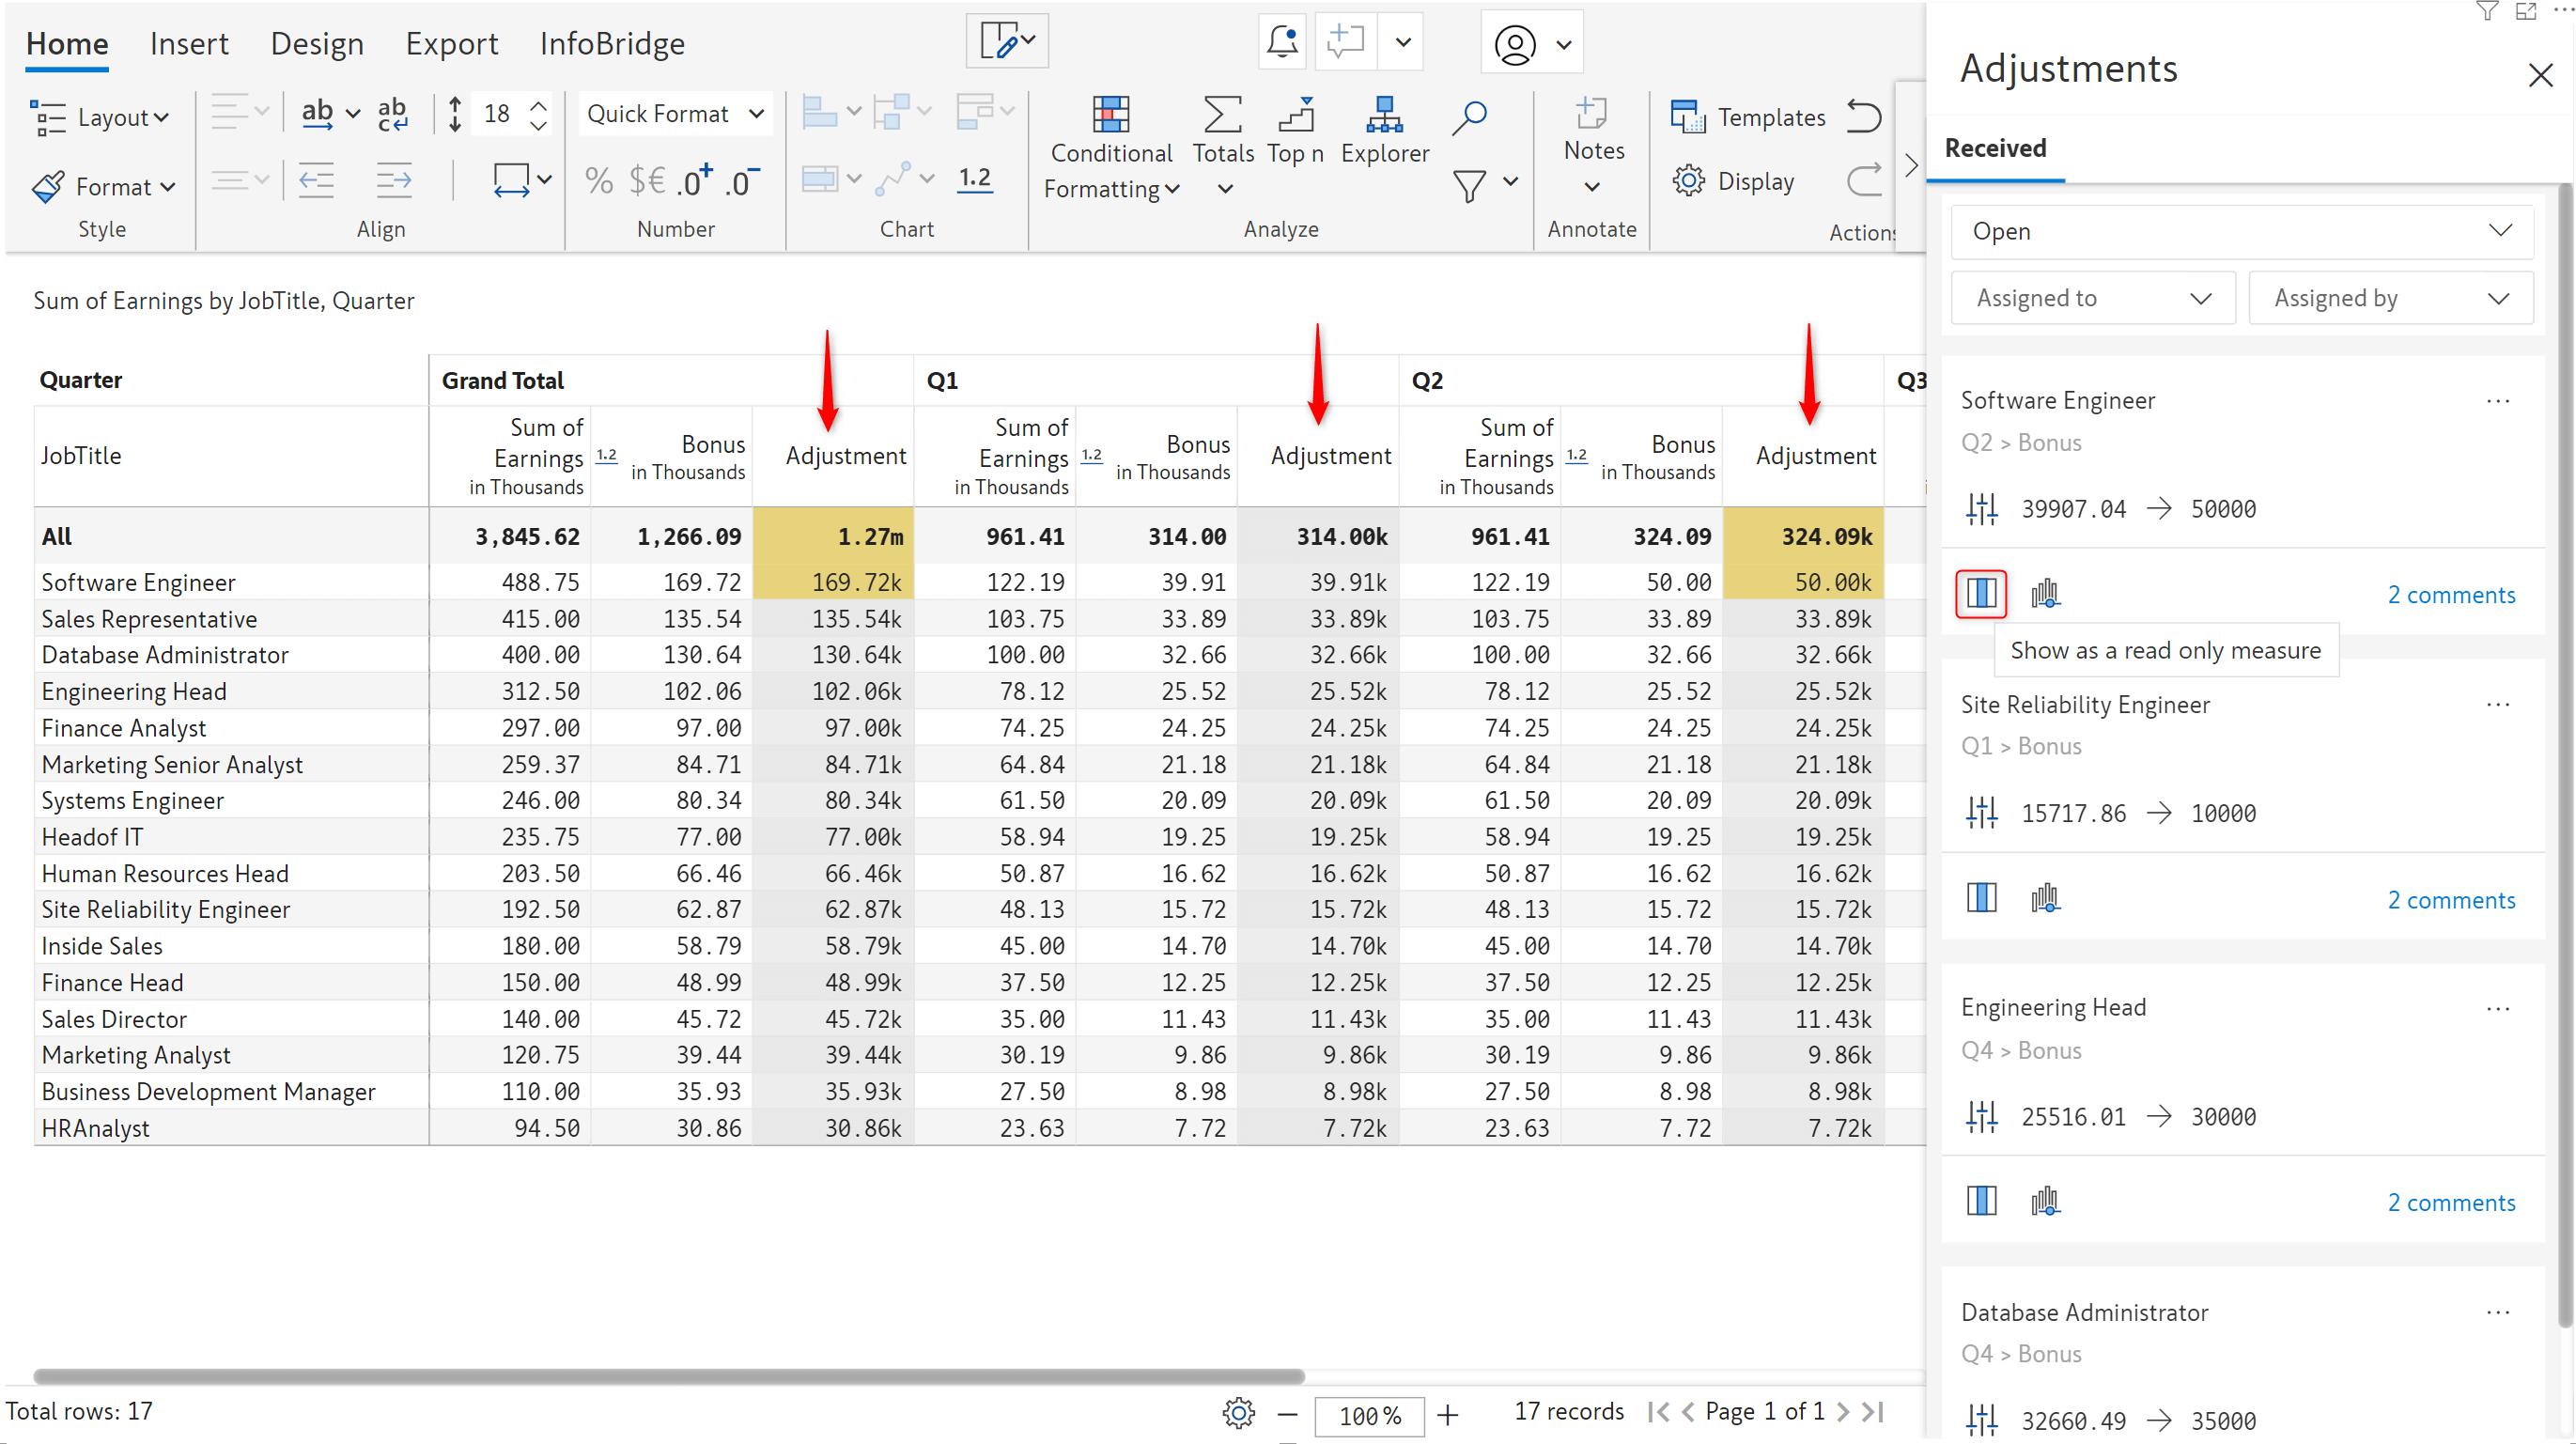
In the source visual, you’ll notice a bell icon that notifies the owner(s) that an adjustment has been requested. Click on the bell icon to view the adjustment requests and associated comments.
Before committing to an adjustment, Inforiver allows you to display the adjustment as an additional measure in your source report, enabling you to compare and gauge the impact of the adjustment. Click the Show as read only measure icon to view the adjustment measure. Any updates that you make will be highlighted in yellow.
Note: To remove the adjustment measure, use the column gripper and select the Remove Adjustment Measure option.
With Inforiver, you can even run simulations before making a decision about applying an adjustment. To assess the impact of an adjustment in the bigger picture, click the Show as read only measure in a scenario option. Inforiver will automatically create a scenario that contains the recommended adjustment. You can run simulations on your data and use the Copy to Base option to commit your updates.
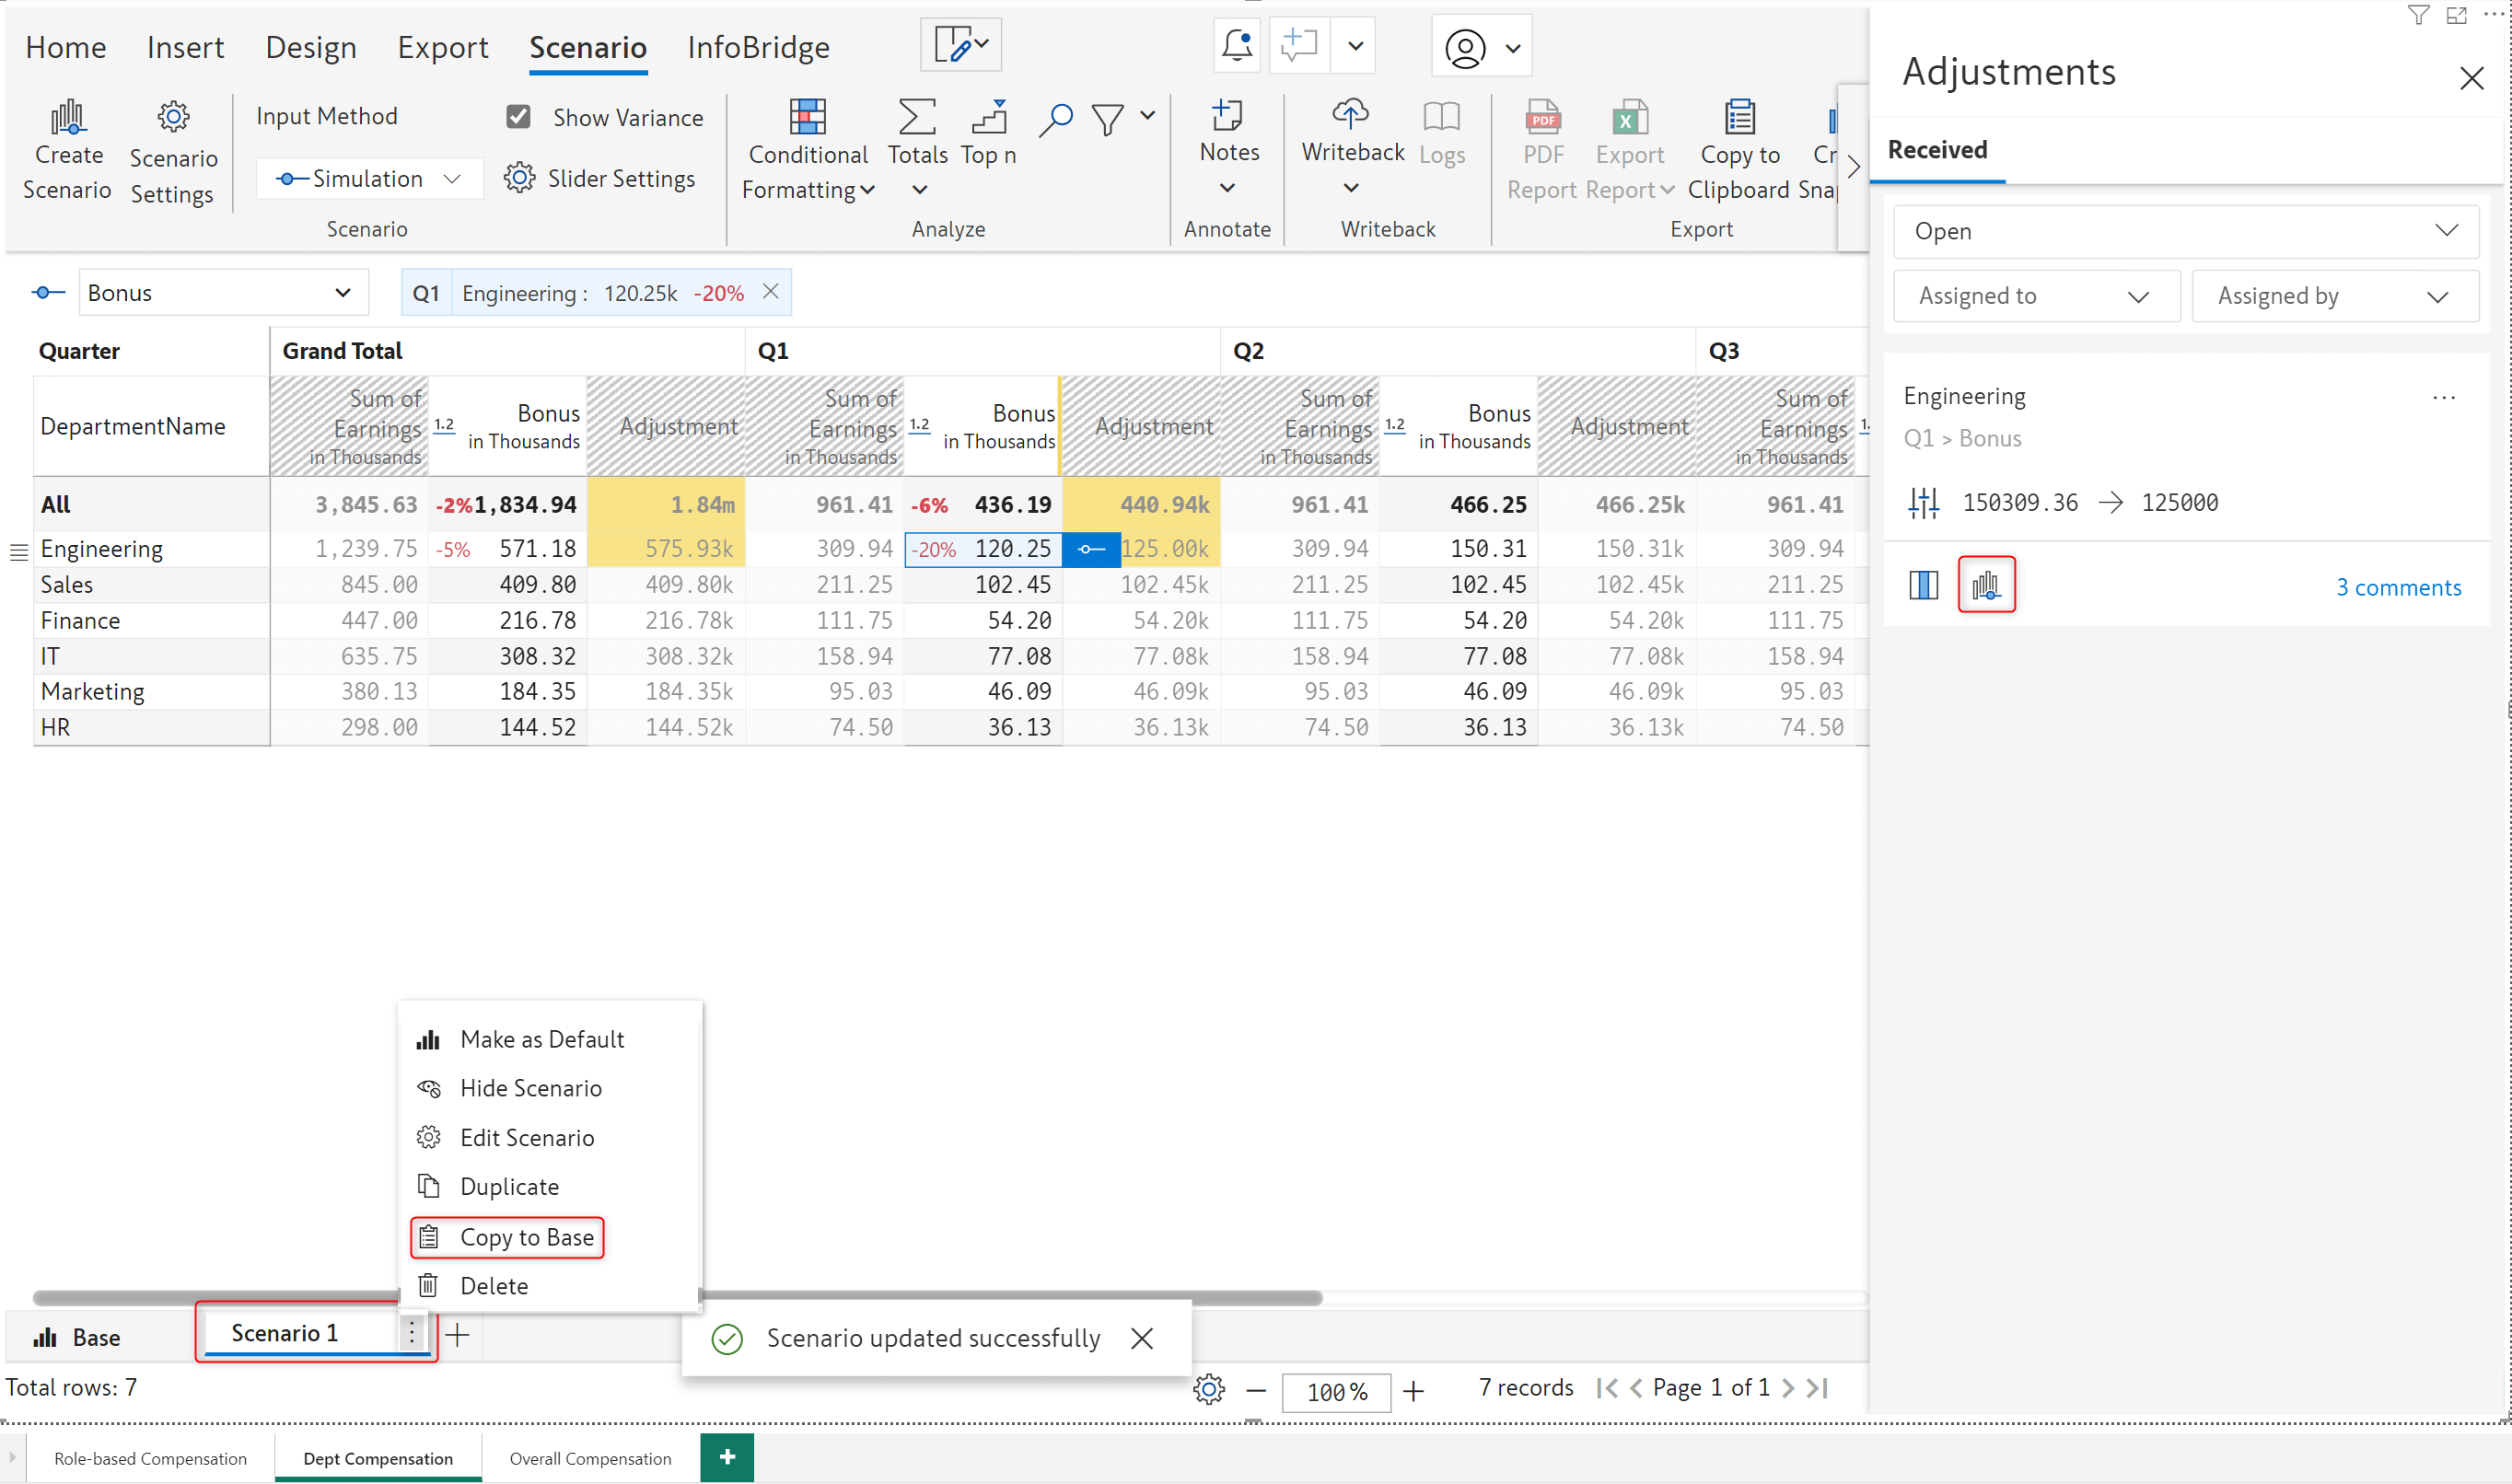
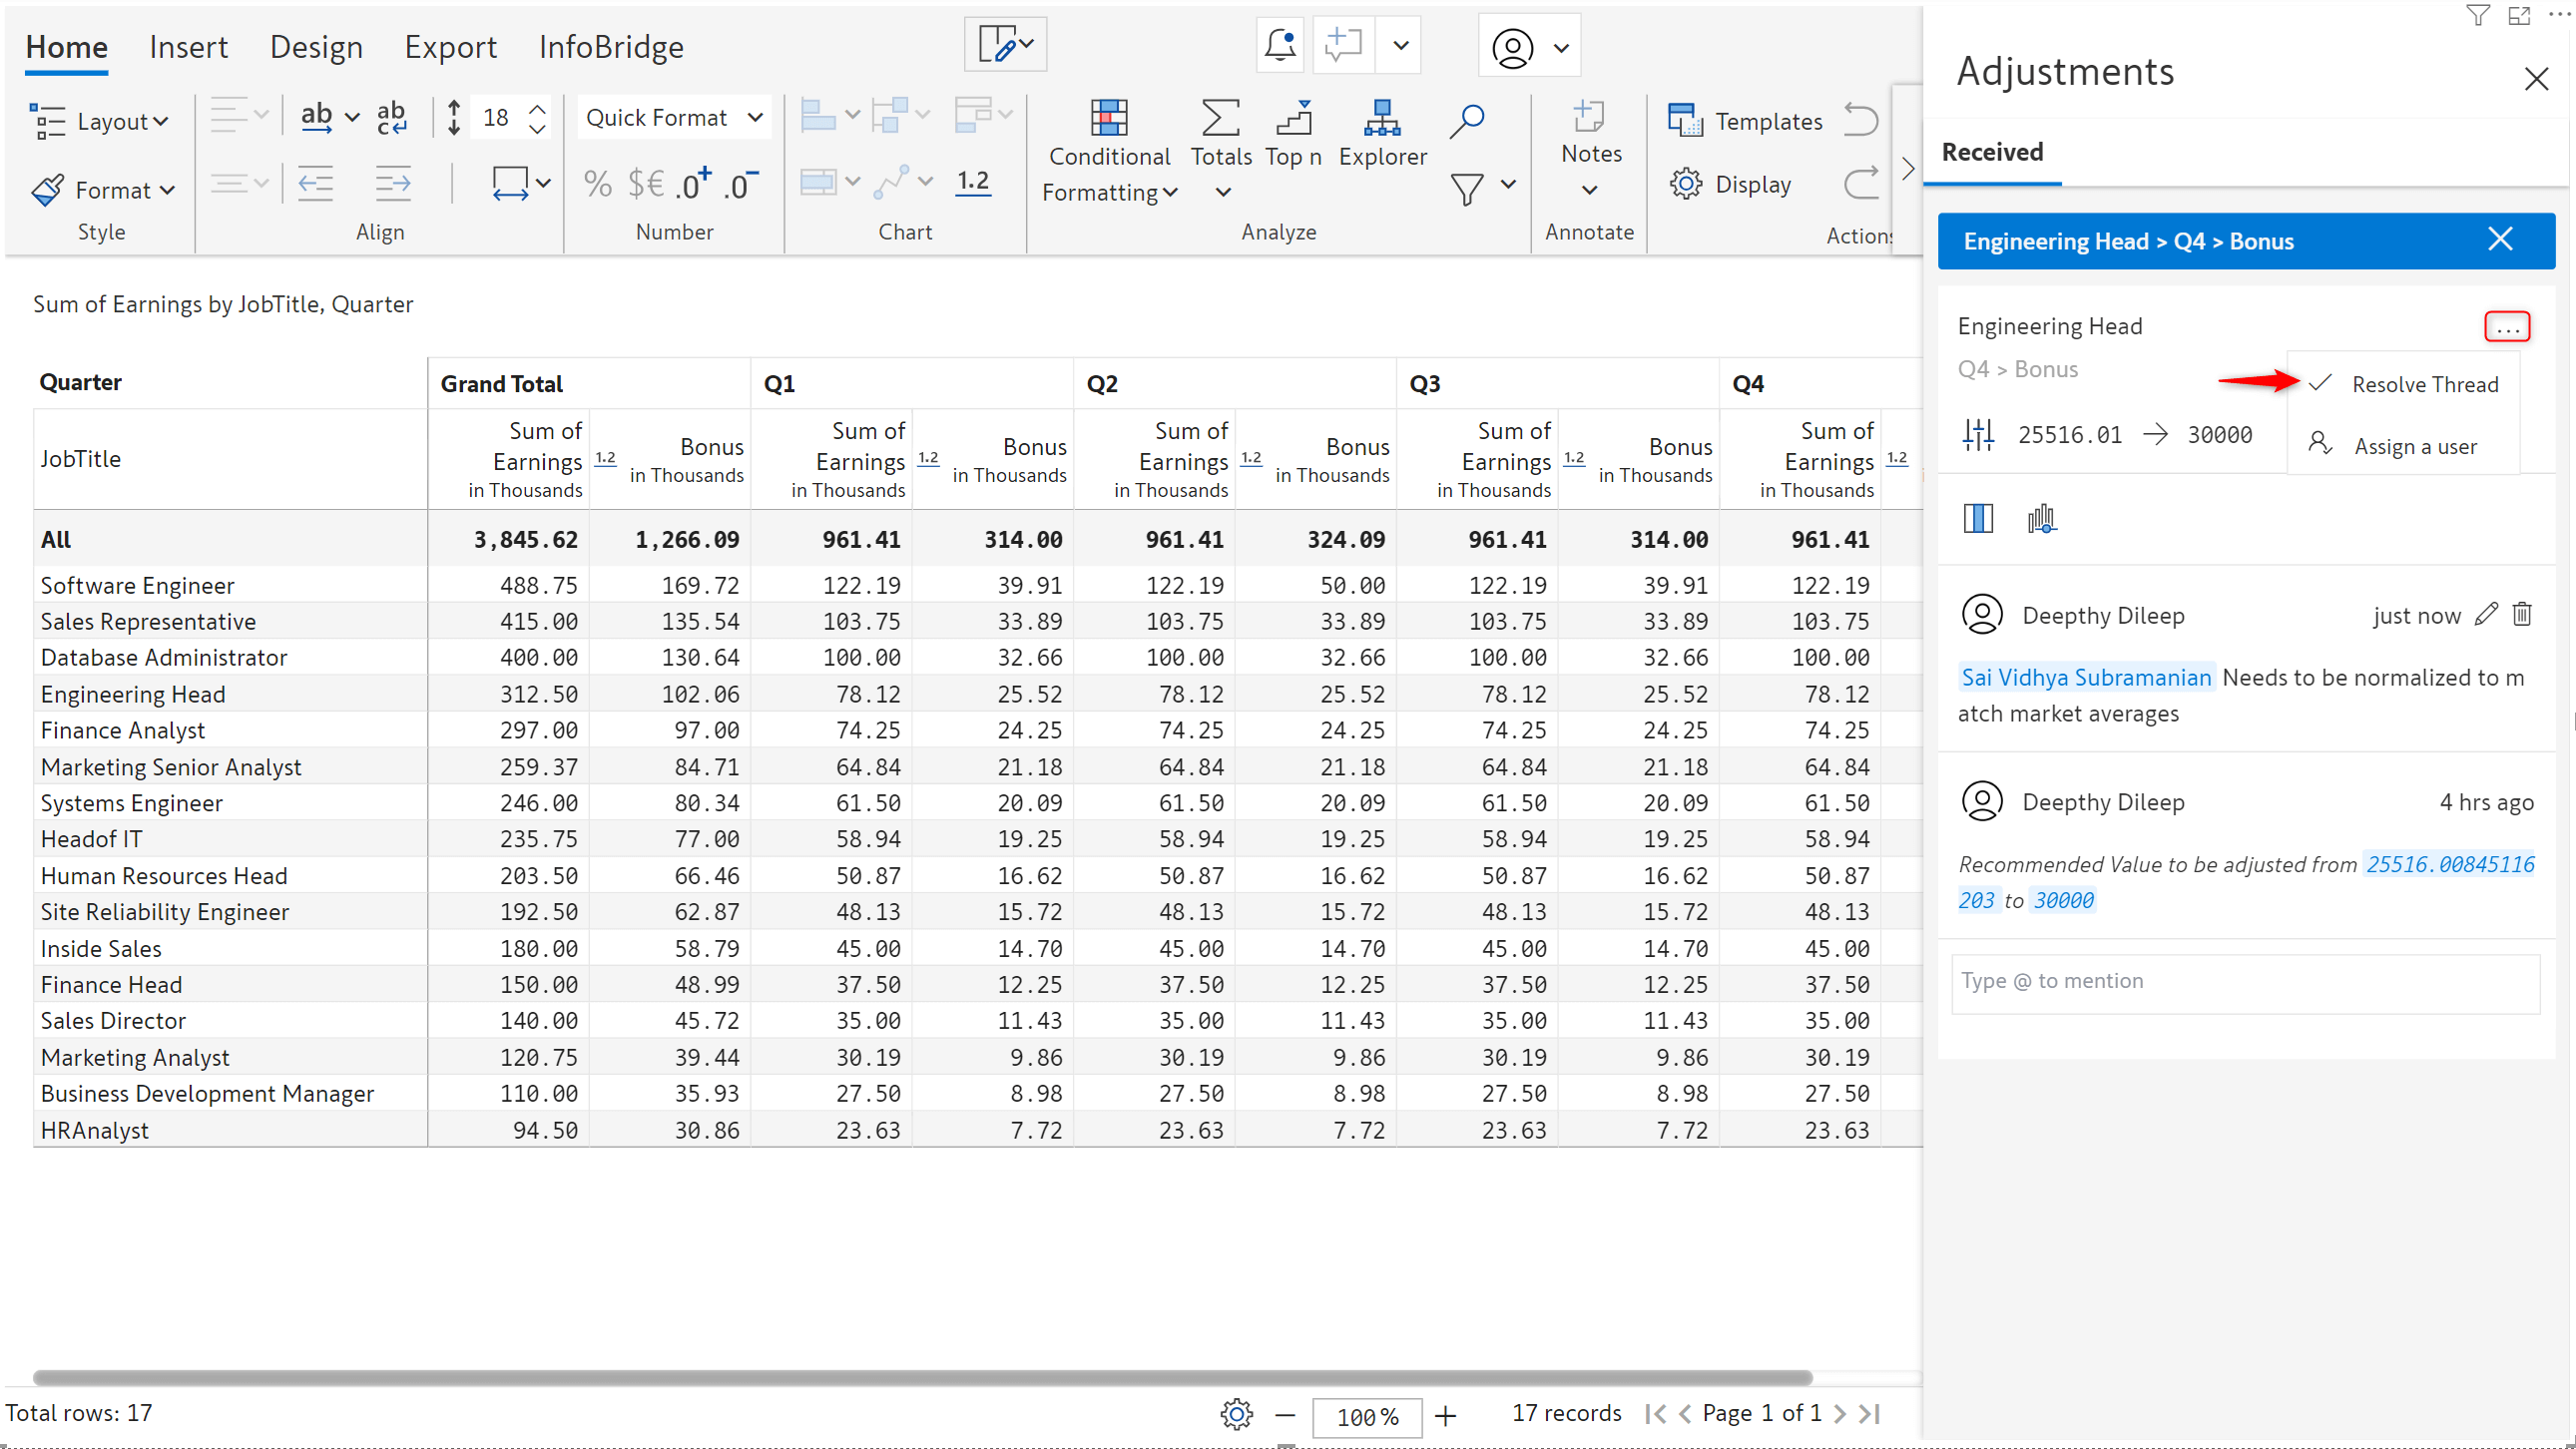
After accepting or rejecting an adjustment request, you can close the request by selecting the Resolve Thread option.
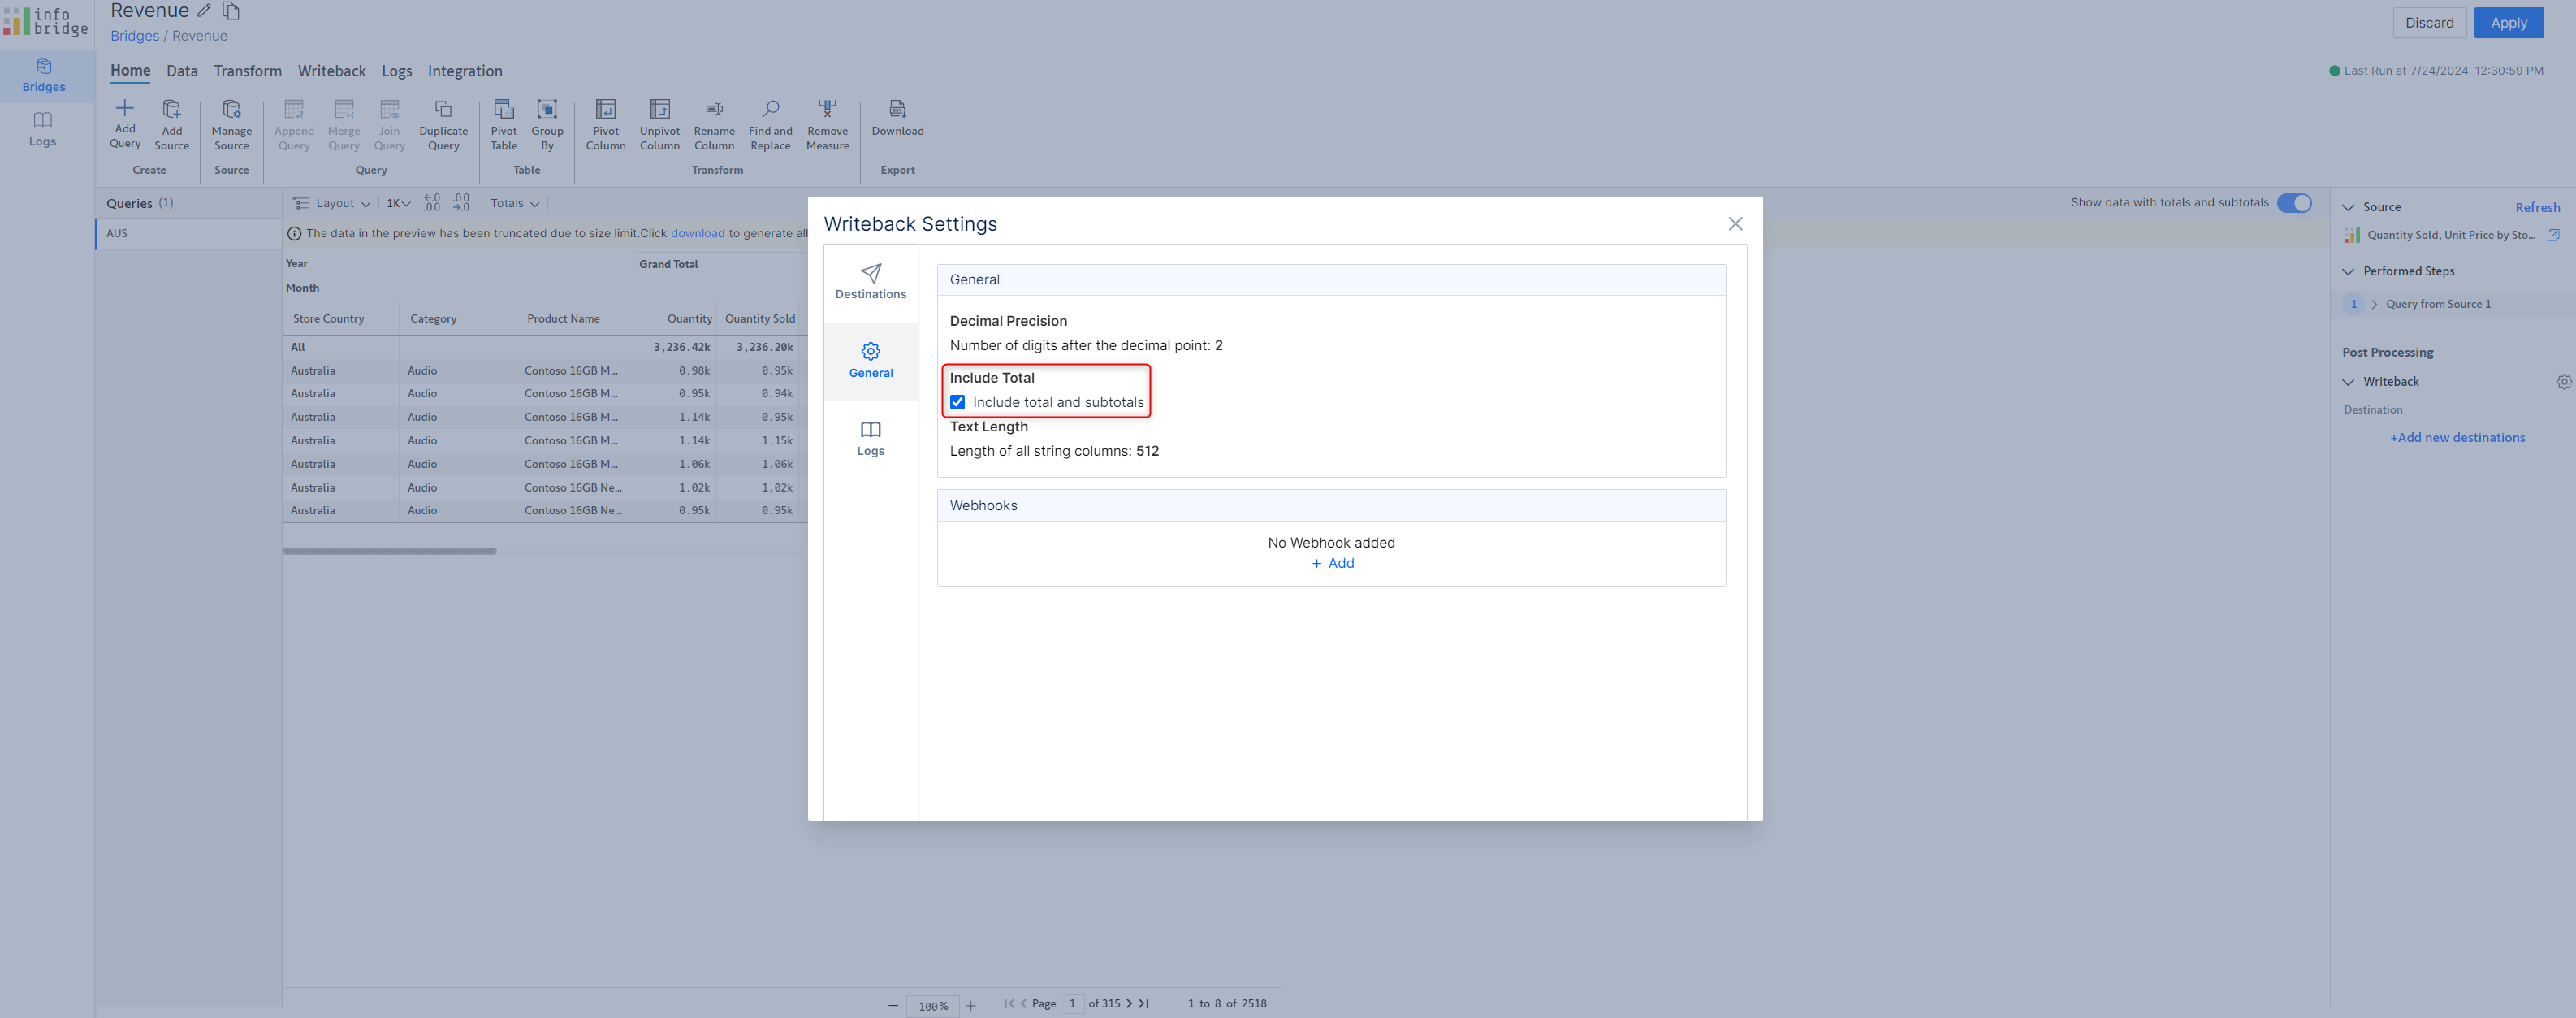
For high-speed writeback, a bridge's totals and subtotals are excluded by default. If you require these to be written back, you need to explicitly enable the Include Total option from General writeback settings.
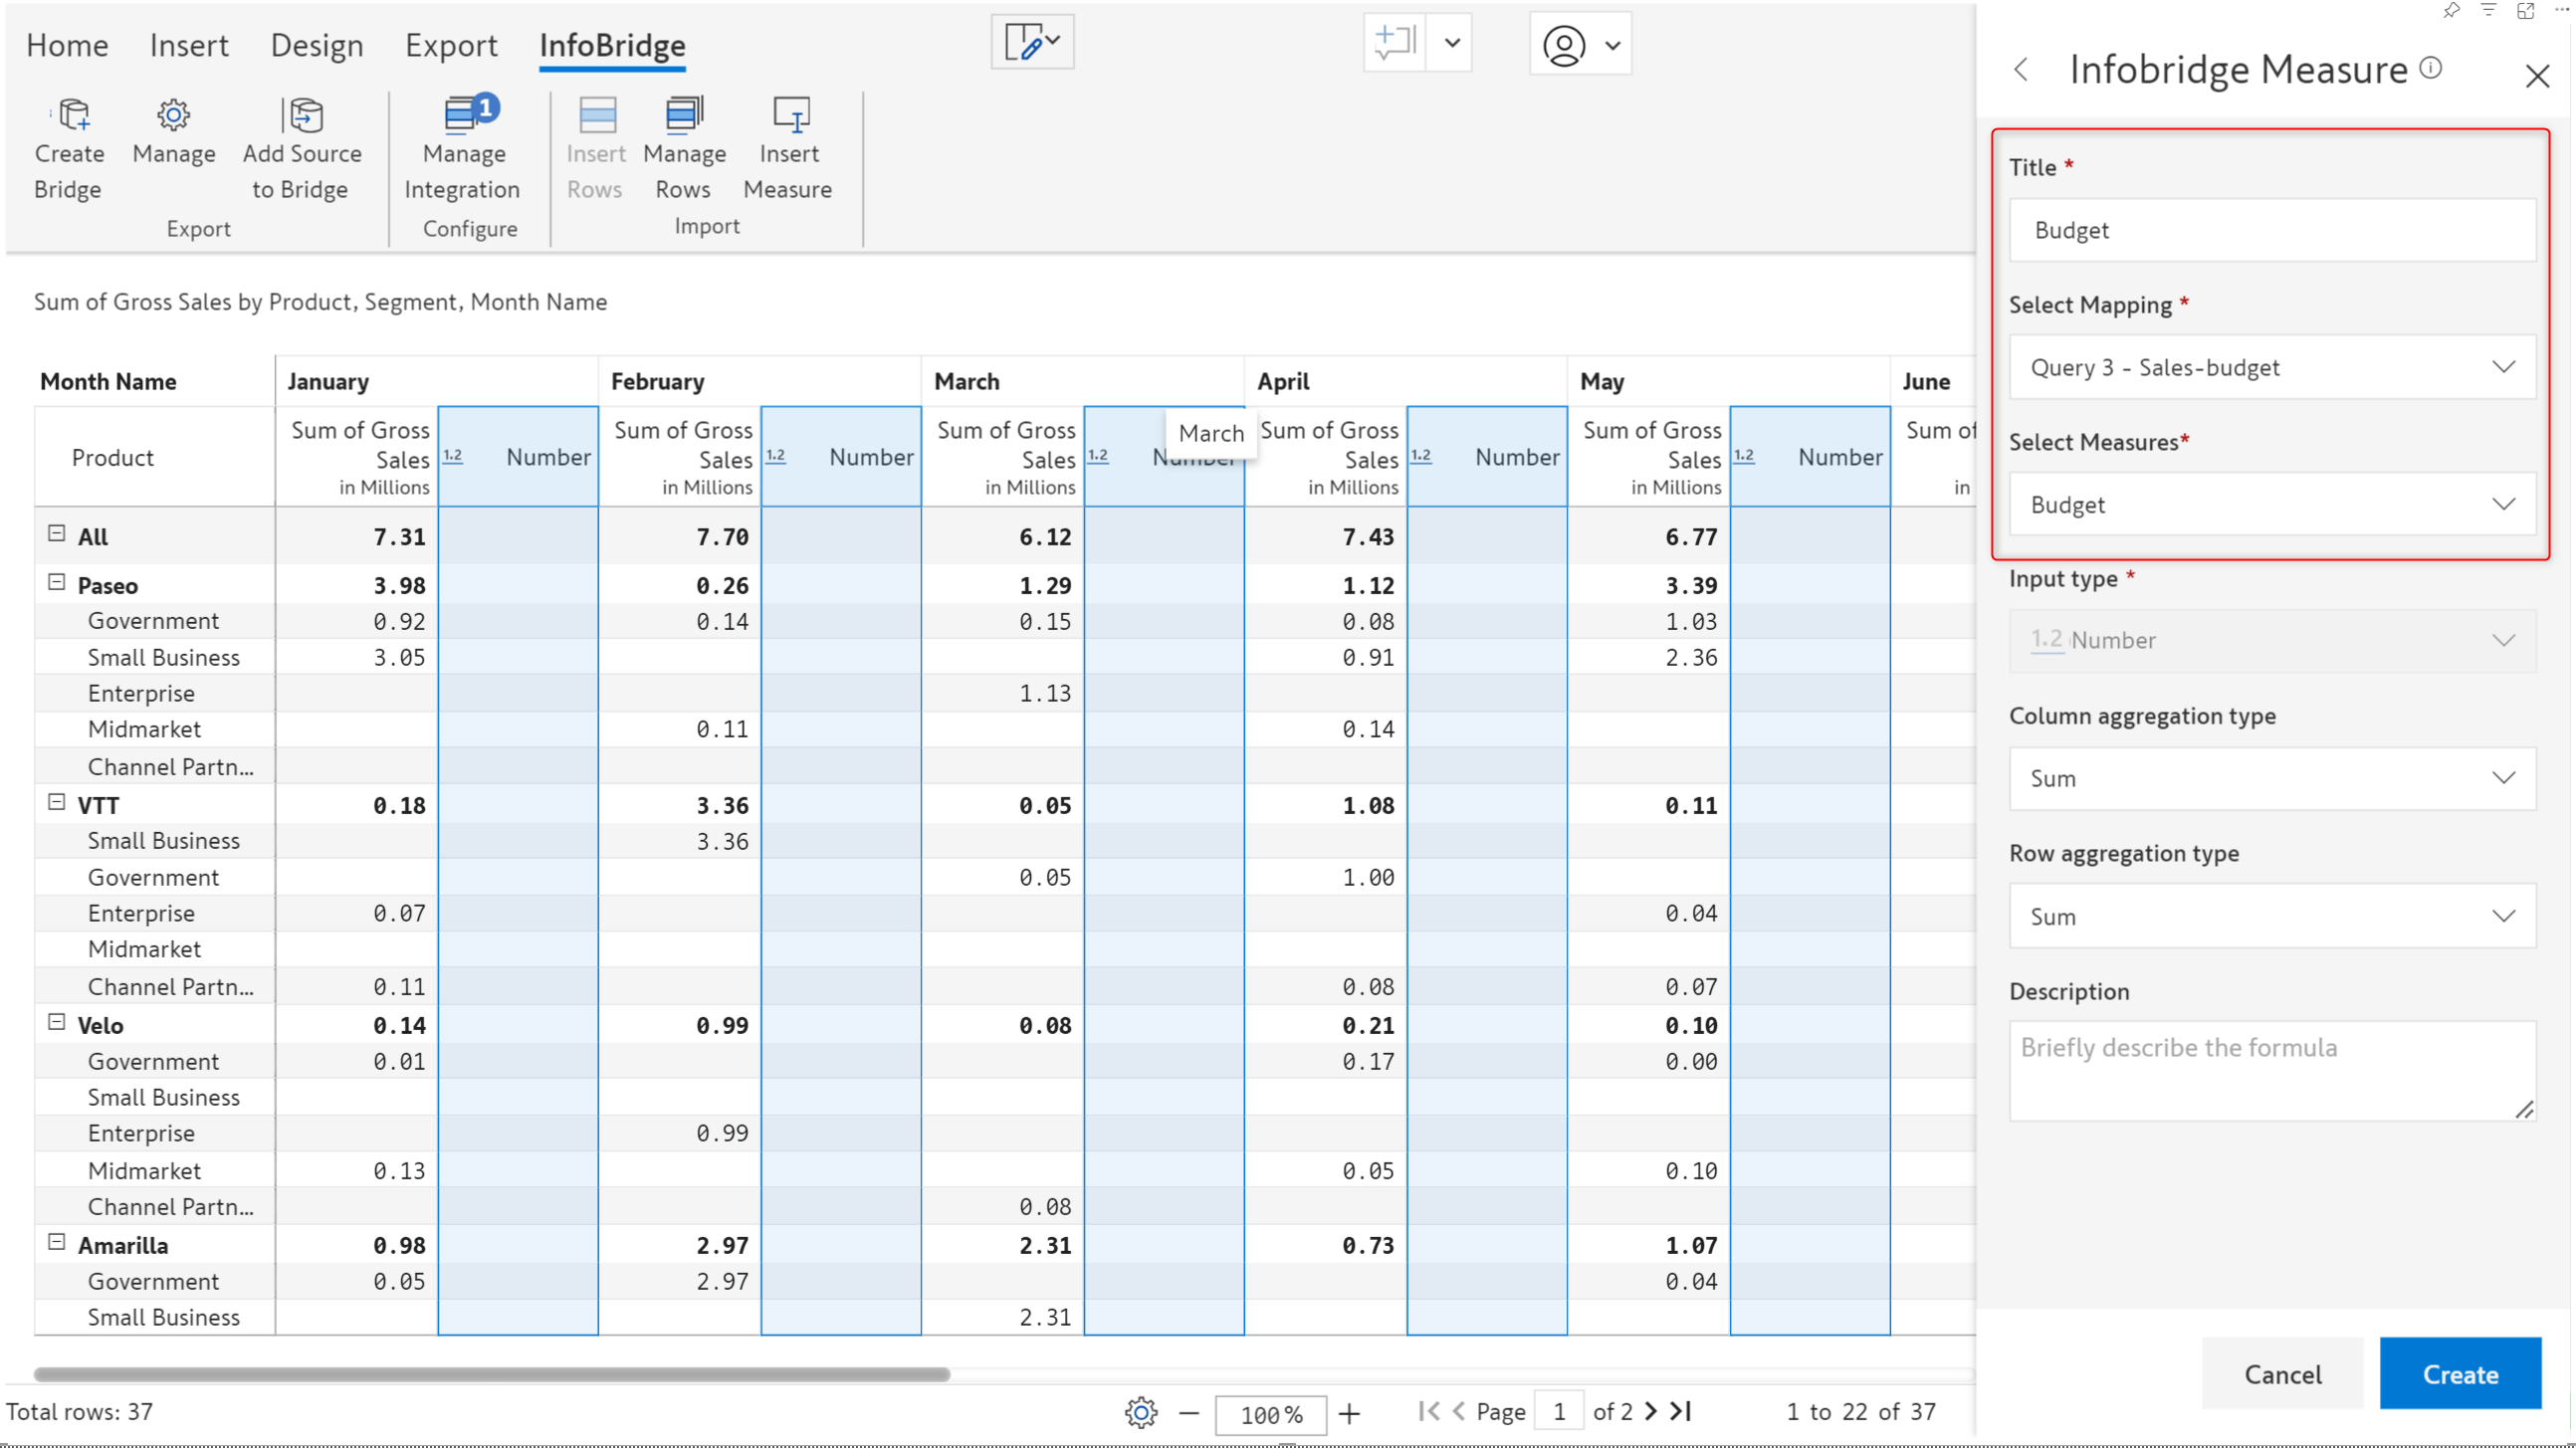
While building a report, it is common to add or remove dimensions and measures from the visual. When you import data input measures from a bridge, adding new dimensions can result in the measure going blank. However, if you remove the additional dimensions and revert to the original row categories, the measure values will be re-instated automatically.
Consider that we have imported a budget measure from a bridge.
Even when you change the dimensions in the target visual, when you revert the changes, the values will be restored.
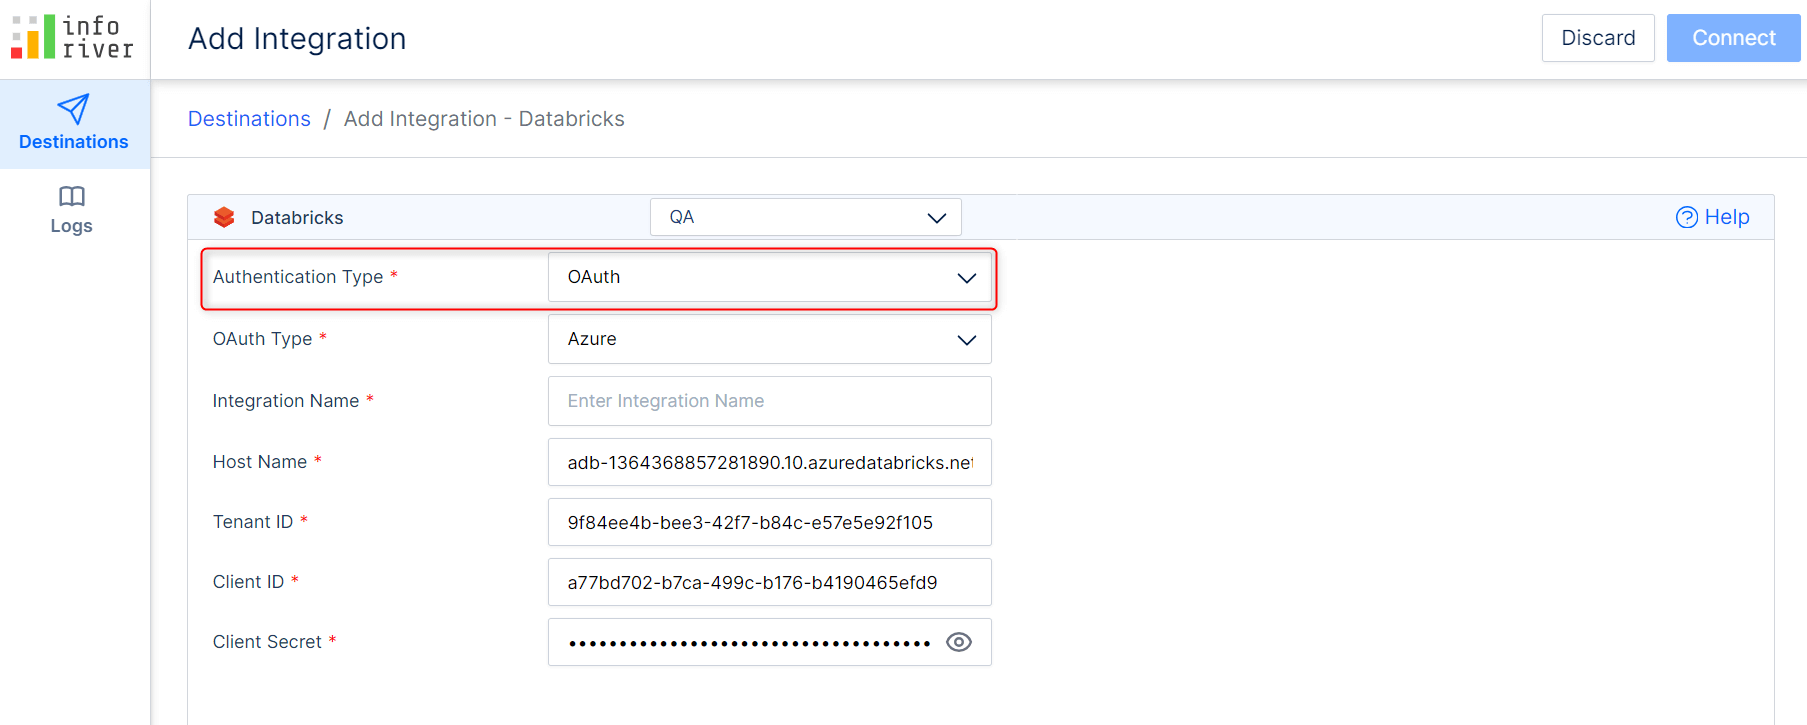
When you configure a Databricks destination in the latest version, you’ll notice that you can use OAuth (Open Authorization) instead of basic authentication. Using OAuth authentication enhances security and user experience.
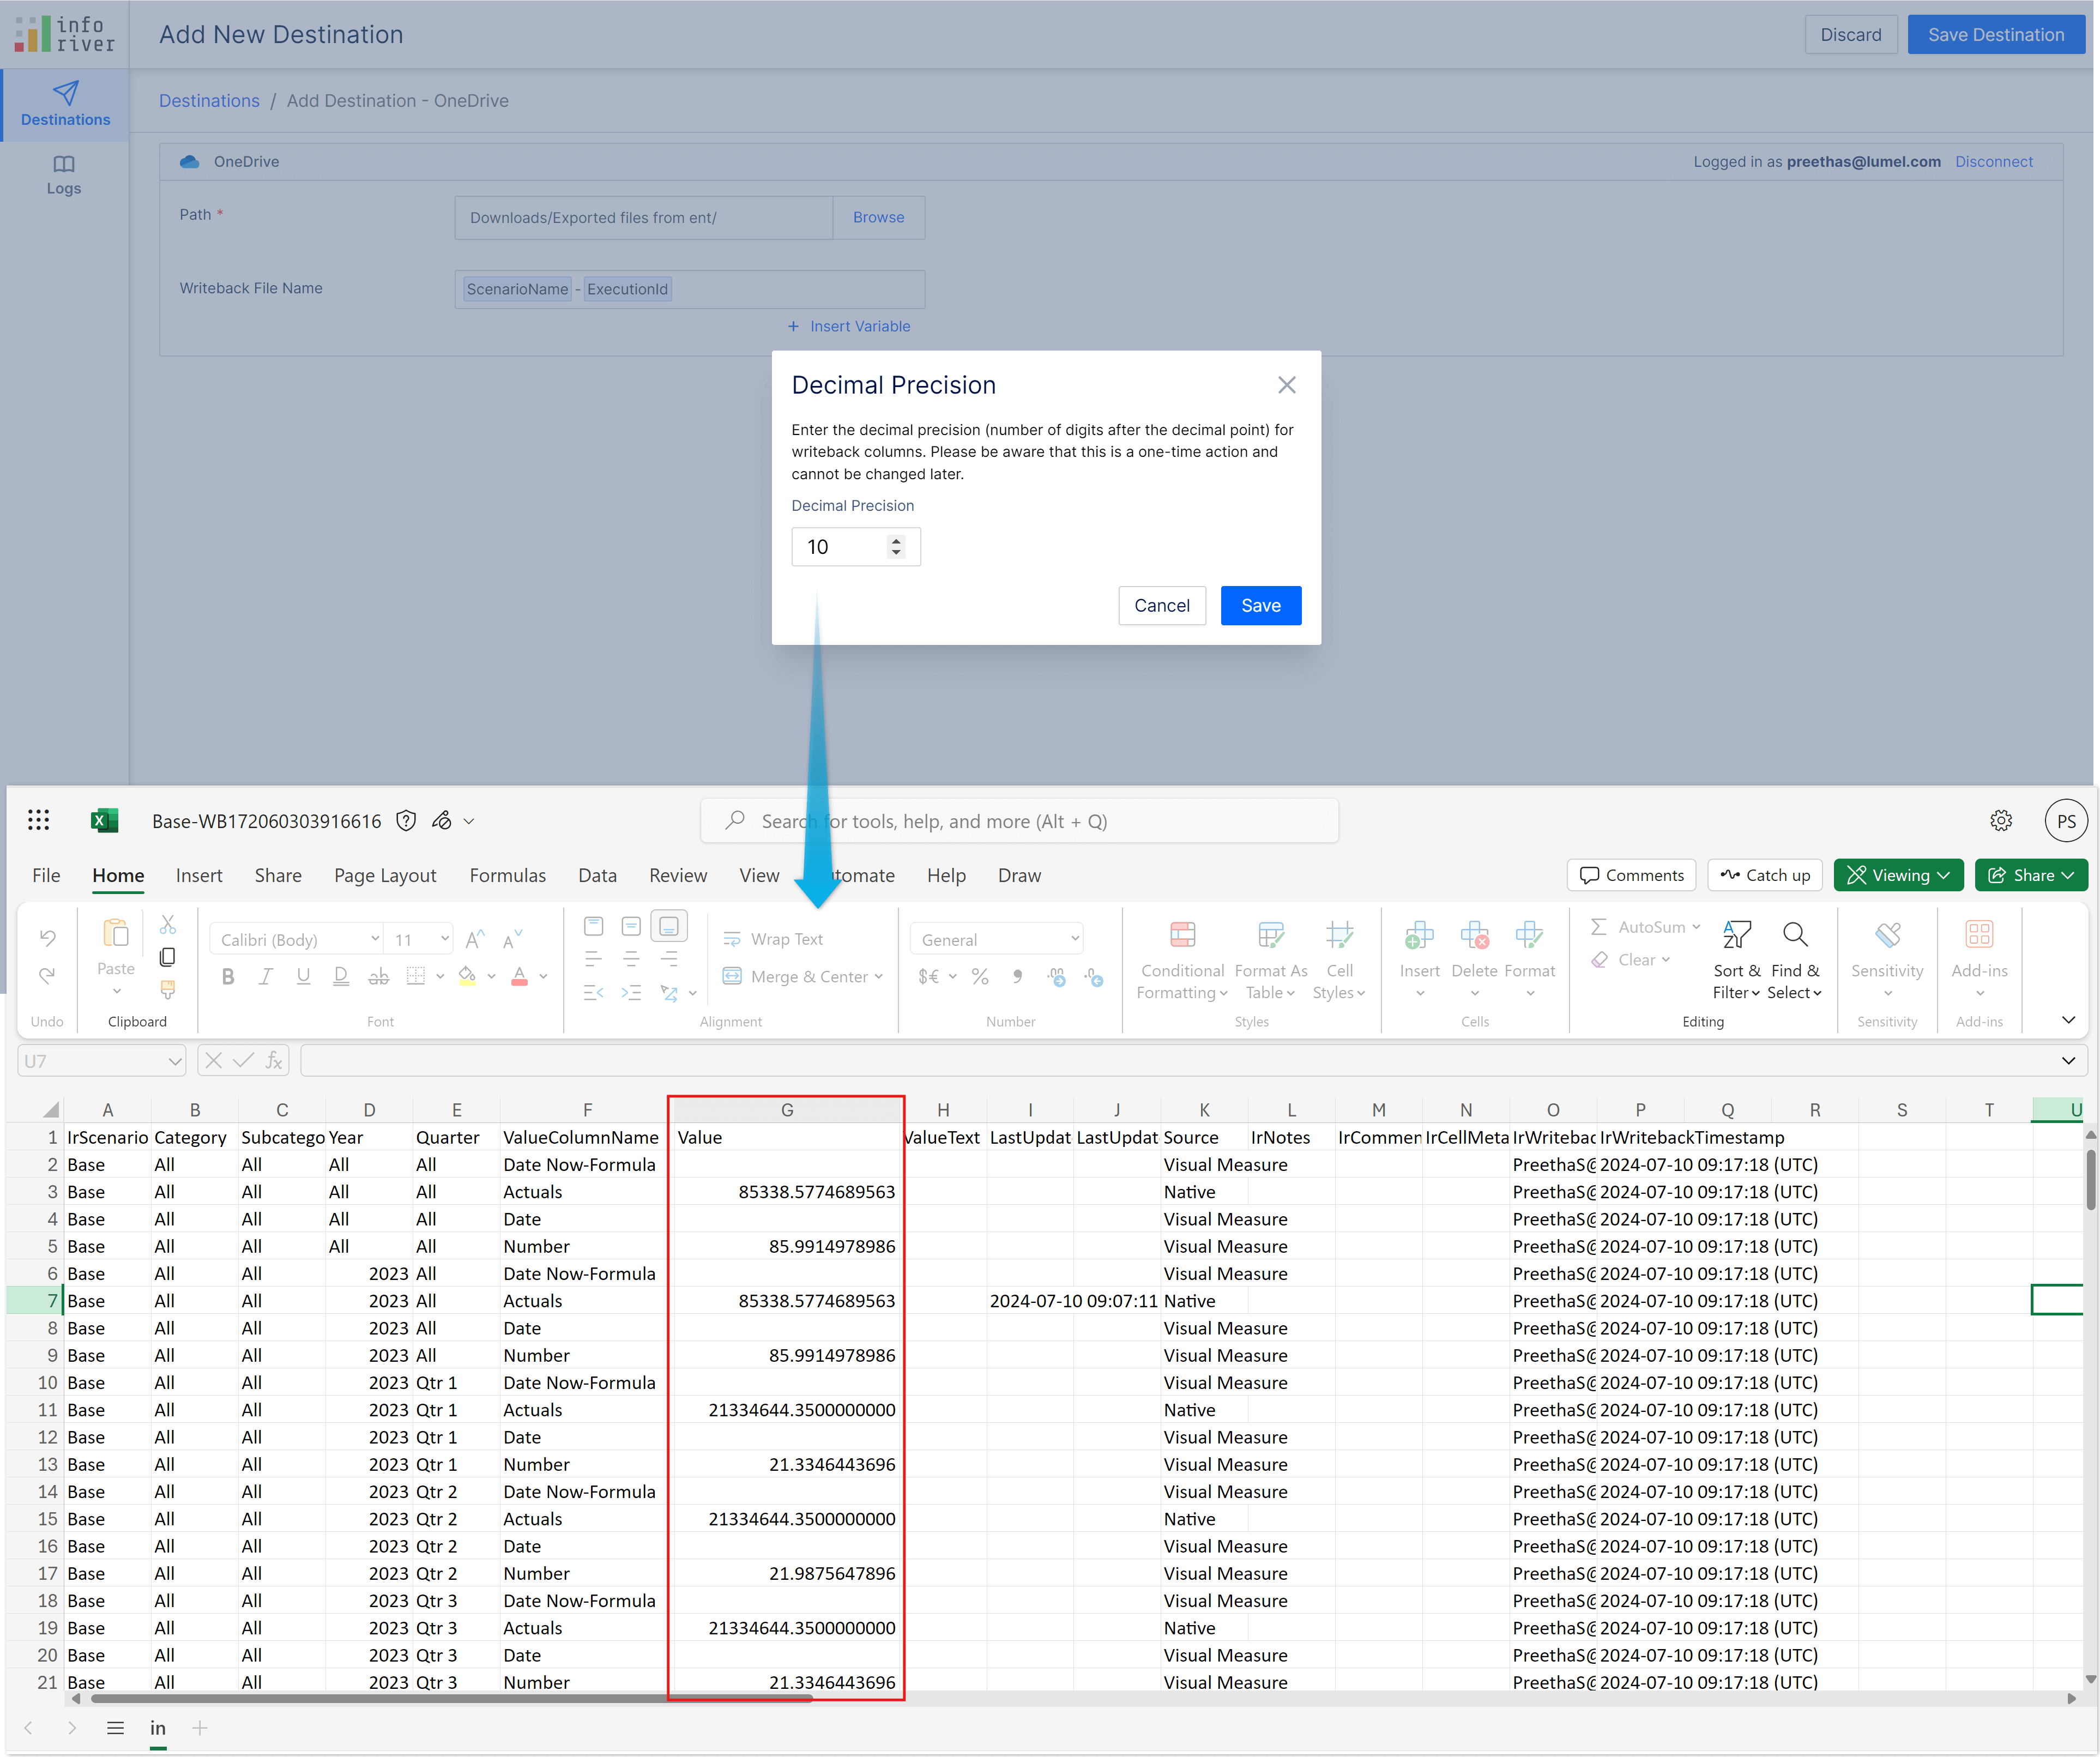
Areas like regulatory and compliance reporting or interest rate allocations in investment reports require high precision. Previously, Inforiver supported a maximum of 5 decimal places. Now, you can write back numerical data up to ten decimal digits. Any digits beyond 10 will be rounded off. You can configure the precision while adding the writeback destination.
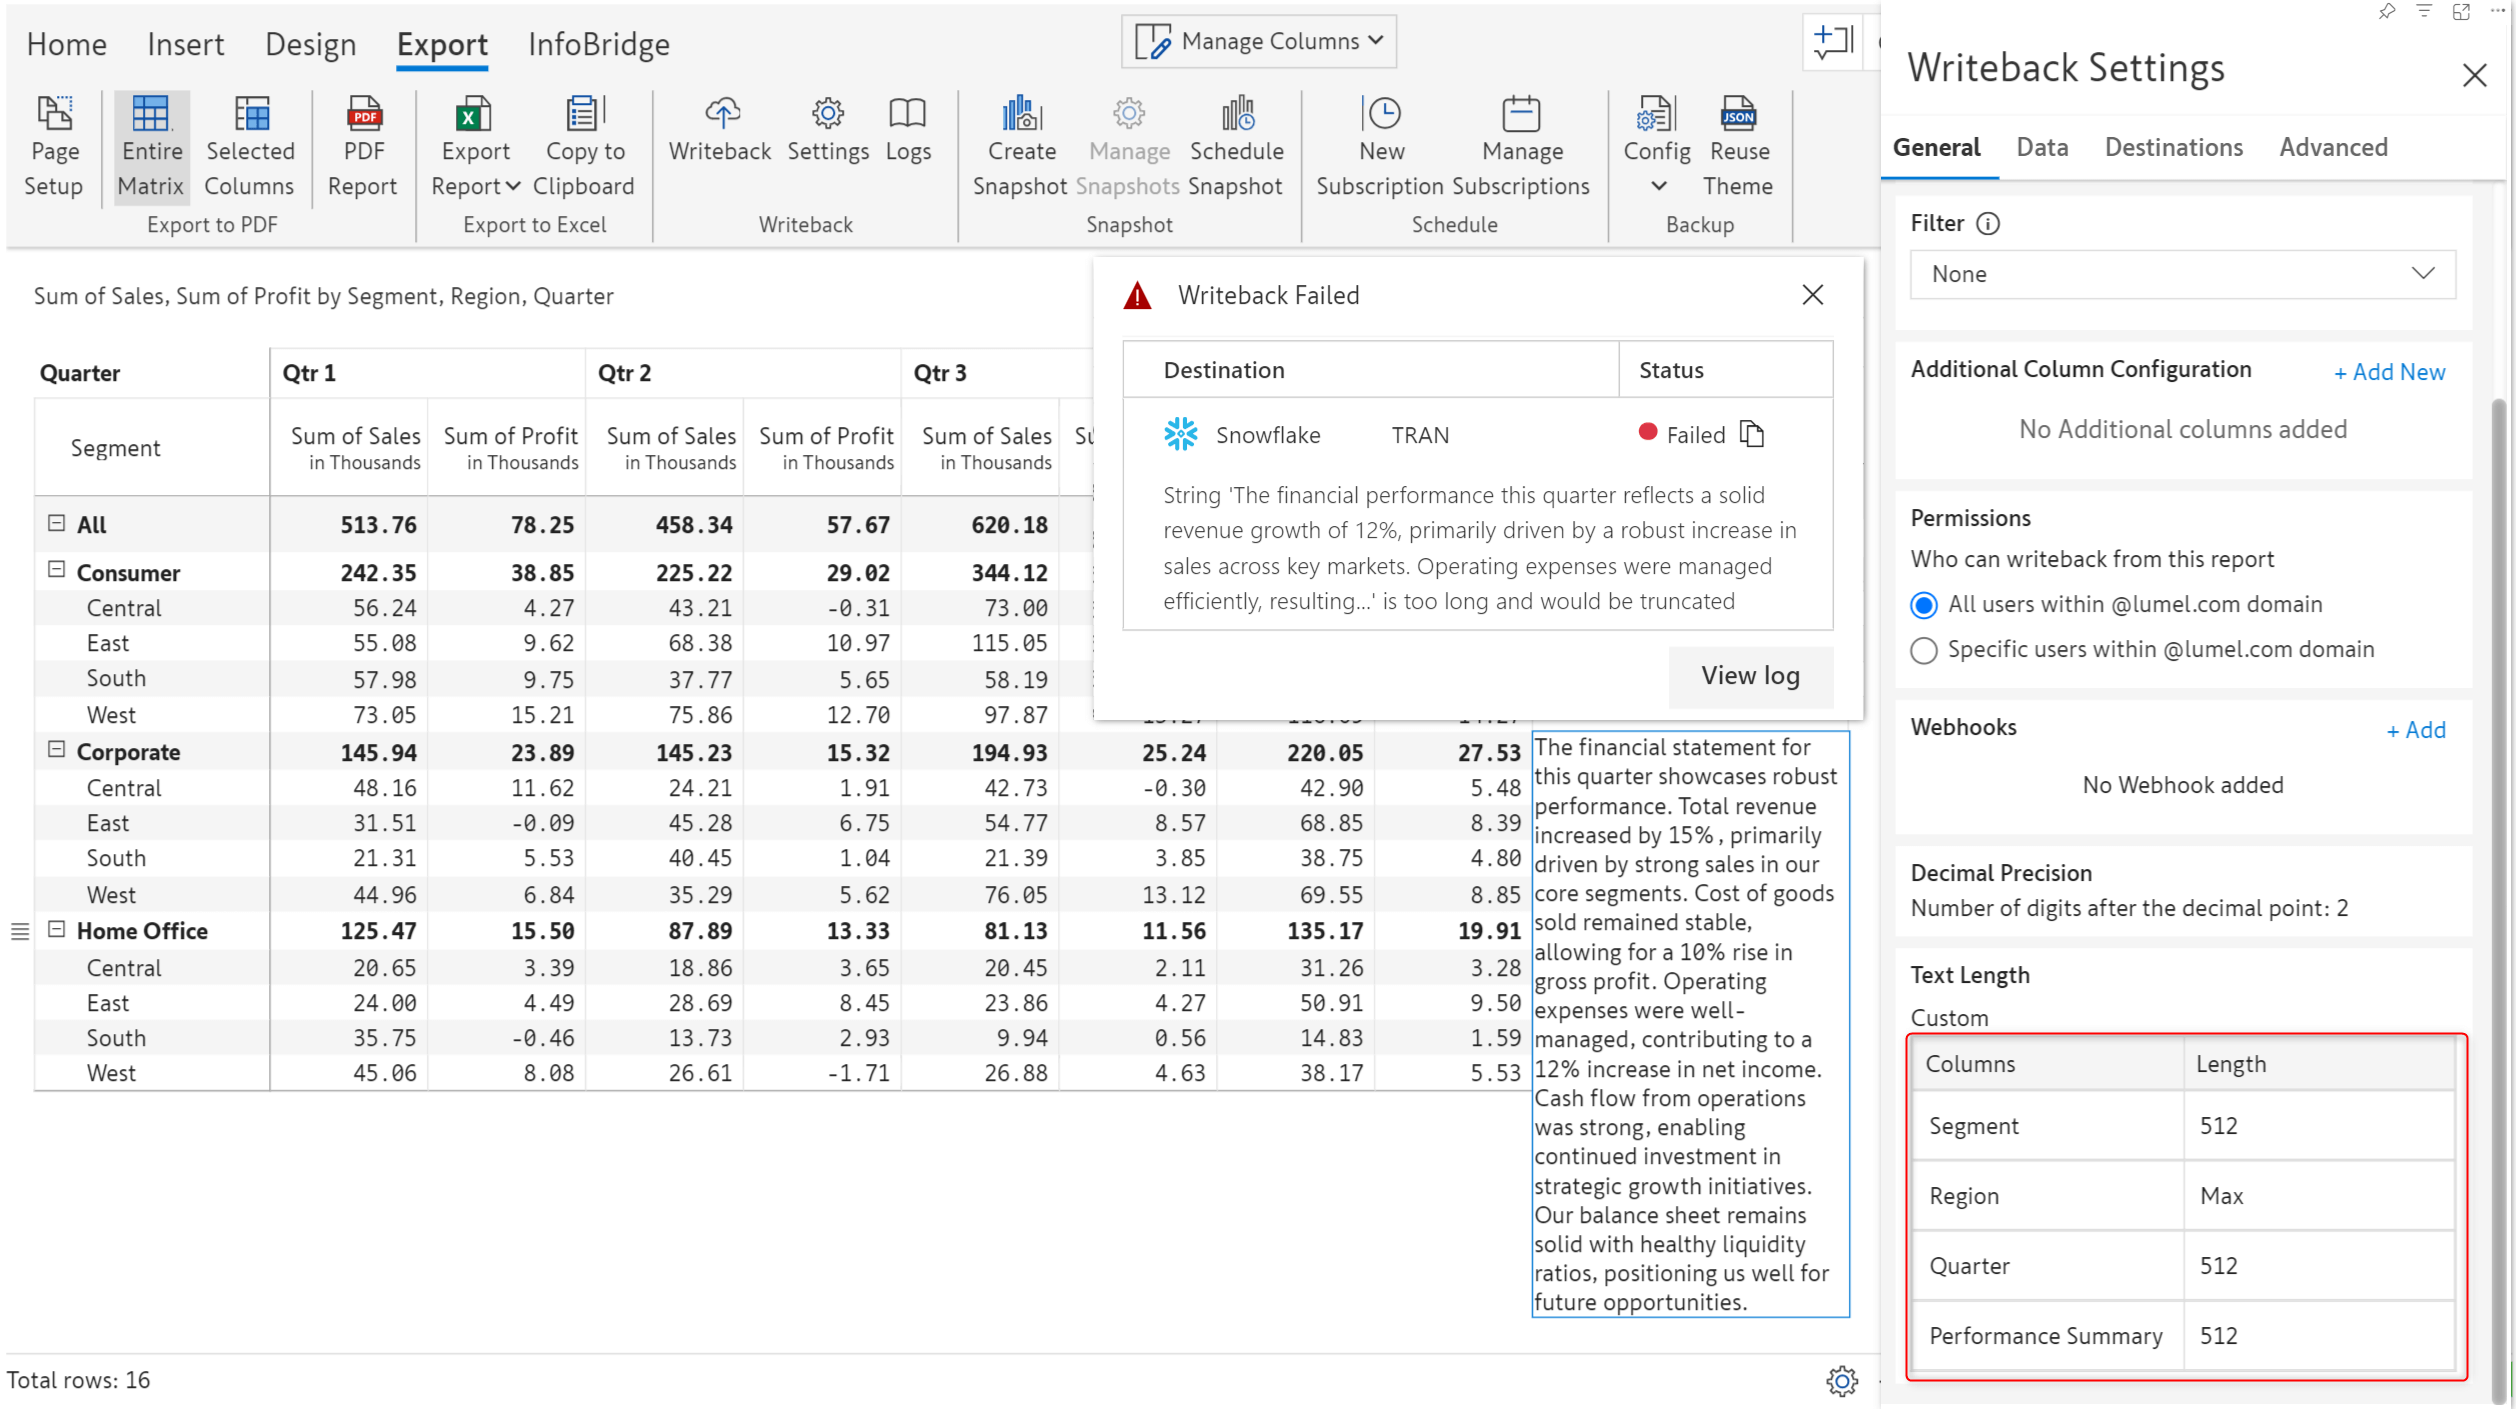
When you add destinations, you can restrict text fields to 512 characters or allow writeback up to the maximum limit supported by the backend.
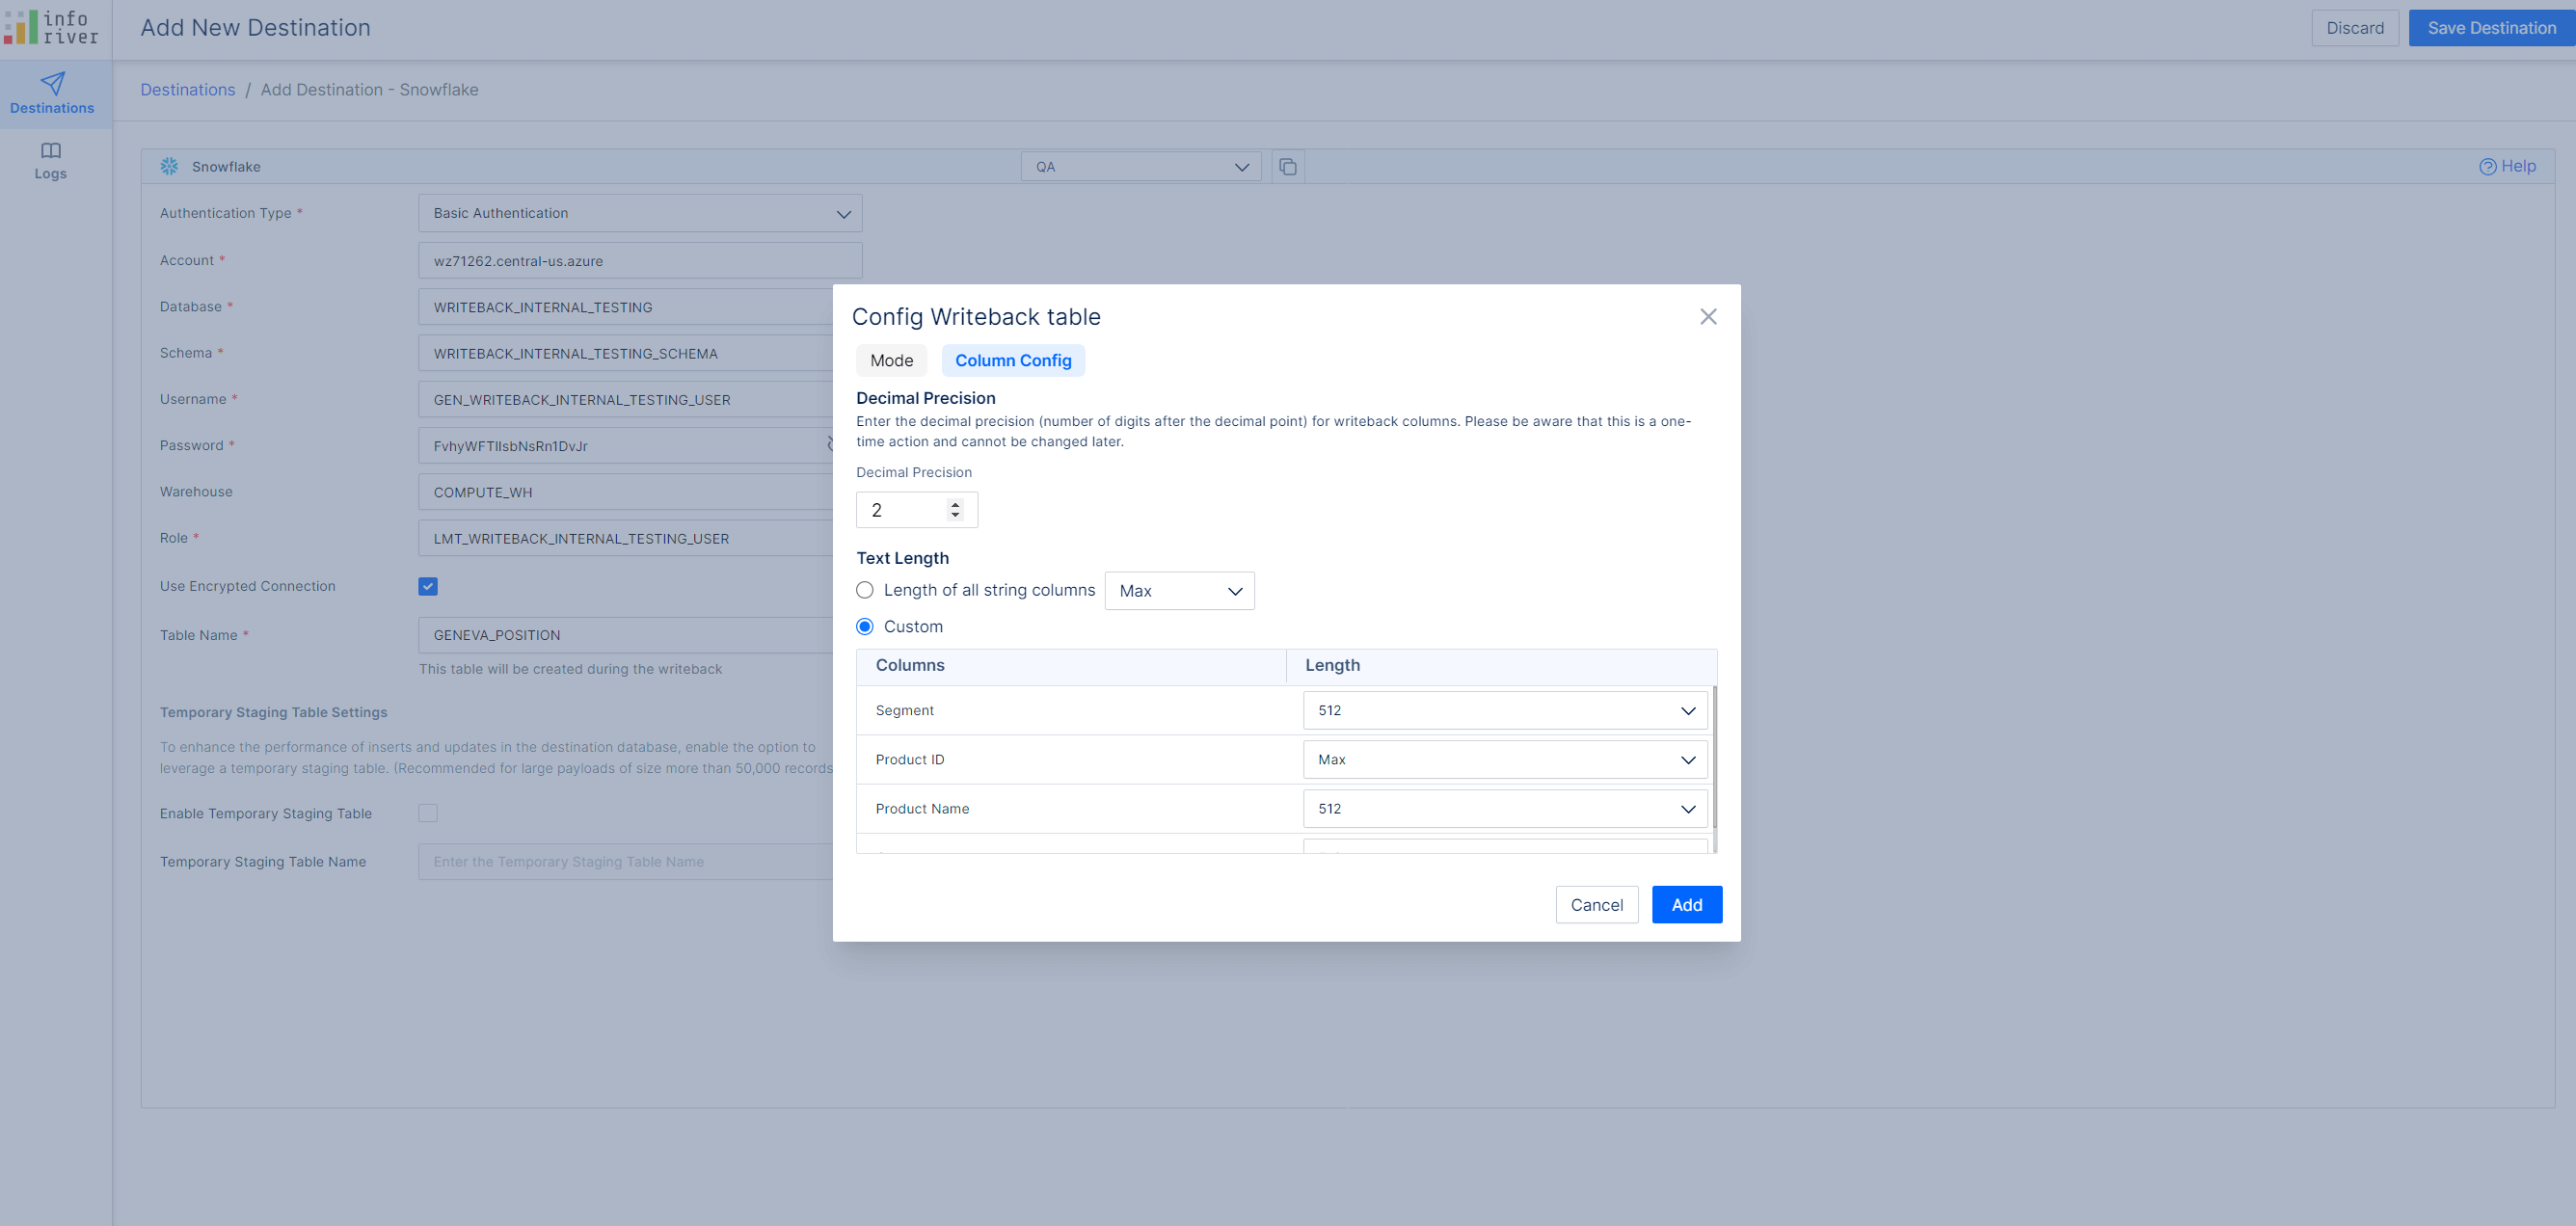
If you have a text length restriction in place and the length is greater than 512 characters, writeback will fail.
Blank rows and columns can diminish the appeal of a tabular report. When you have a data input date field, entering or copying dates manually in a report with thousands of rows can prove to be a tedious task. Inforiver now provides a default option for data input date fields as well.
The latest version provides multiple options to set default values:
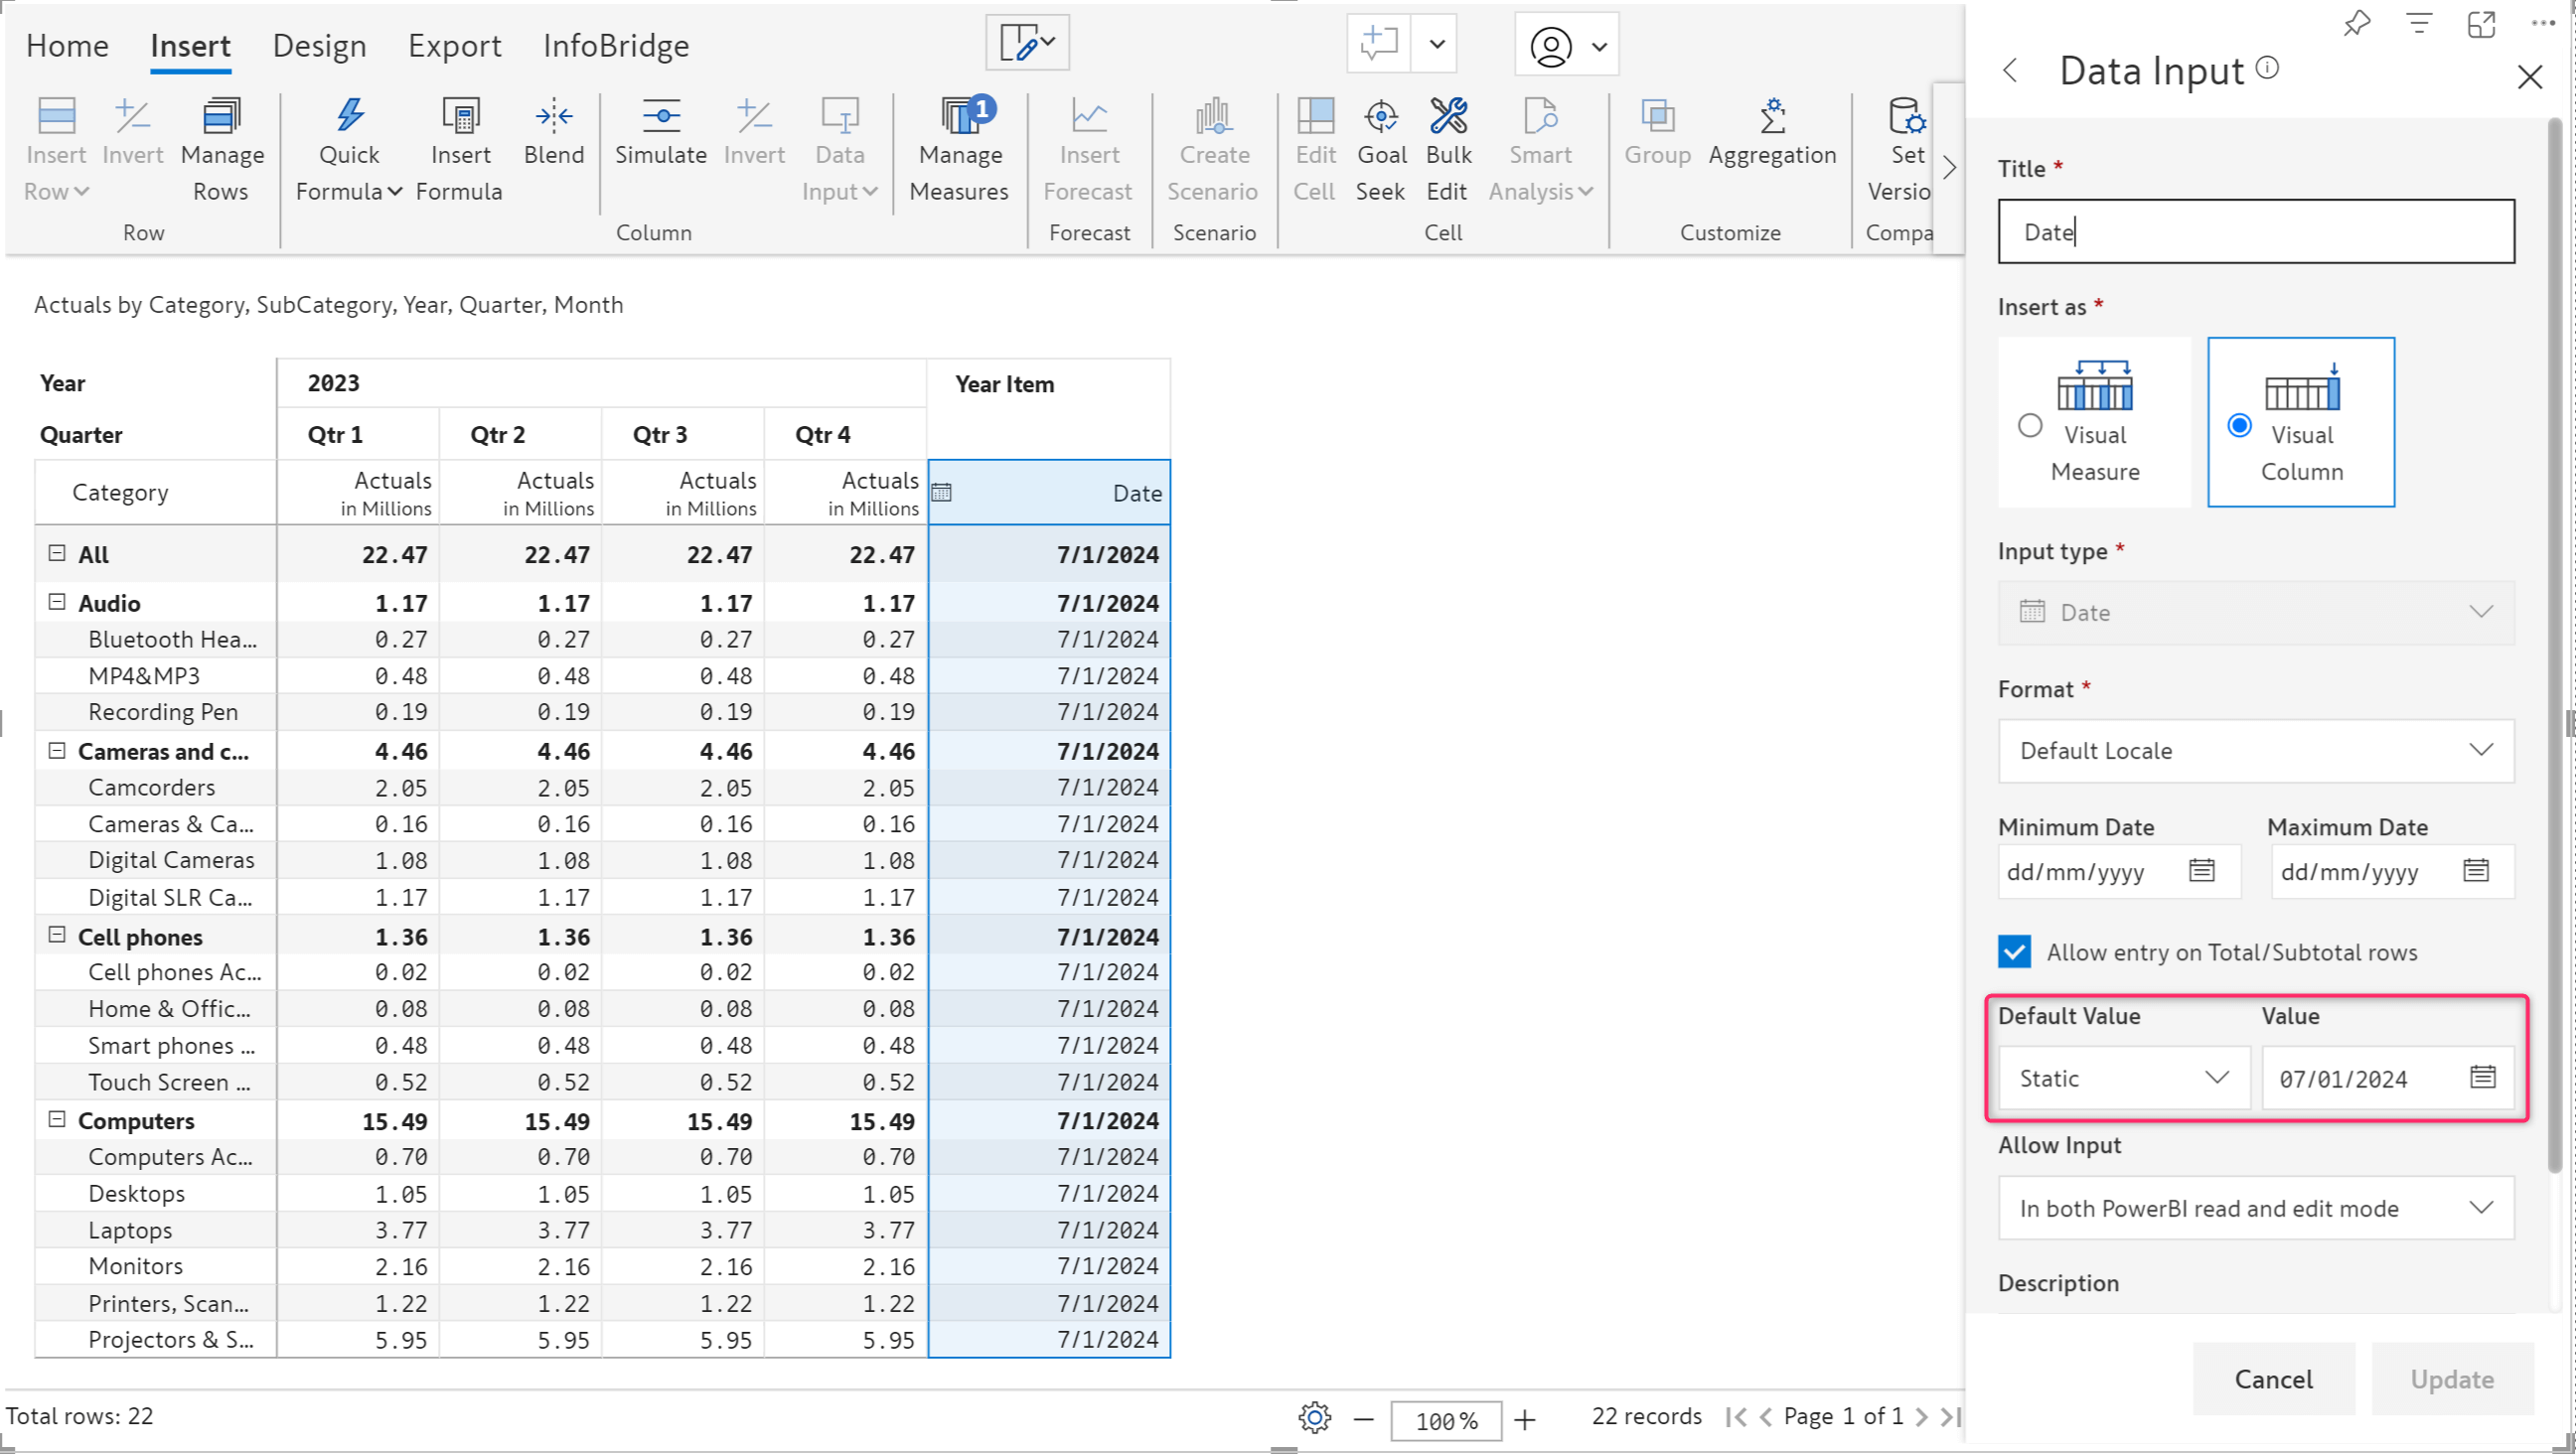
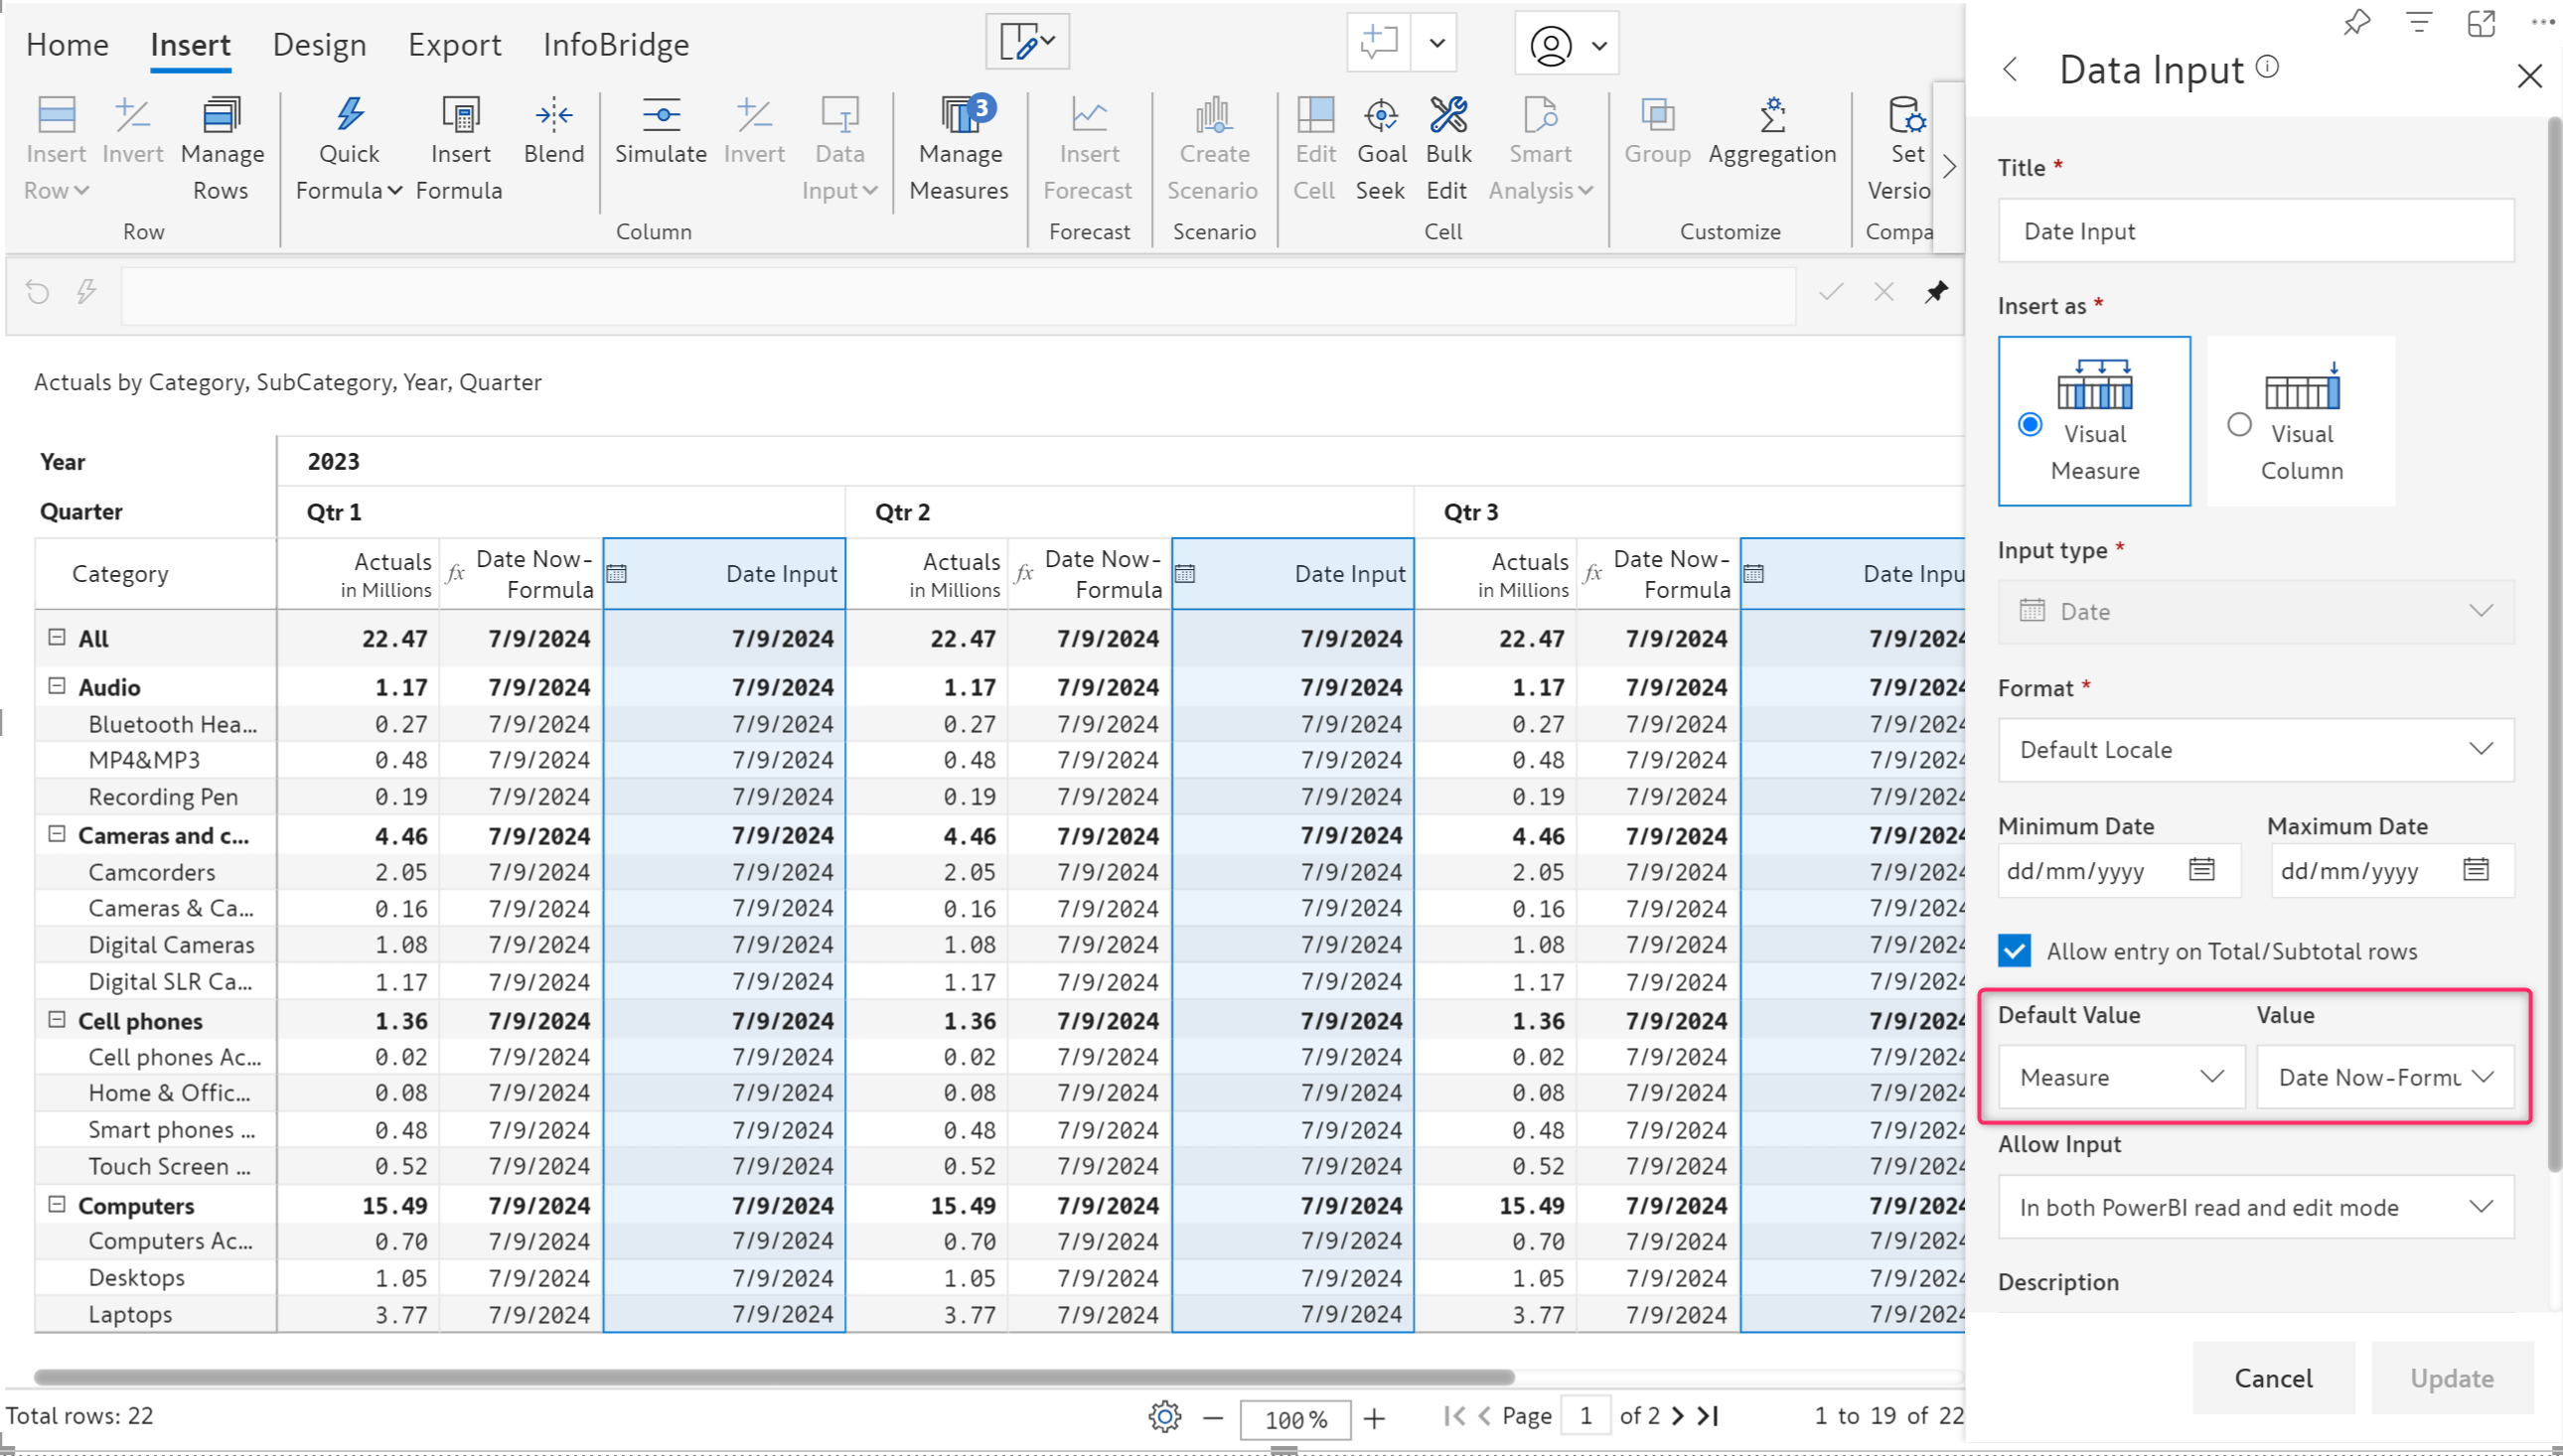
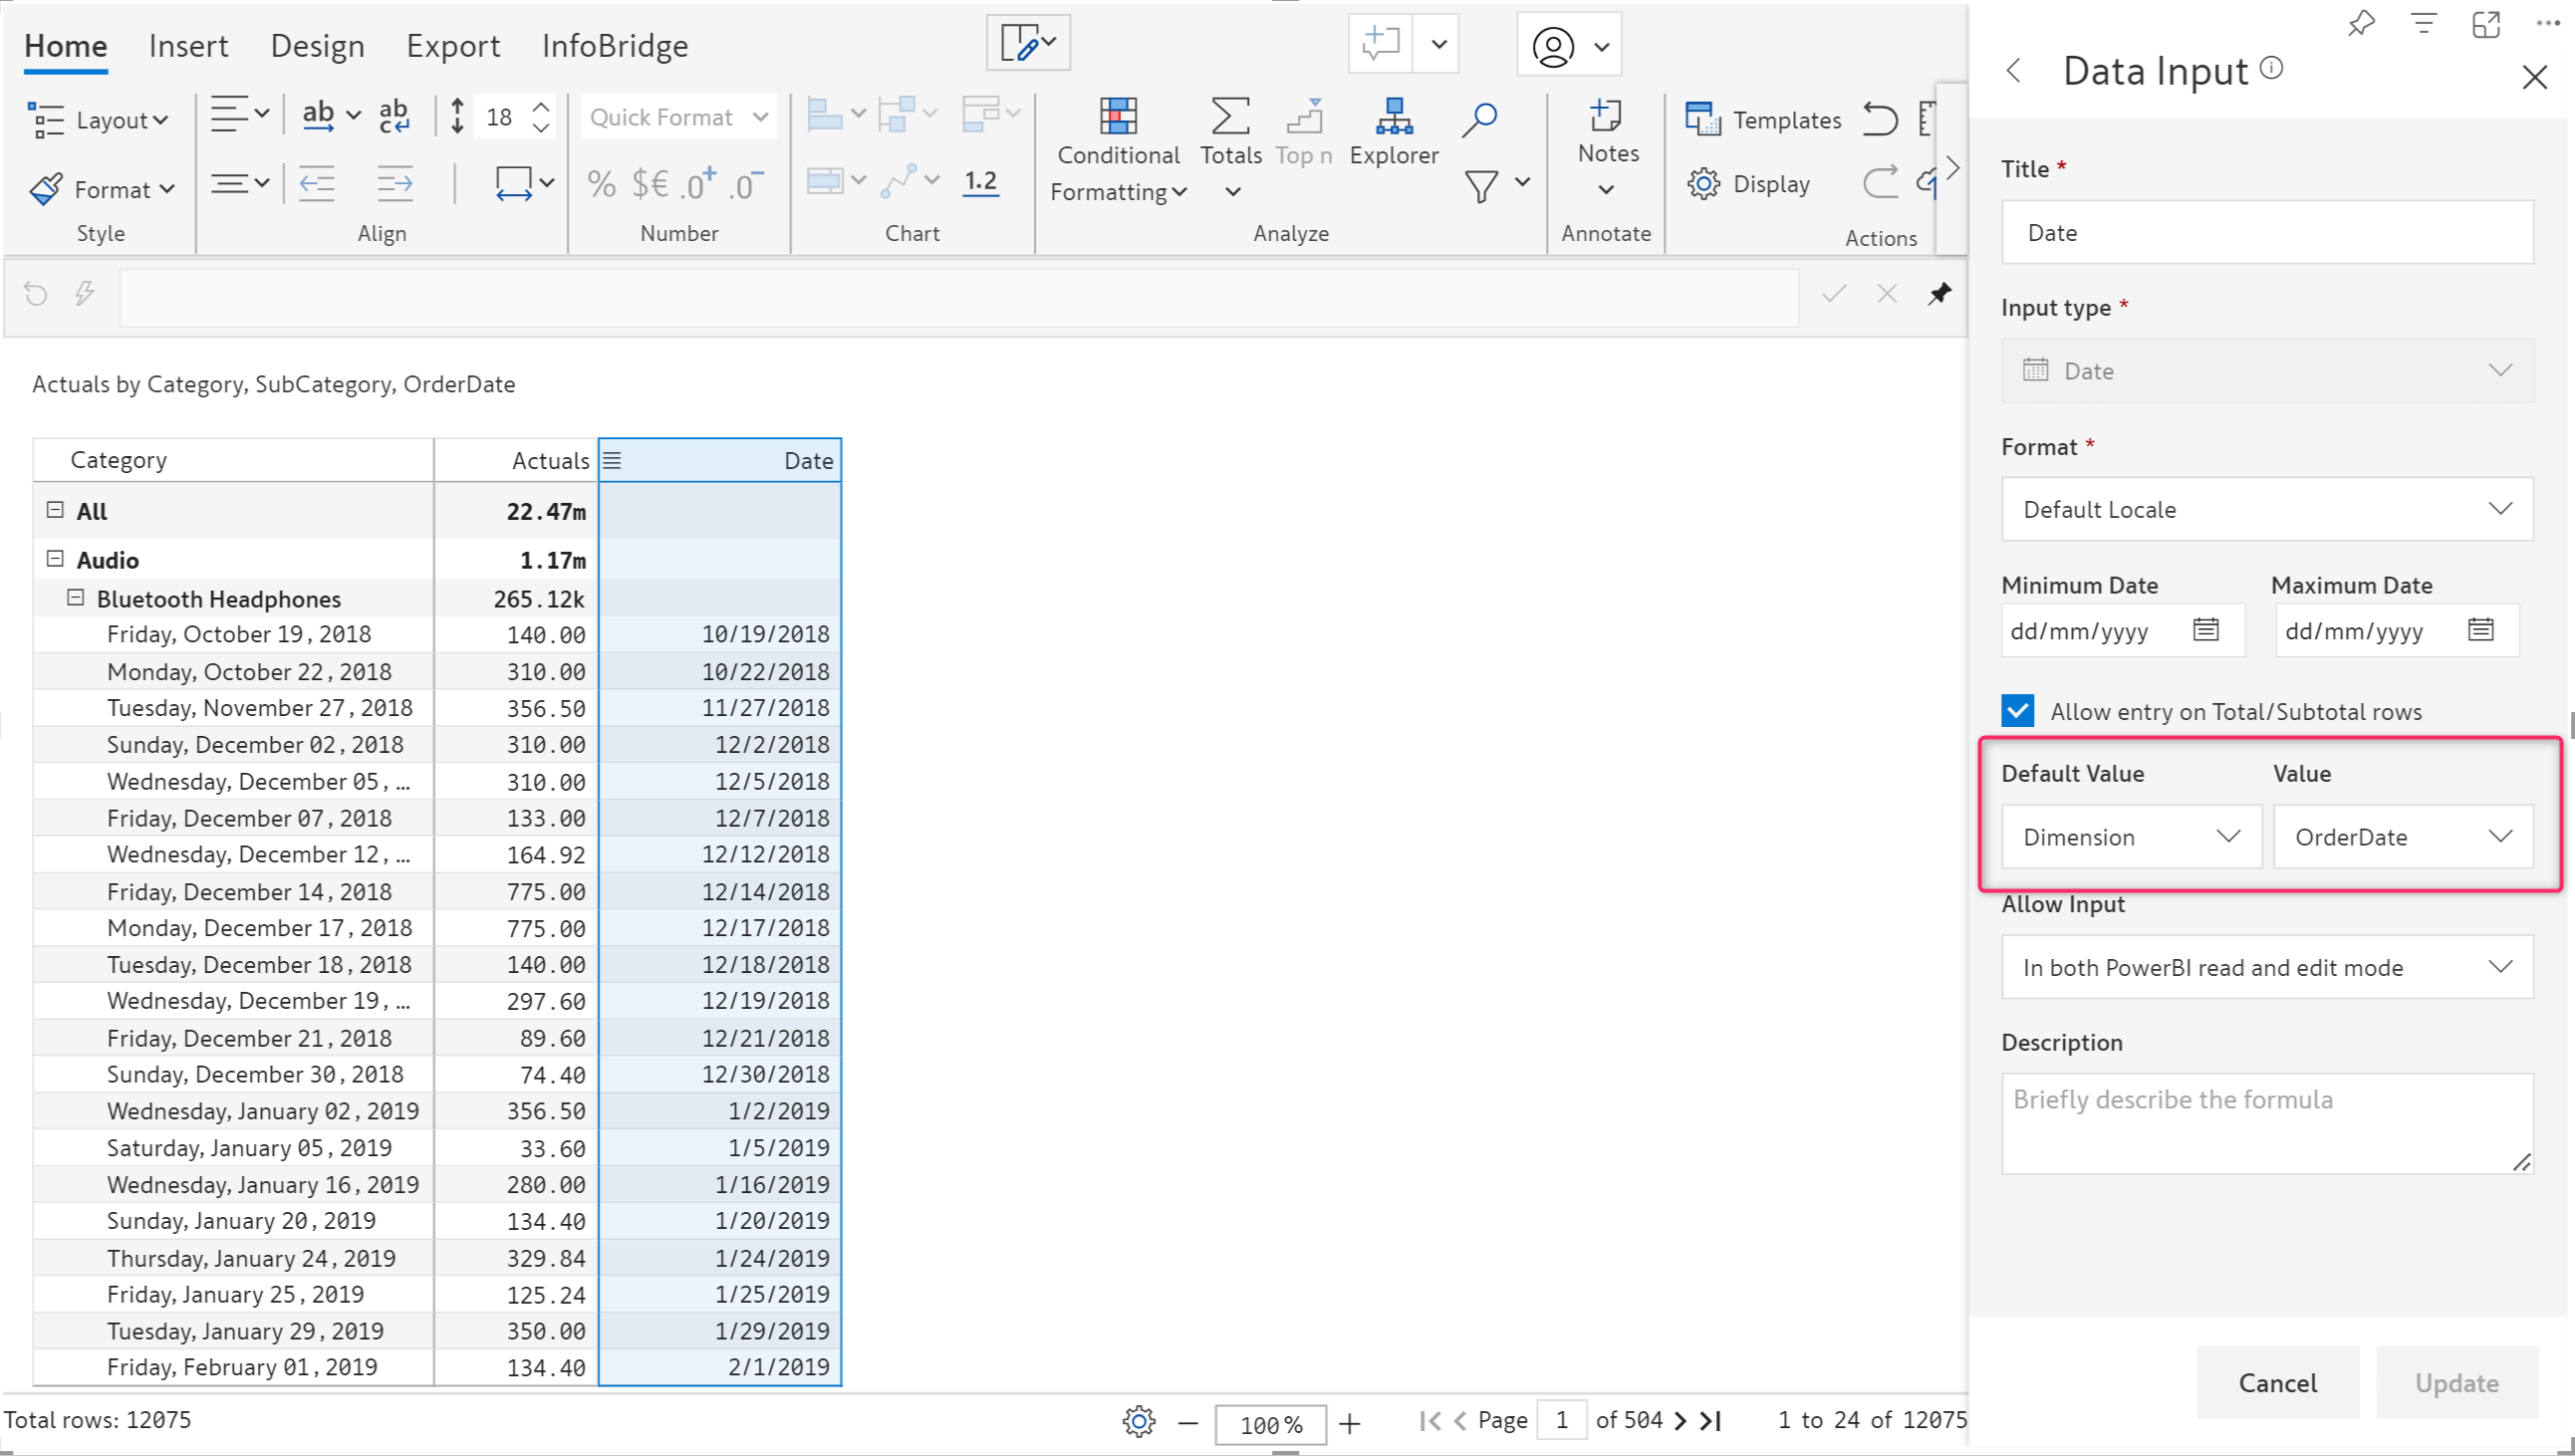
The default option is available for both visual measures and visual columns. Invalid date format errors are implicitly handled as blanks for a clean export and writeback.
In the previous release, we rolled out the Bulk Edit feature that enables you to allocate and distribute values across multiple cells in one go. In this release, we’ve expanded the bulk edit functionality to all data input types: number (column and measure), text, date, person, single-select, and multi-select - which means that you can now use bulk edit for operations like setting an expiry date for a range of products or assigning a manager for specific locations. You’ll find bulk edits particularly handy for reports with high data volumes, where manually updating data cell-by-cell is not feasible.
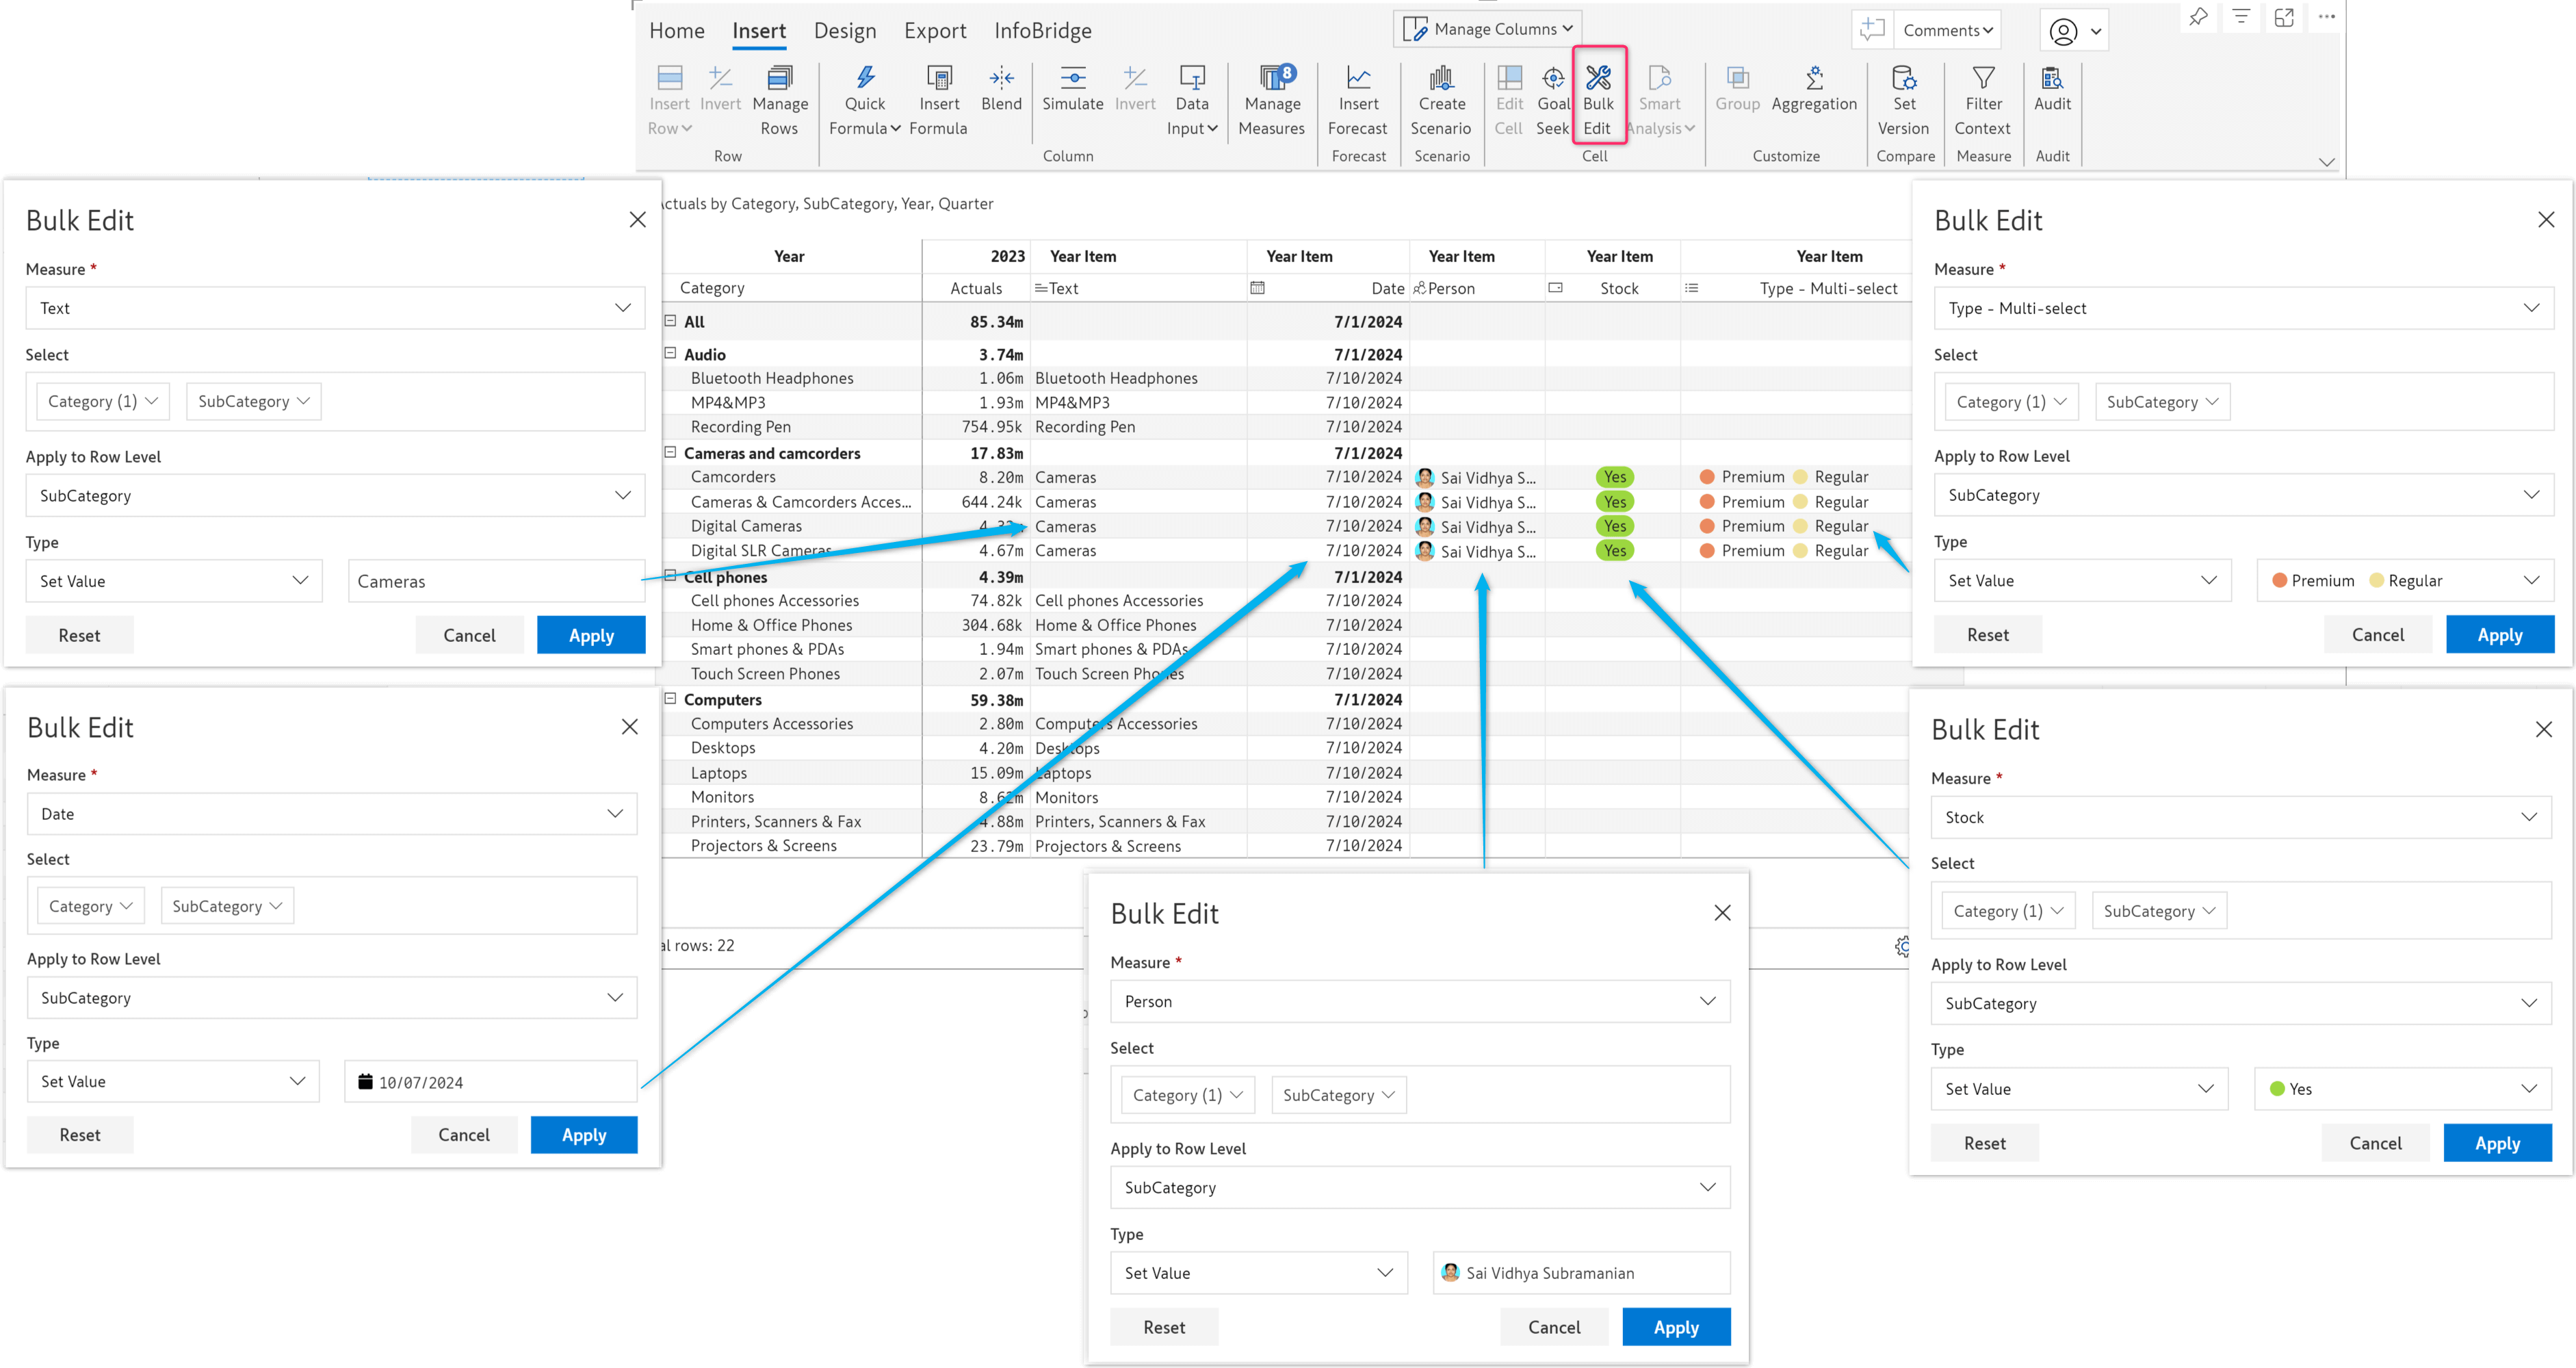
For date fields, you can either set a date from the date picker or add a duration in years, quarters, months, weeks, or days to the existing date.
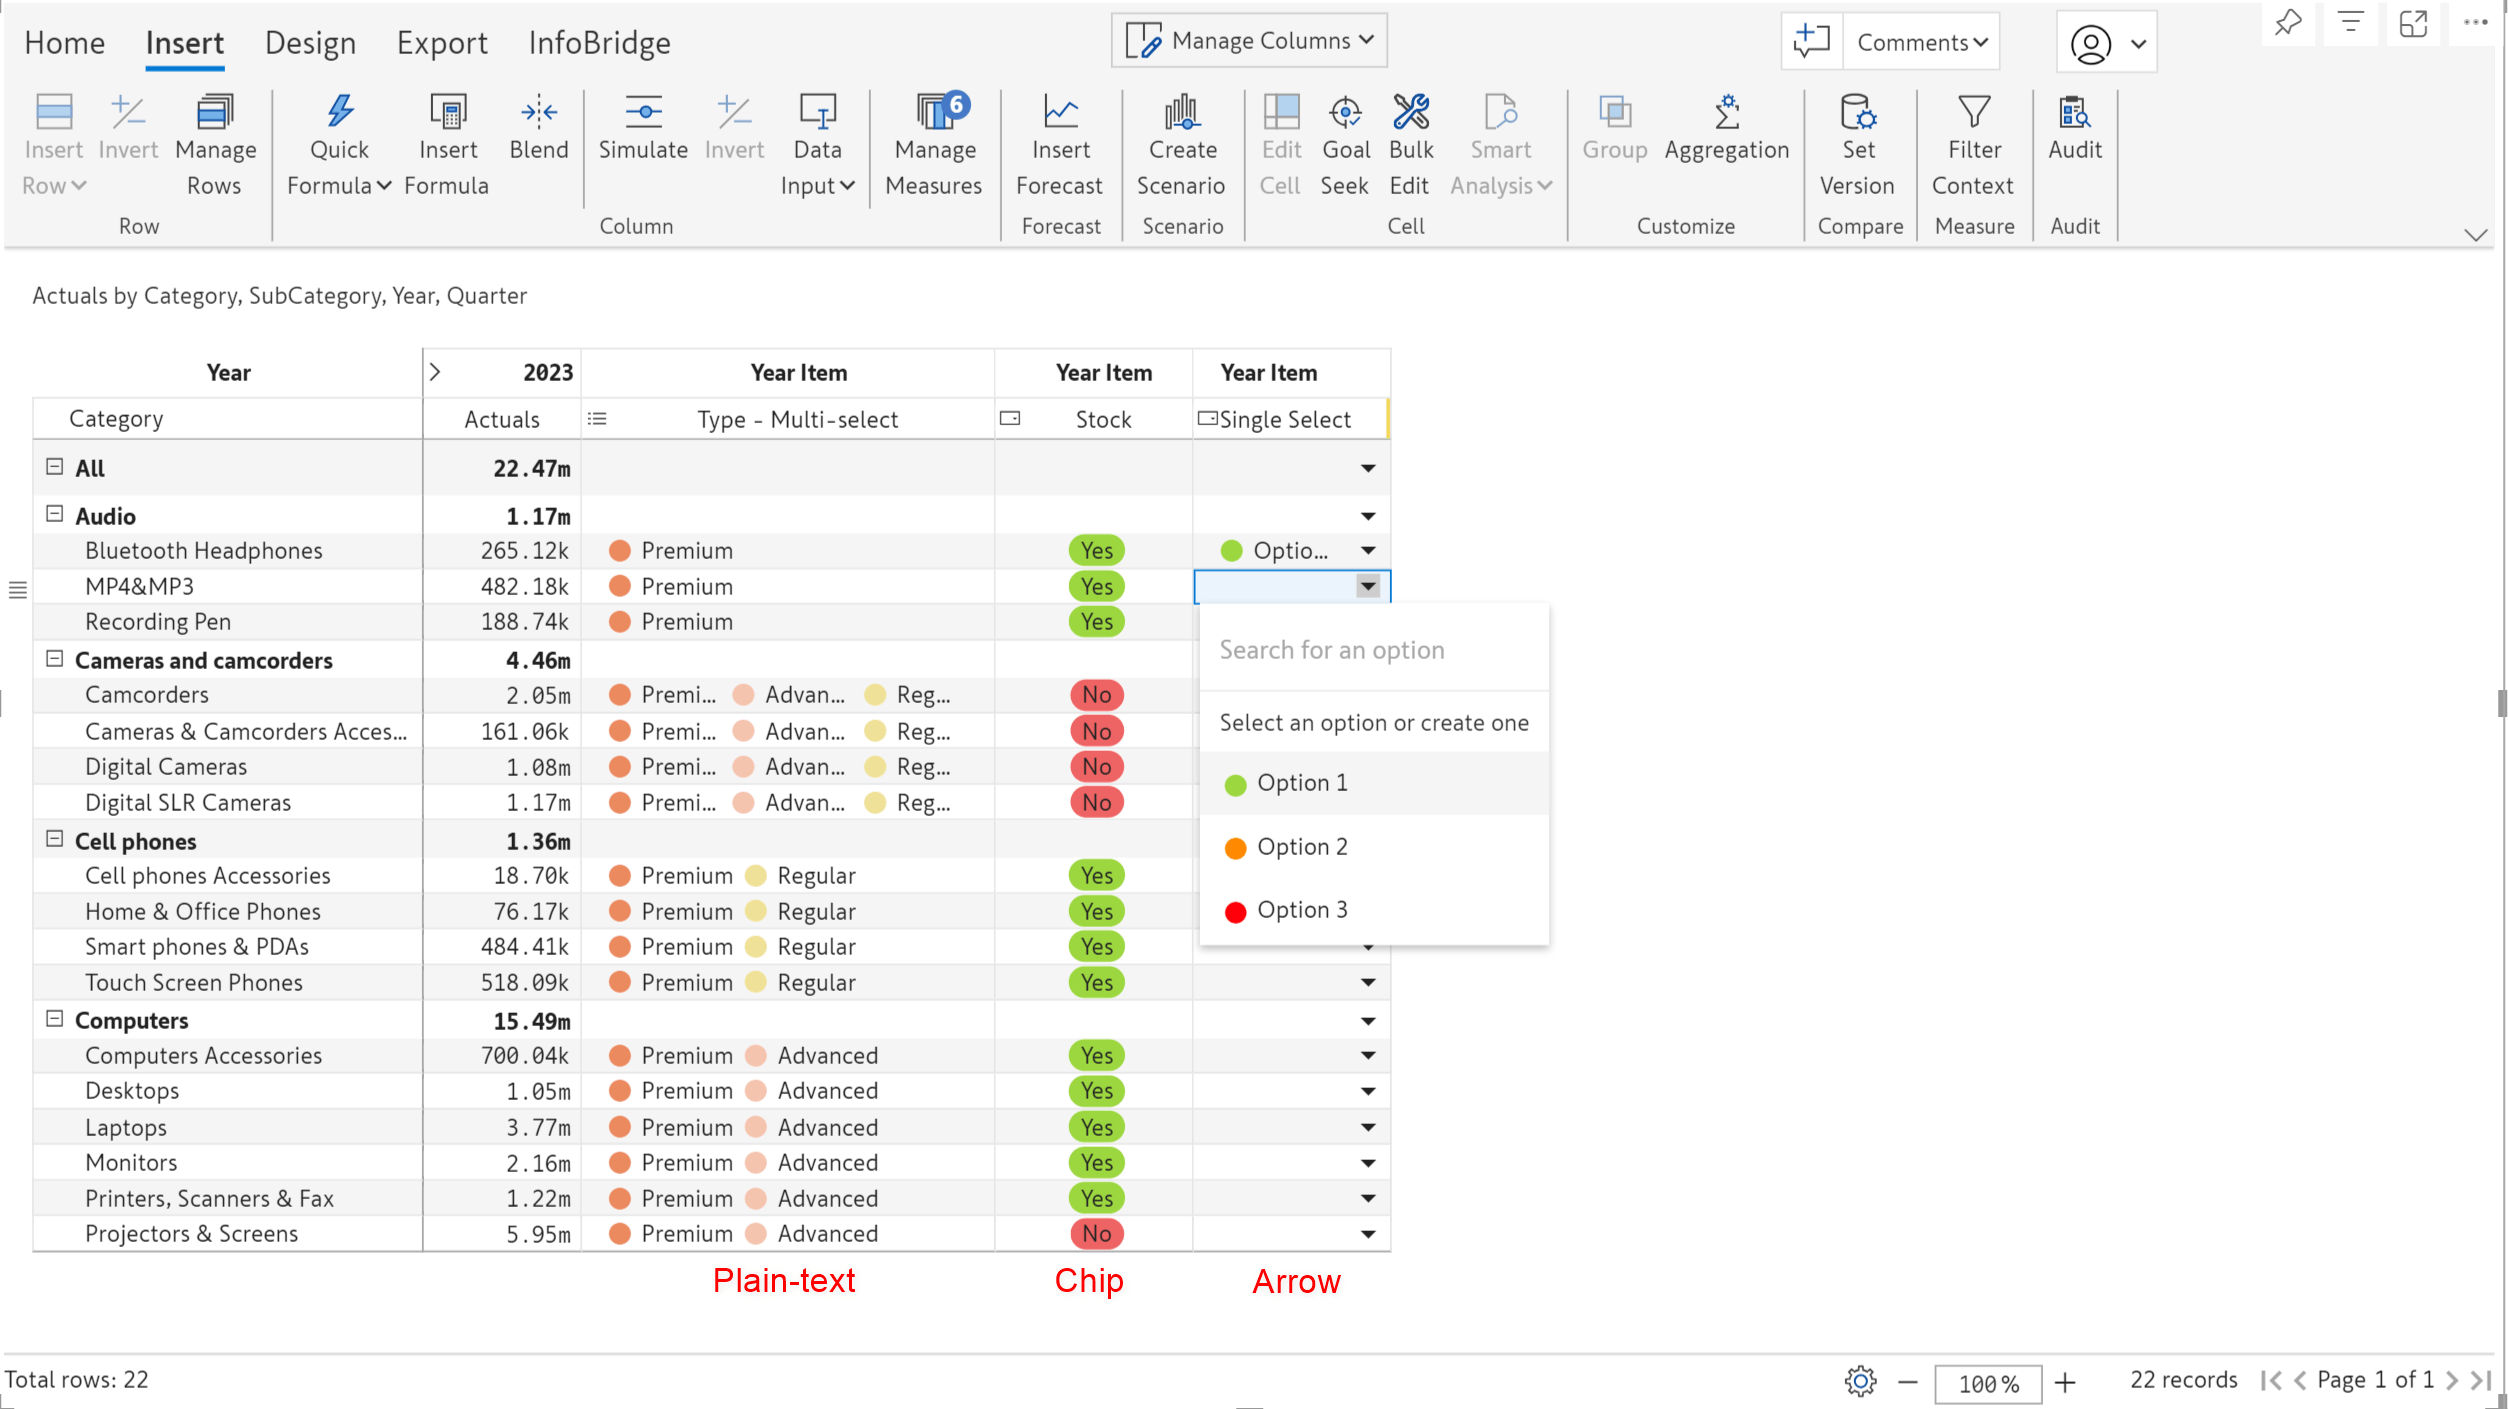
Select your desired display style for single and multi-select dropdowns: chip, arrow, or plain text. In the image below, we used the plain-text style for the multi-select dropdown, whereas, for the single-select, we’ve used the chip and arrow styles.
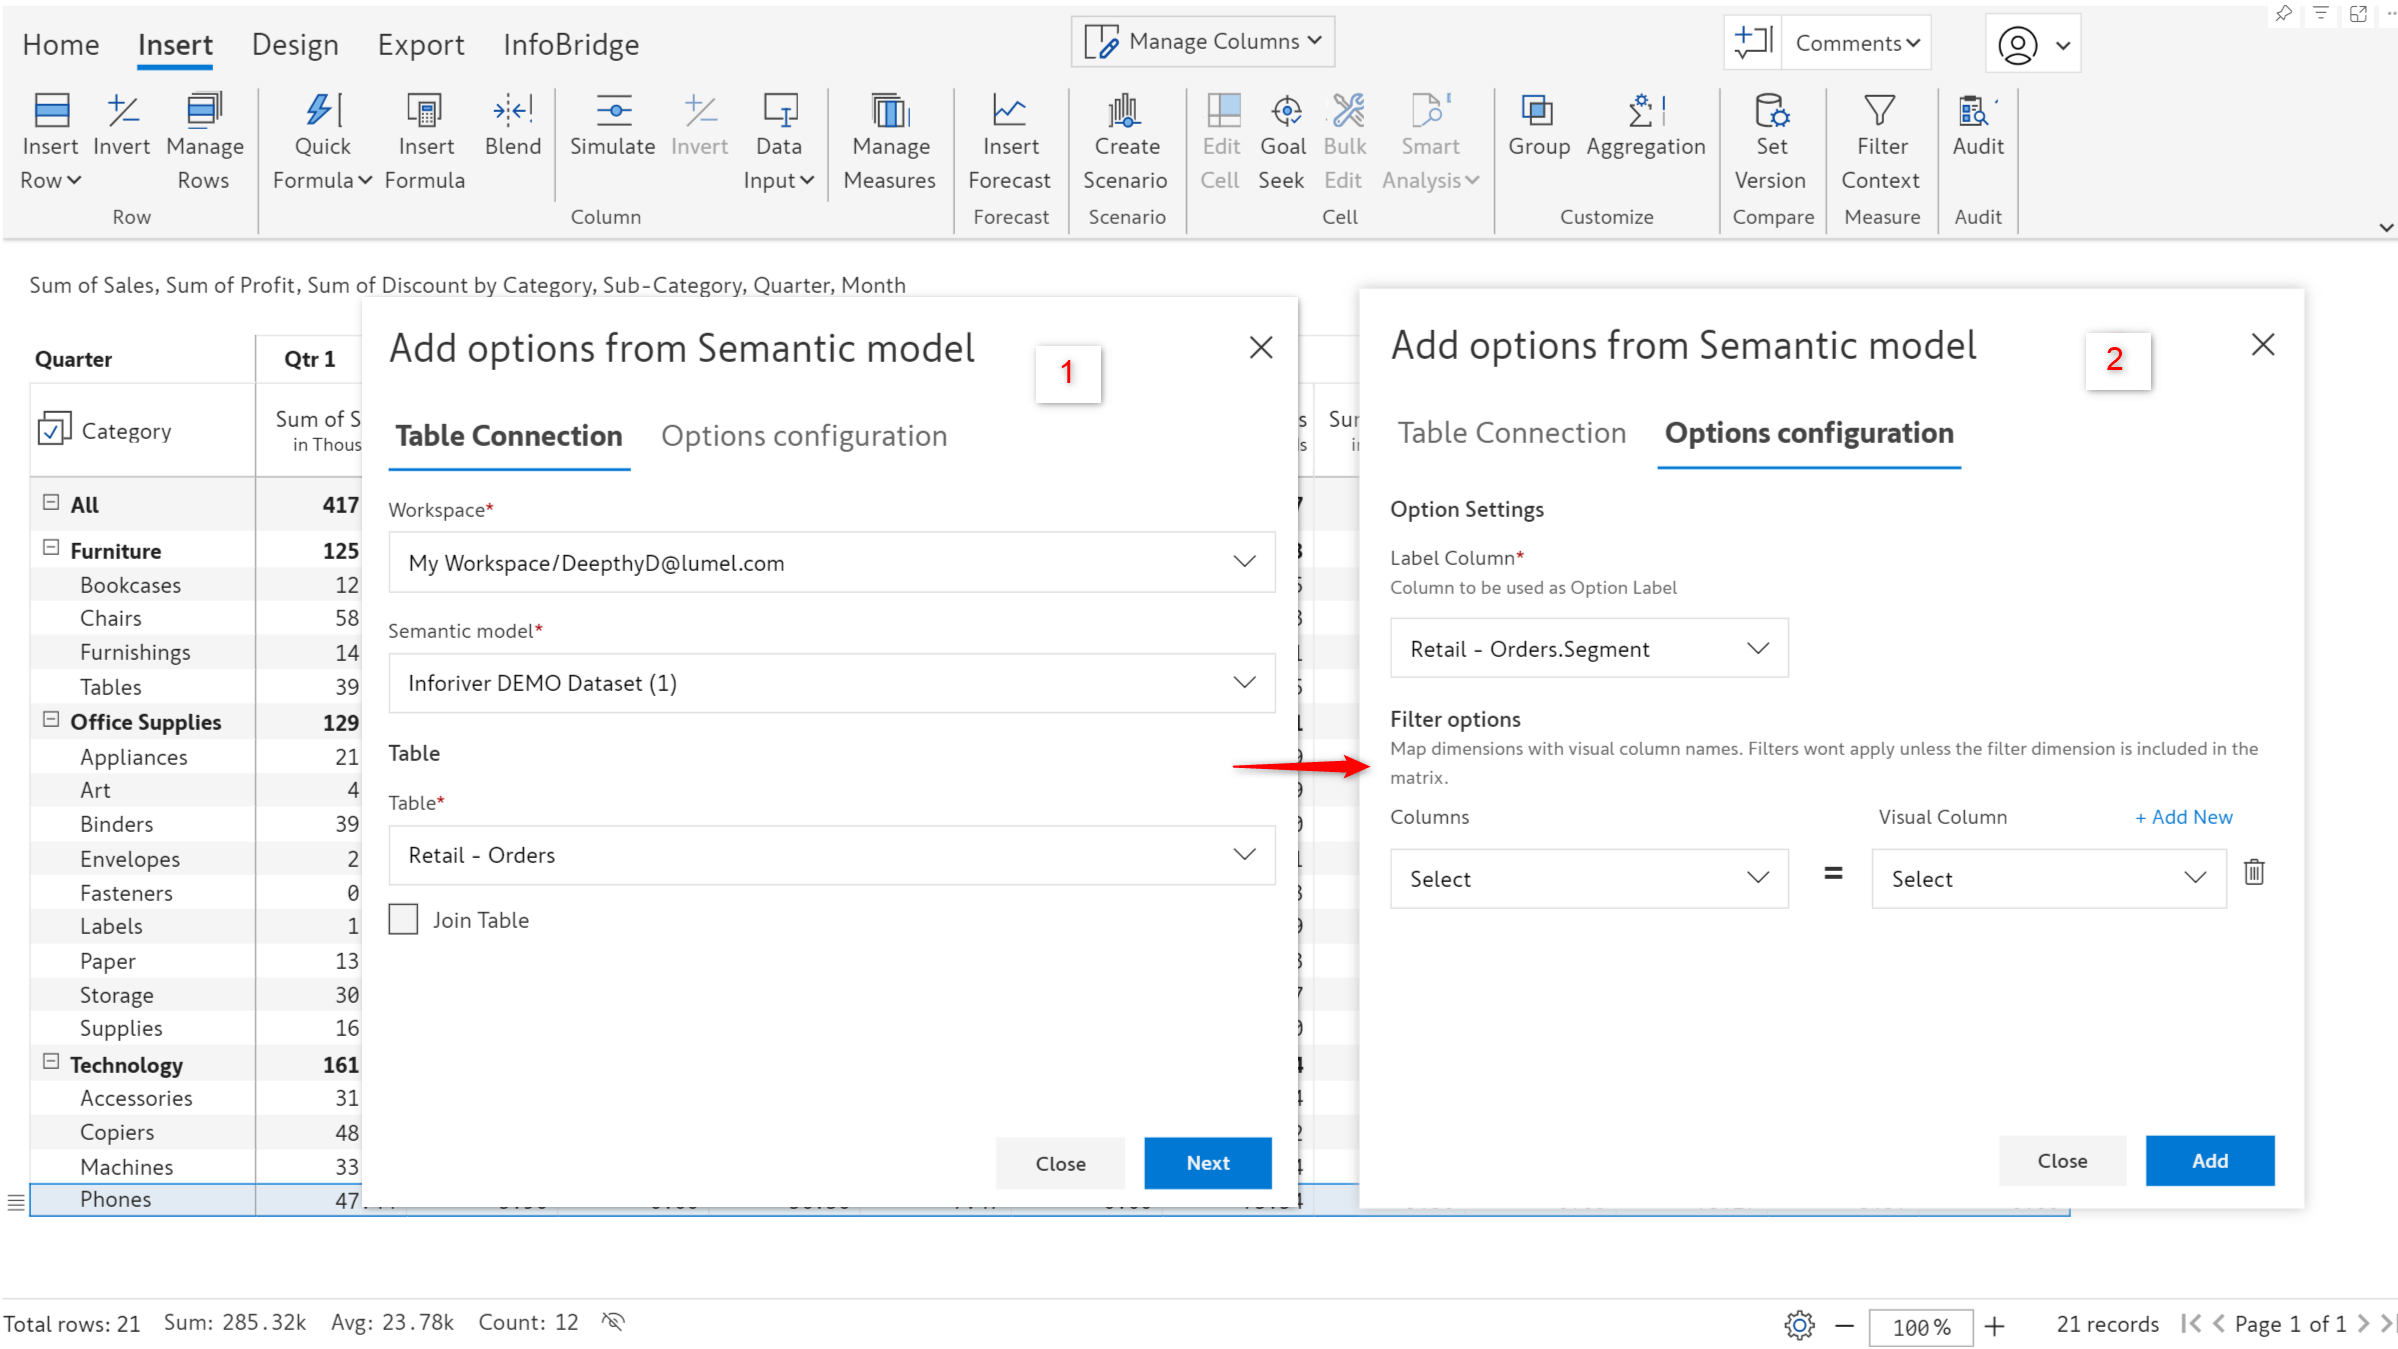
In the June release, we launched the robust Insert row feature, which allows you to create visual hierarchies or source row categories from Excel files. In the latest version, we’ve integrated semantic models and you’ll be able to add row categories from your semantic models.
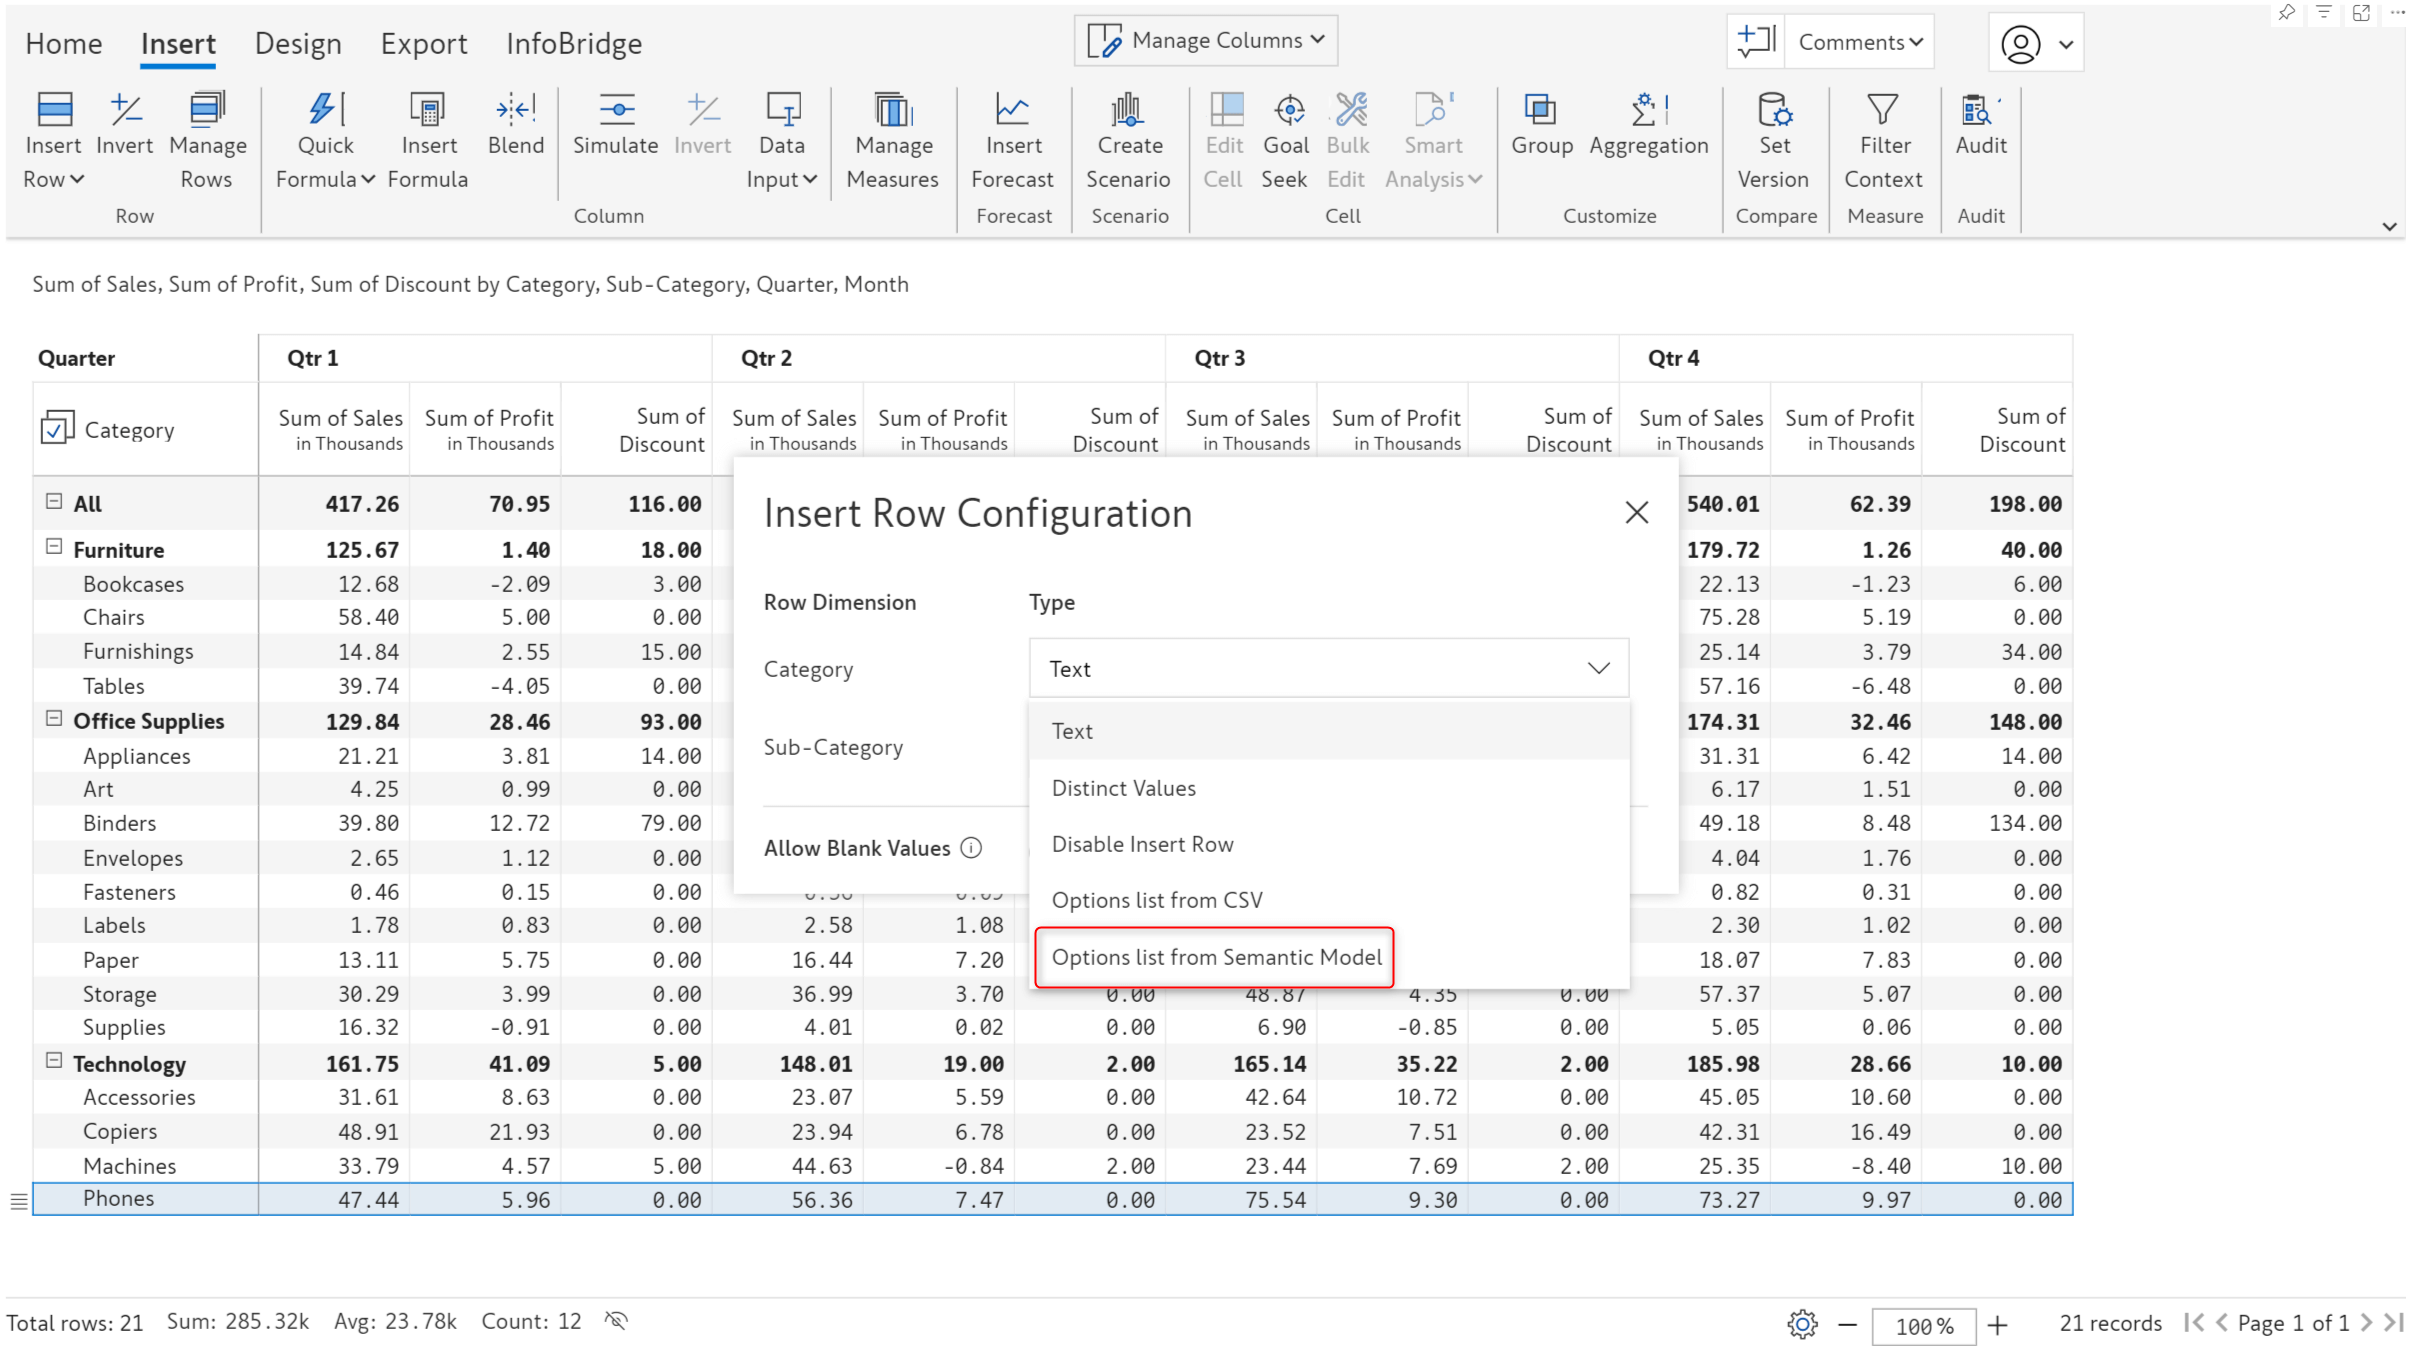
You would already know the interface for pulling single and multi-select options from the semantic model. The interface for inserting row categories has been built along the same lines.
You need to enter the workspace, table, and field name. You can optionally specify a join to pull categories from another table. You can also specify a filter if hierarchical data is involved, and you want to maintain the same structure in your reports.
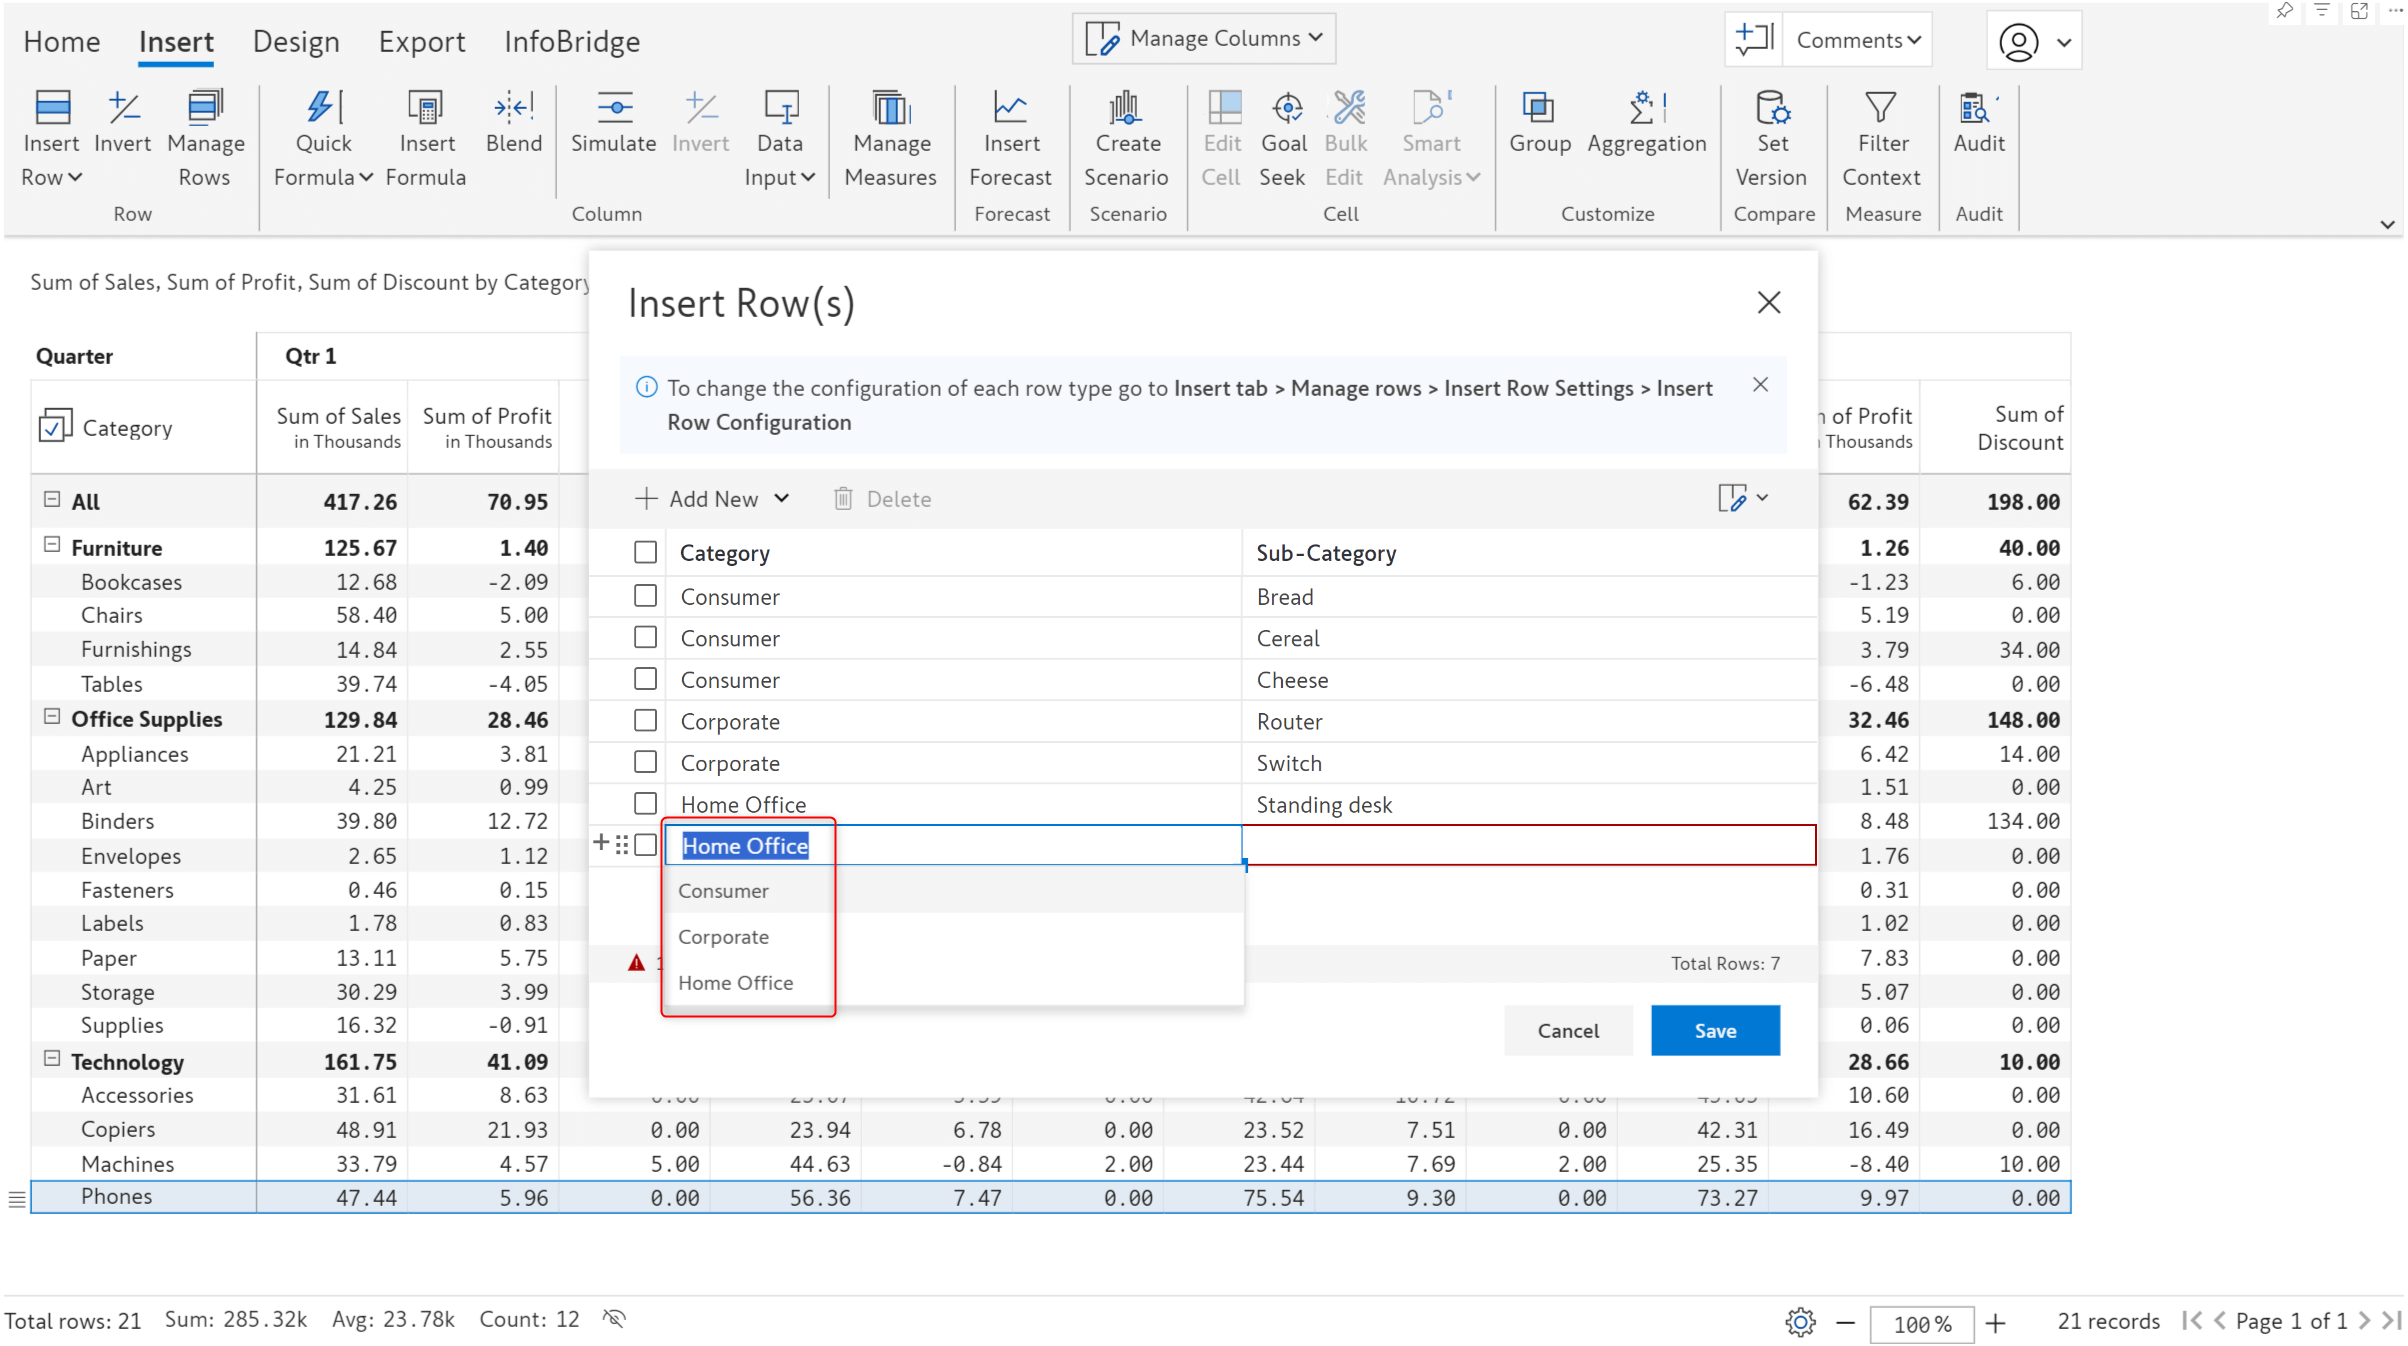
You can select the categories from the semantic model in the Insert Rows window.
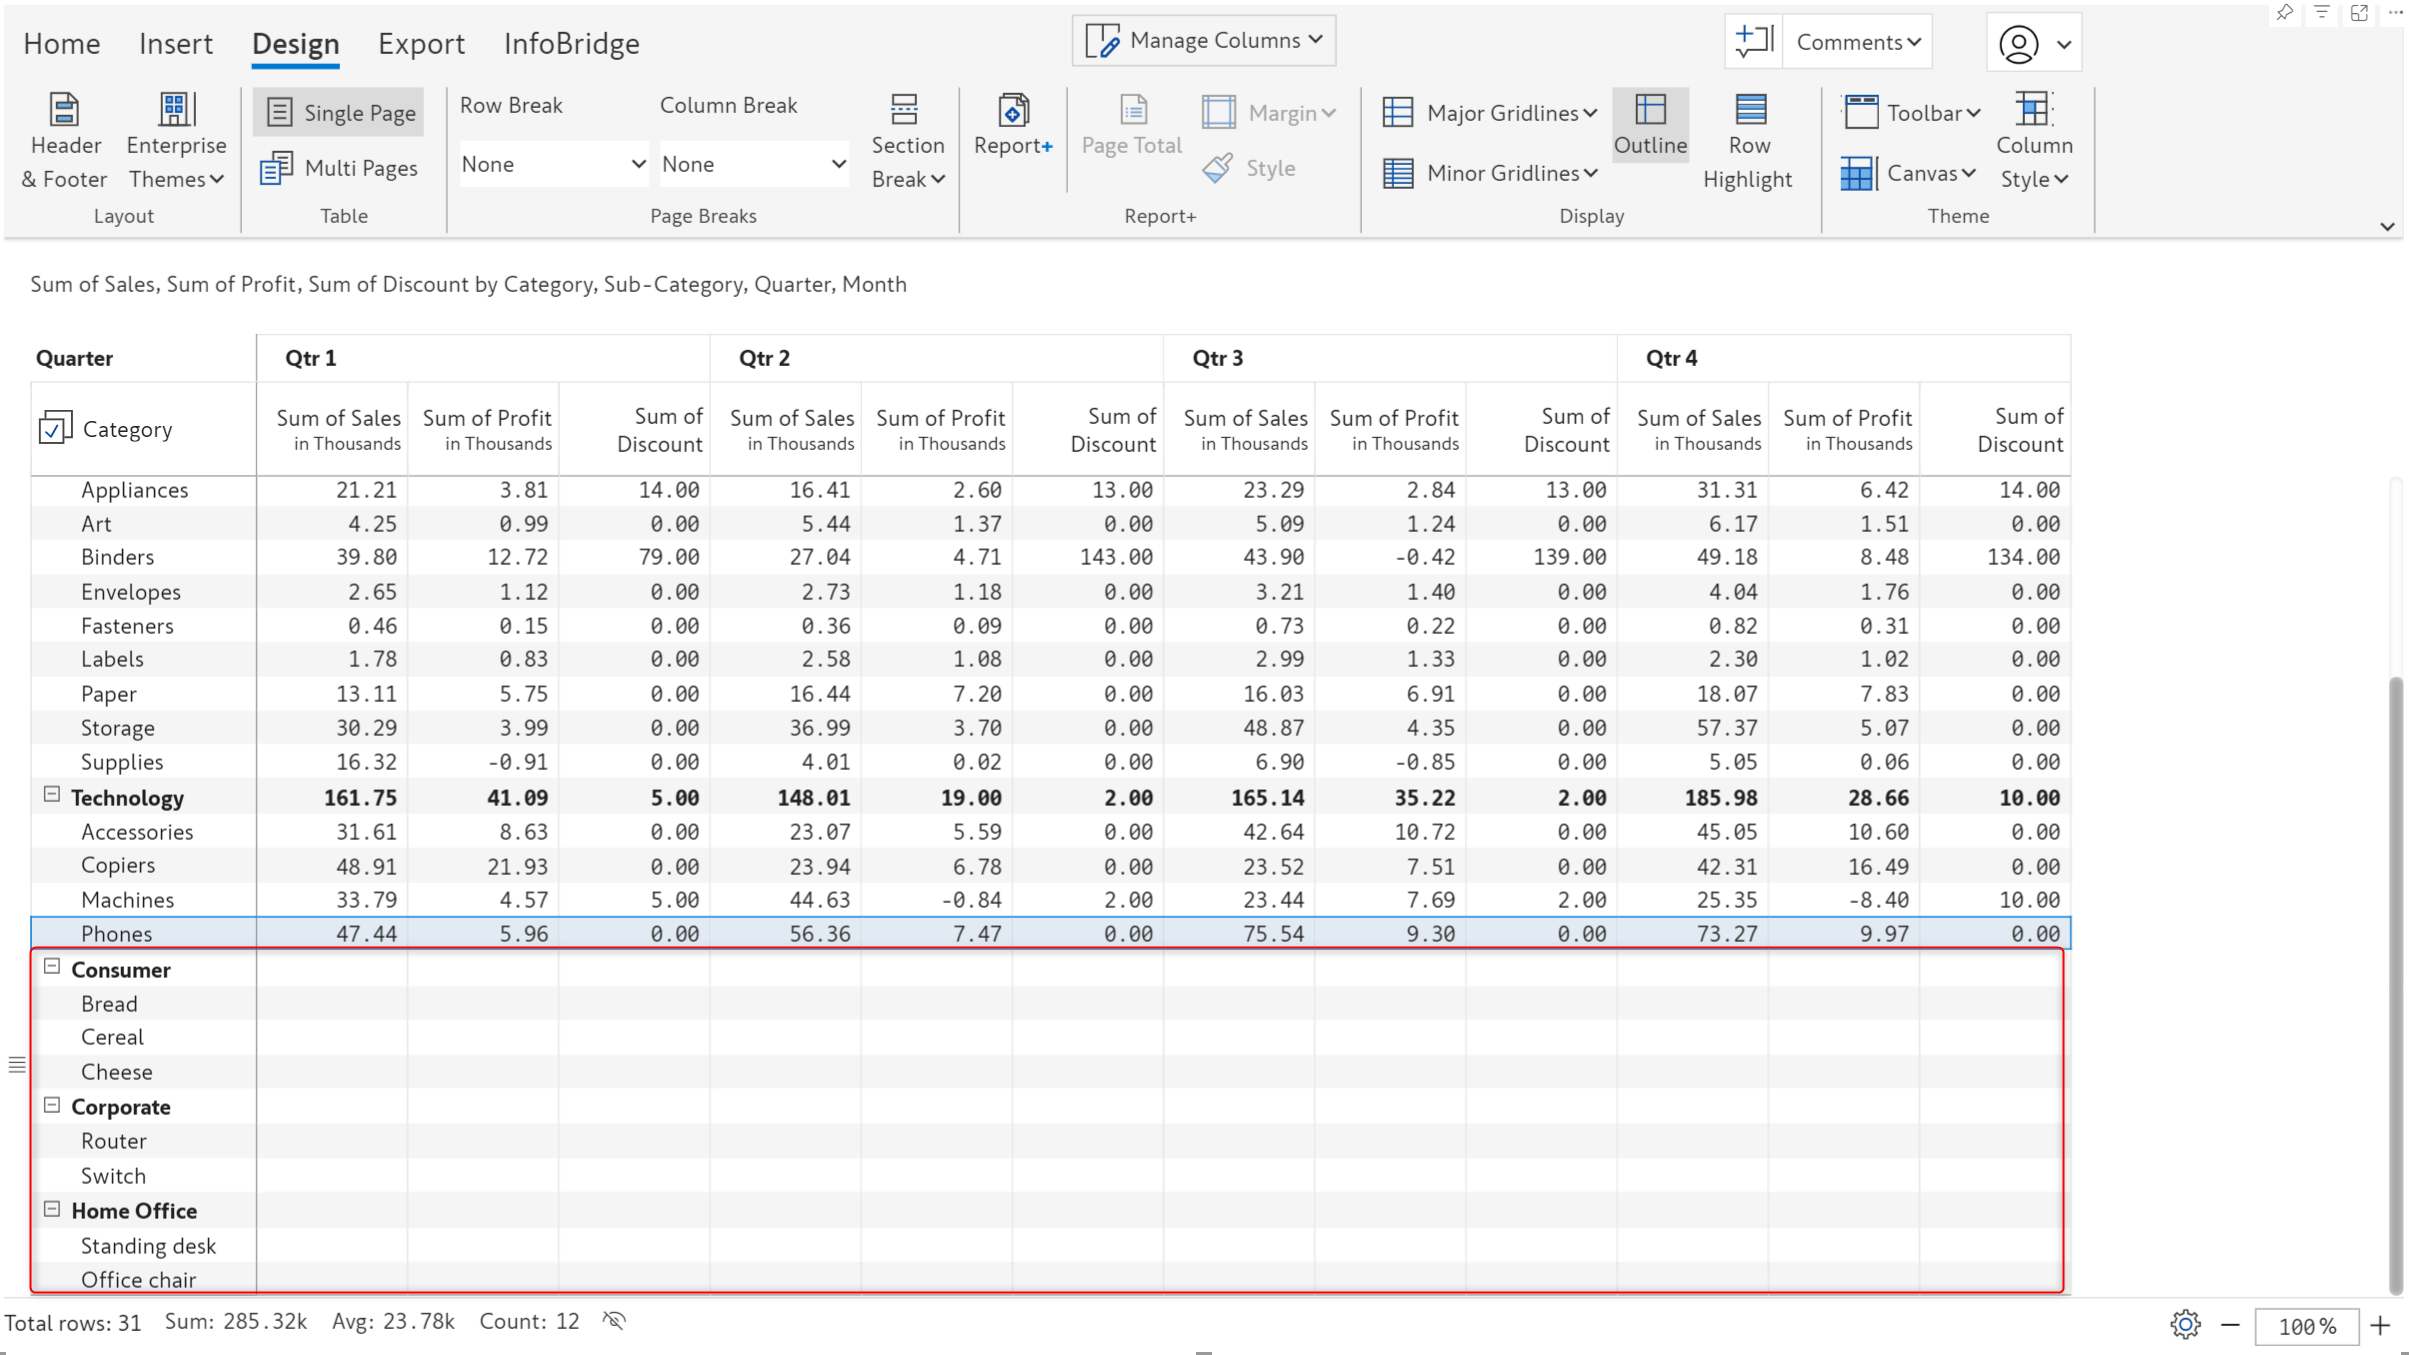
Rows inserted from the semantic model:
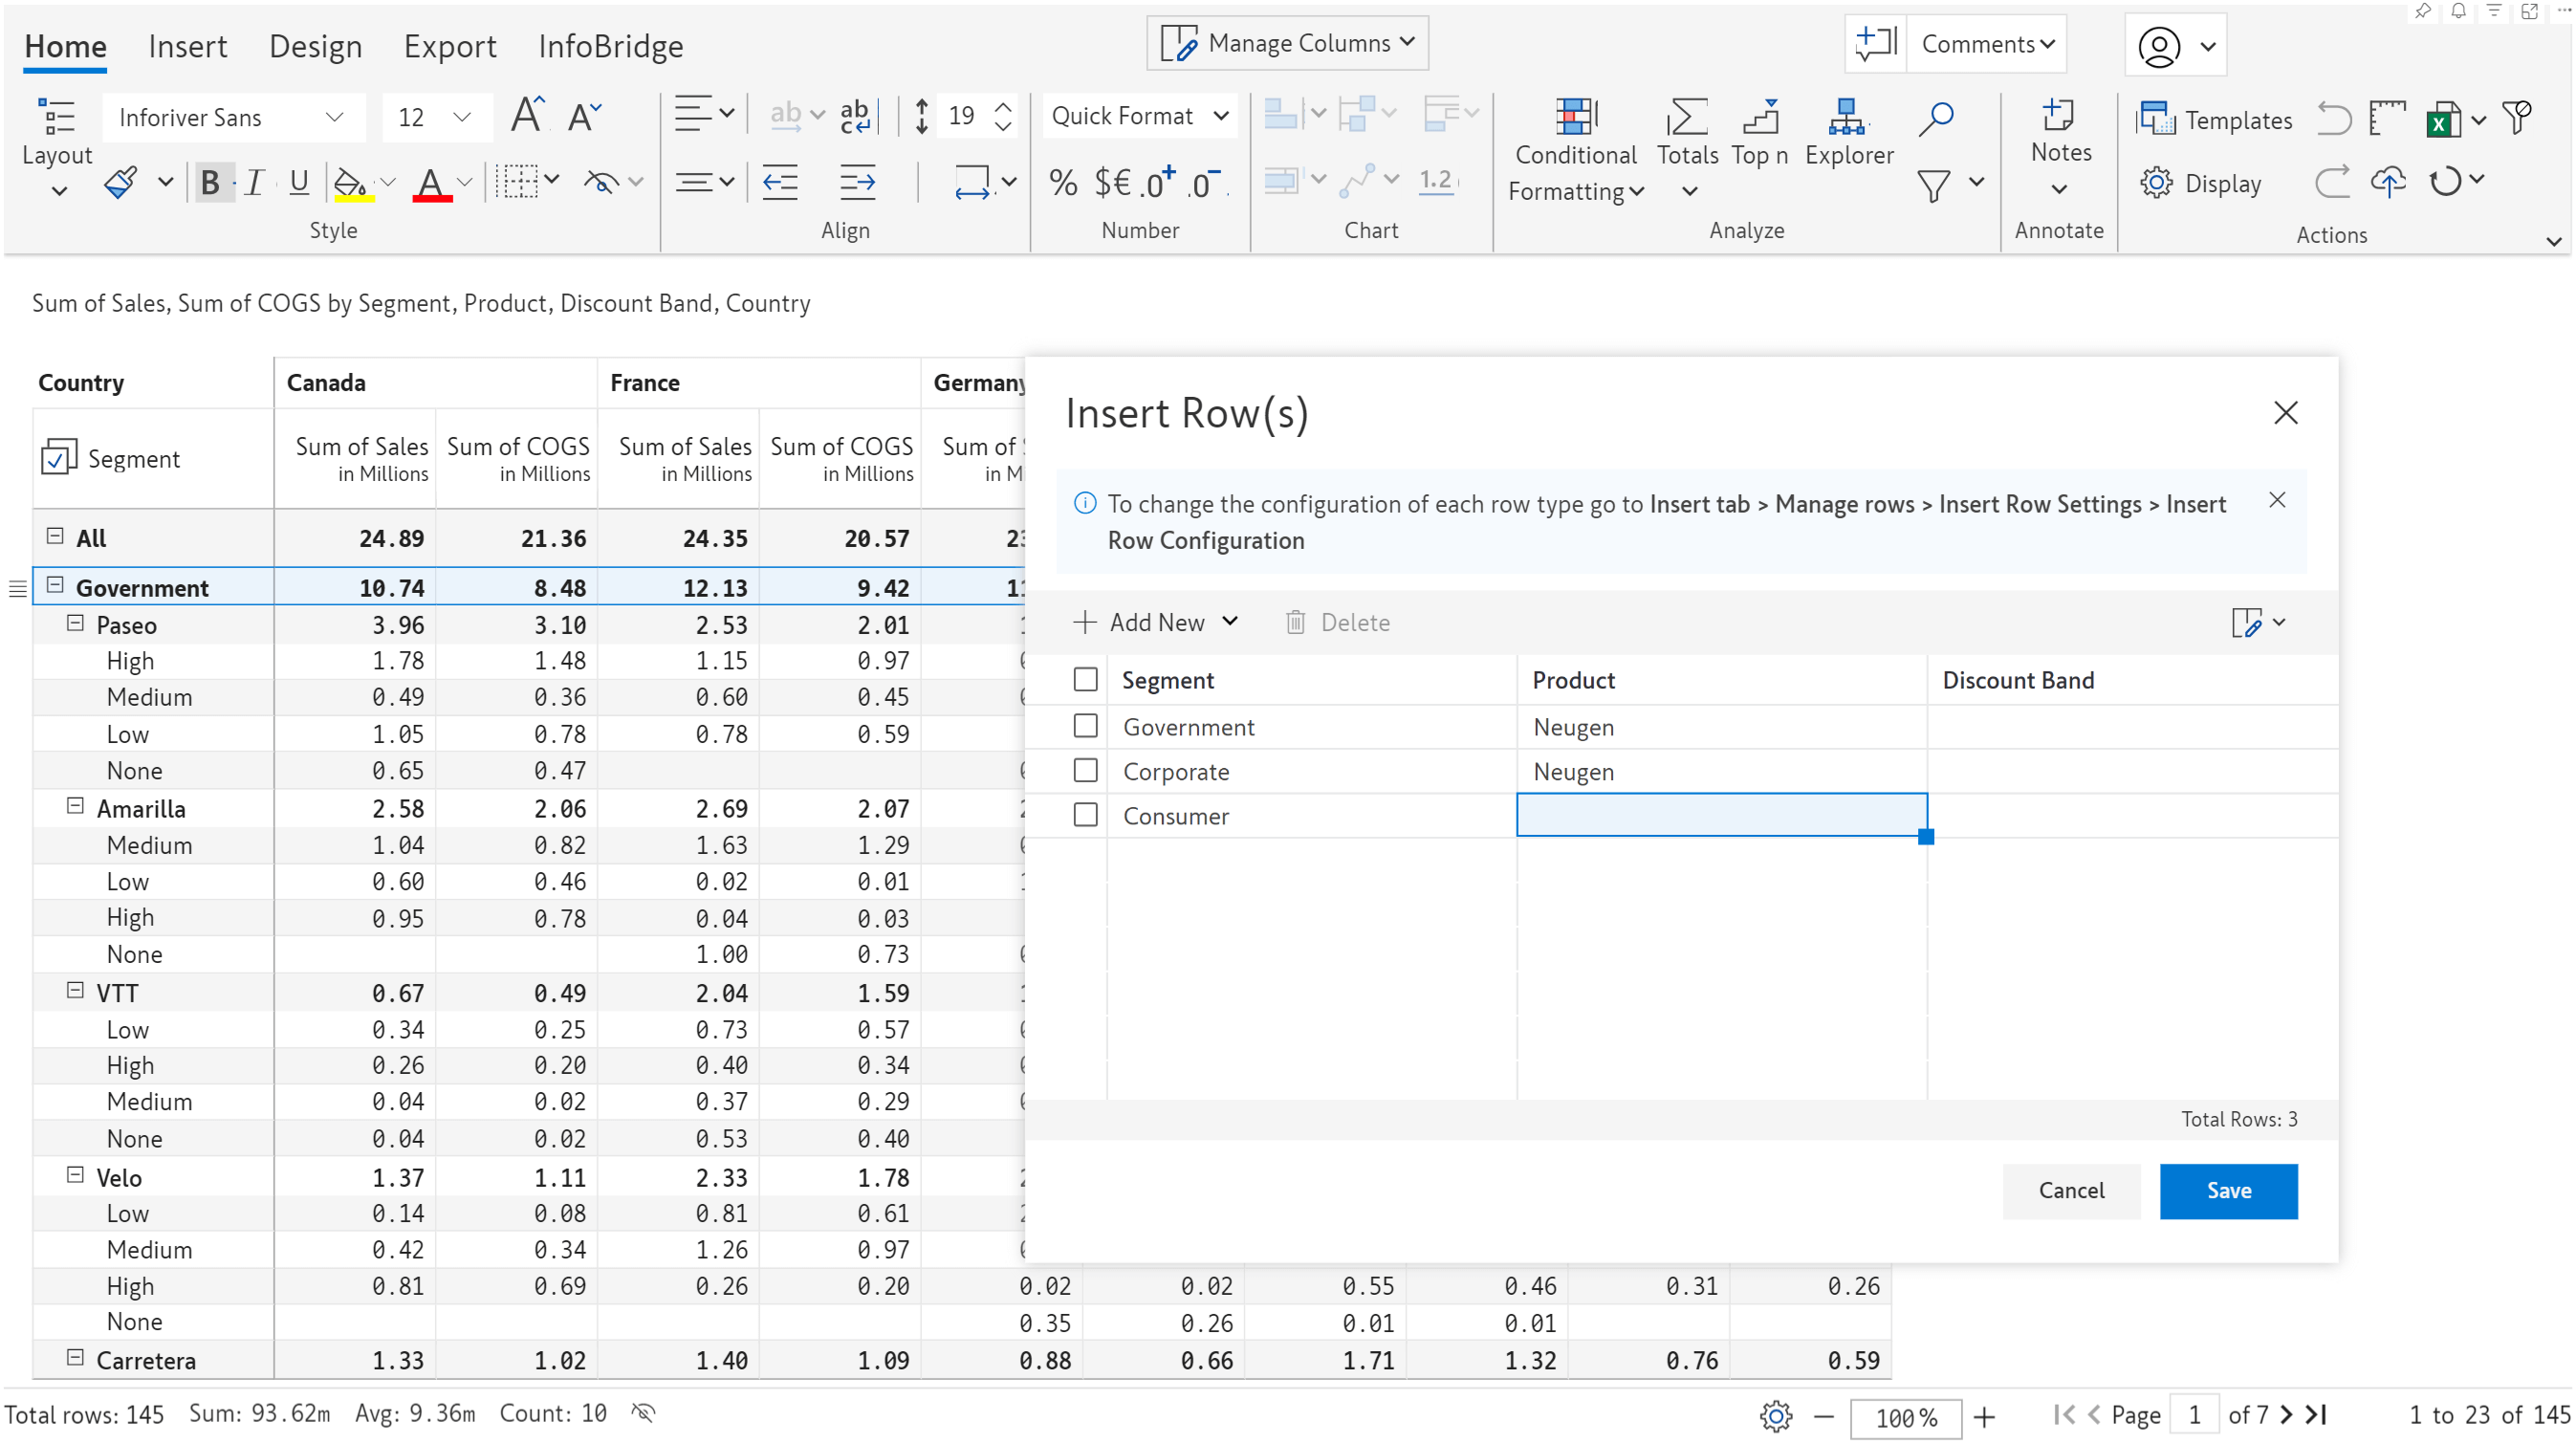
Inforiver has been designed to provide extensive support for hierarchical data. When manually creating row hierarchies, you can enable the Allow Blank Values toggle if you expect blank row categories in the leaf nodes. Please be mindful that you cannot create blank parent nodes for child nodes that are not blank.
Notice that the Corporate segment has only one product and does not have any discount bands under it. Similarly, the Consumer segment does not have any products or discount bands tagged to it as the row categories were left blank while inserting rows.
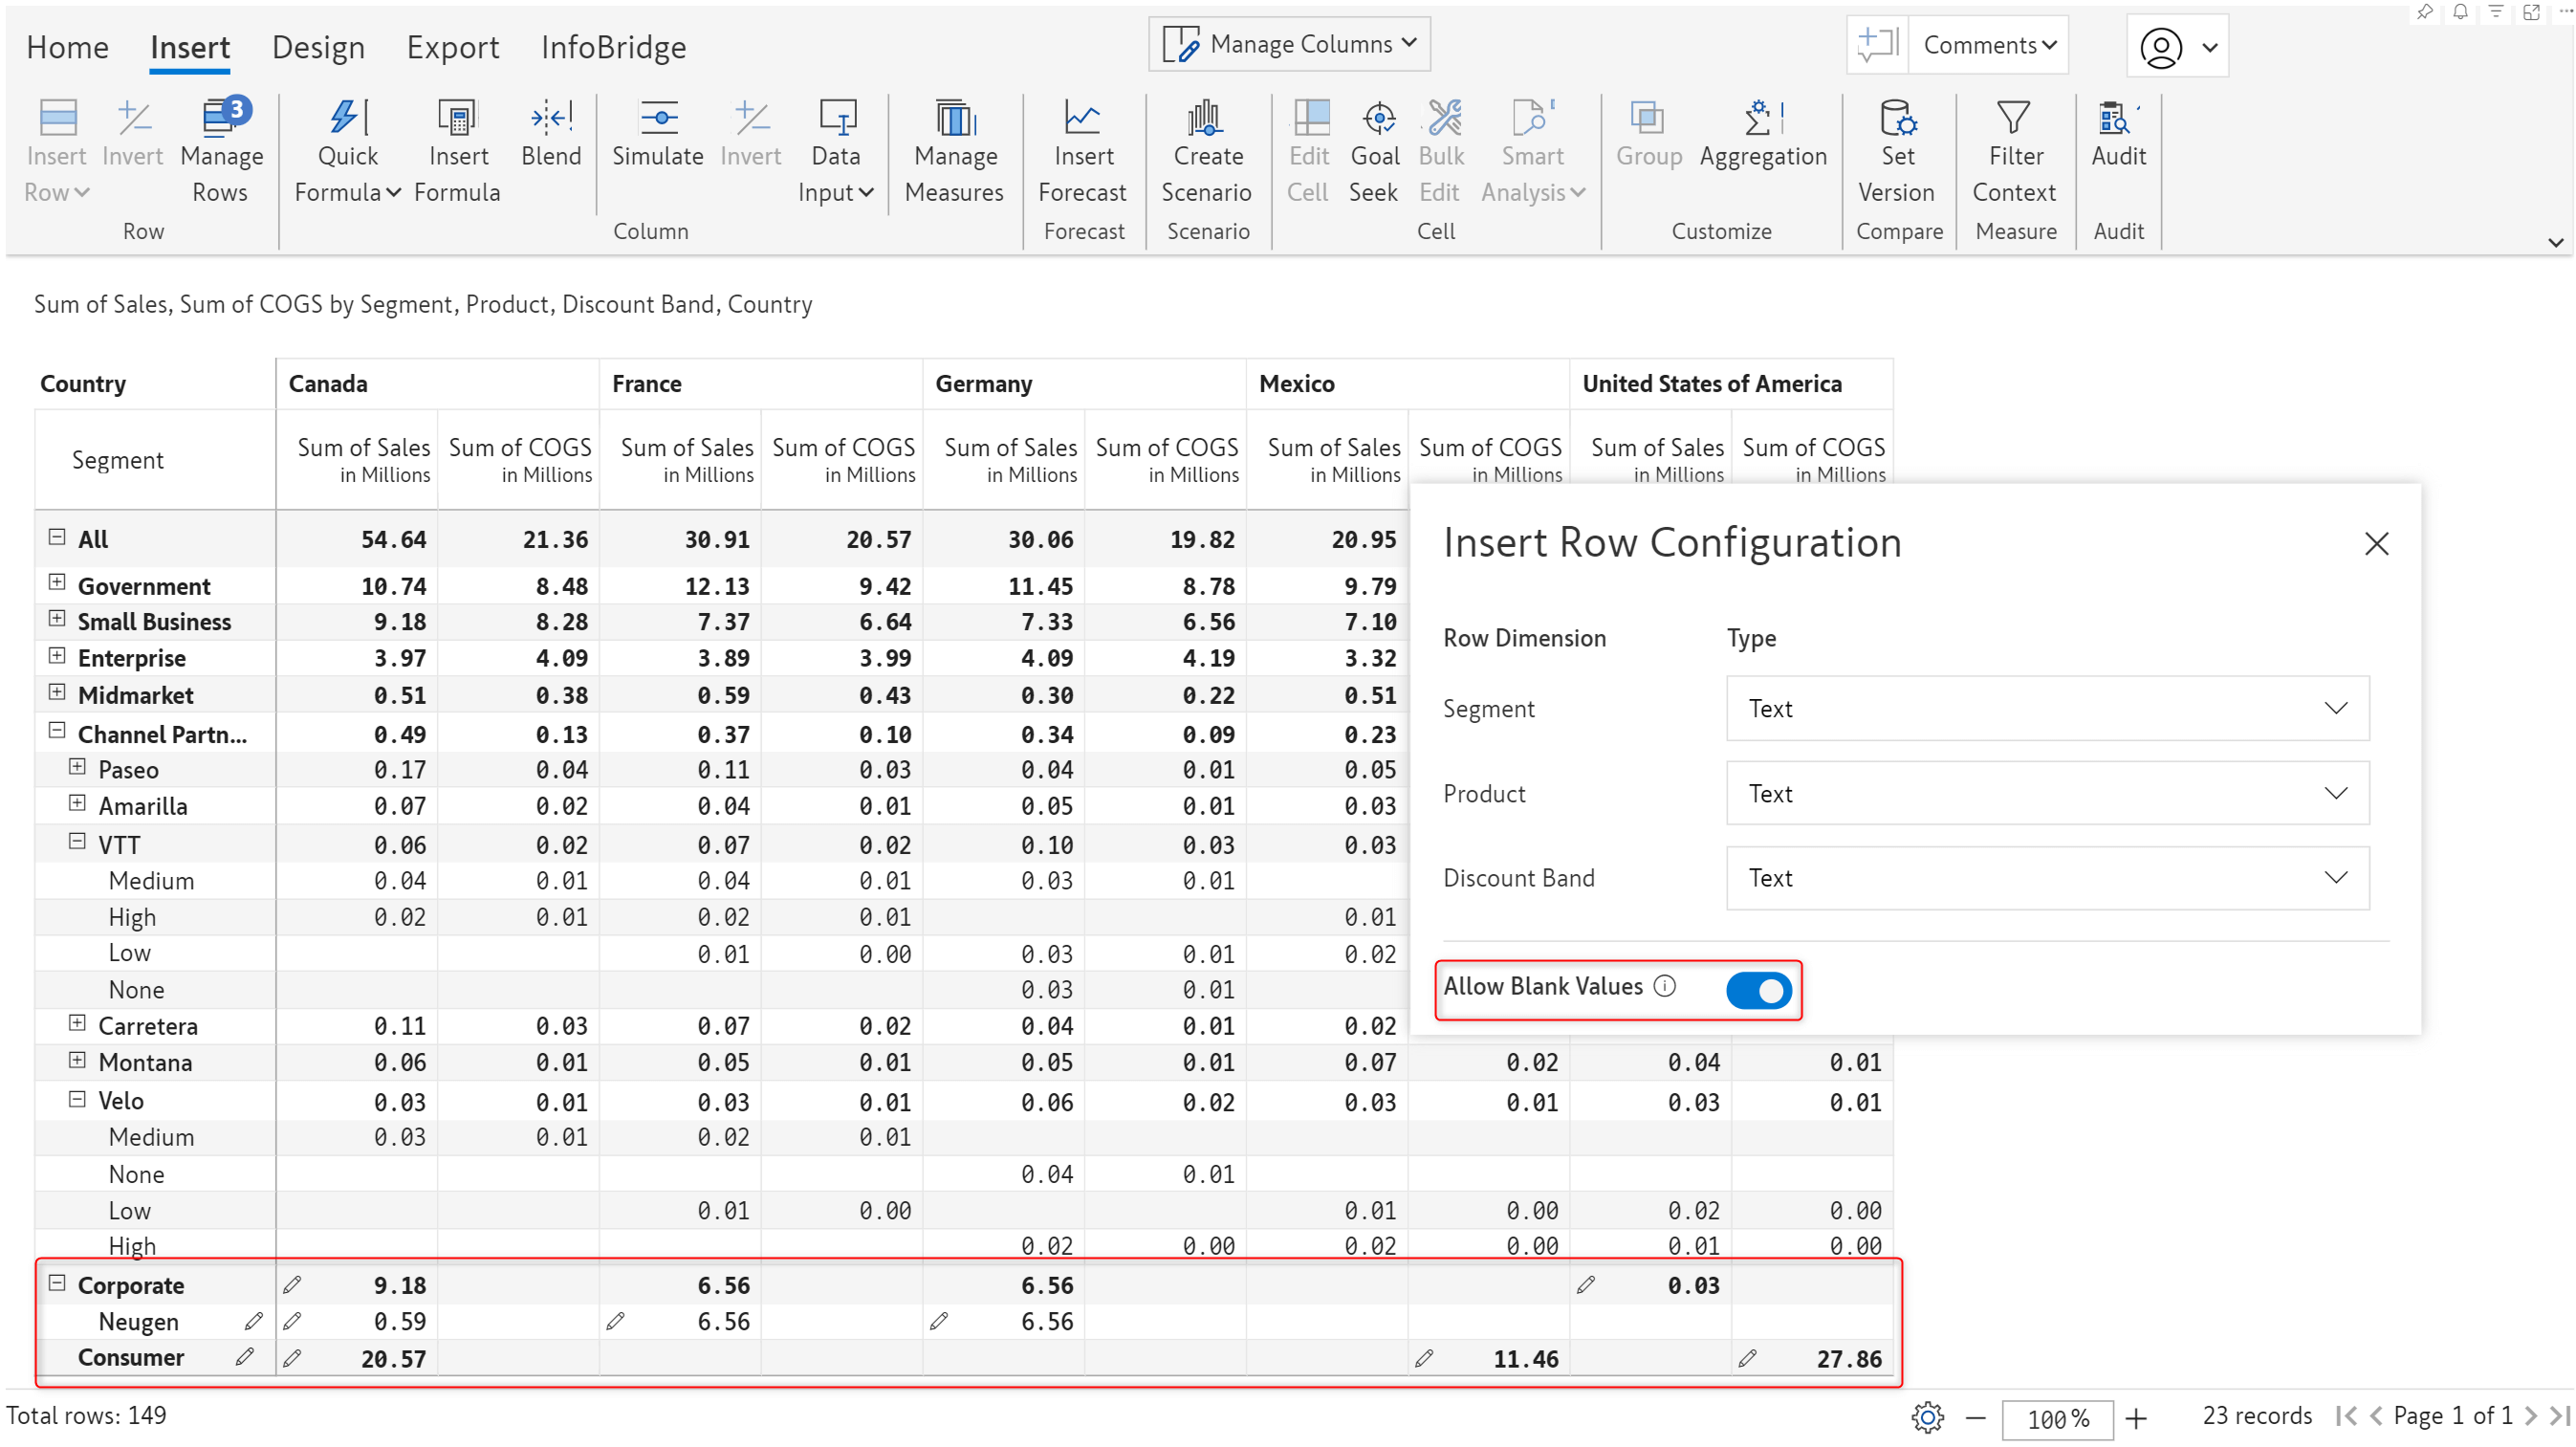
In the previous version, blank categories would be highlighted in a red error box and Inforiver would prevent you from inserting rows.
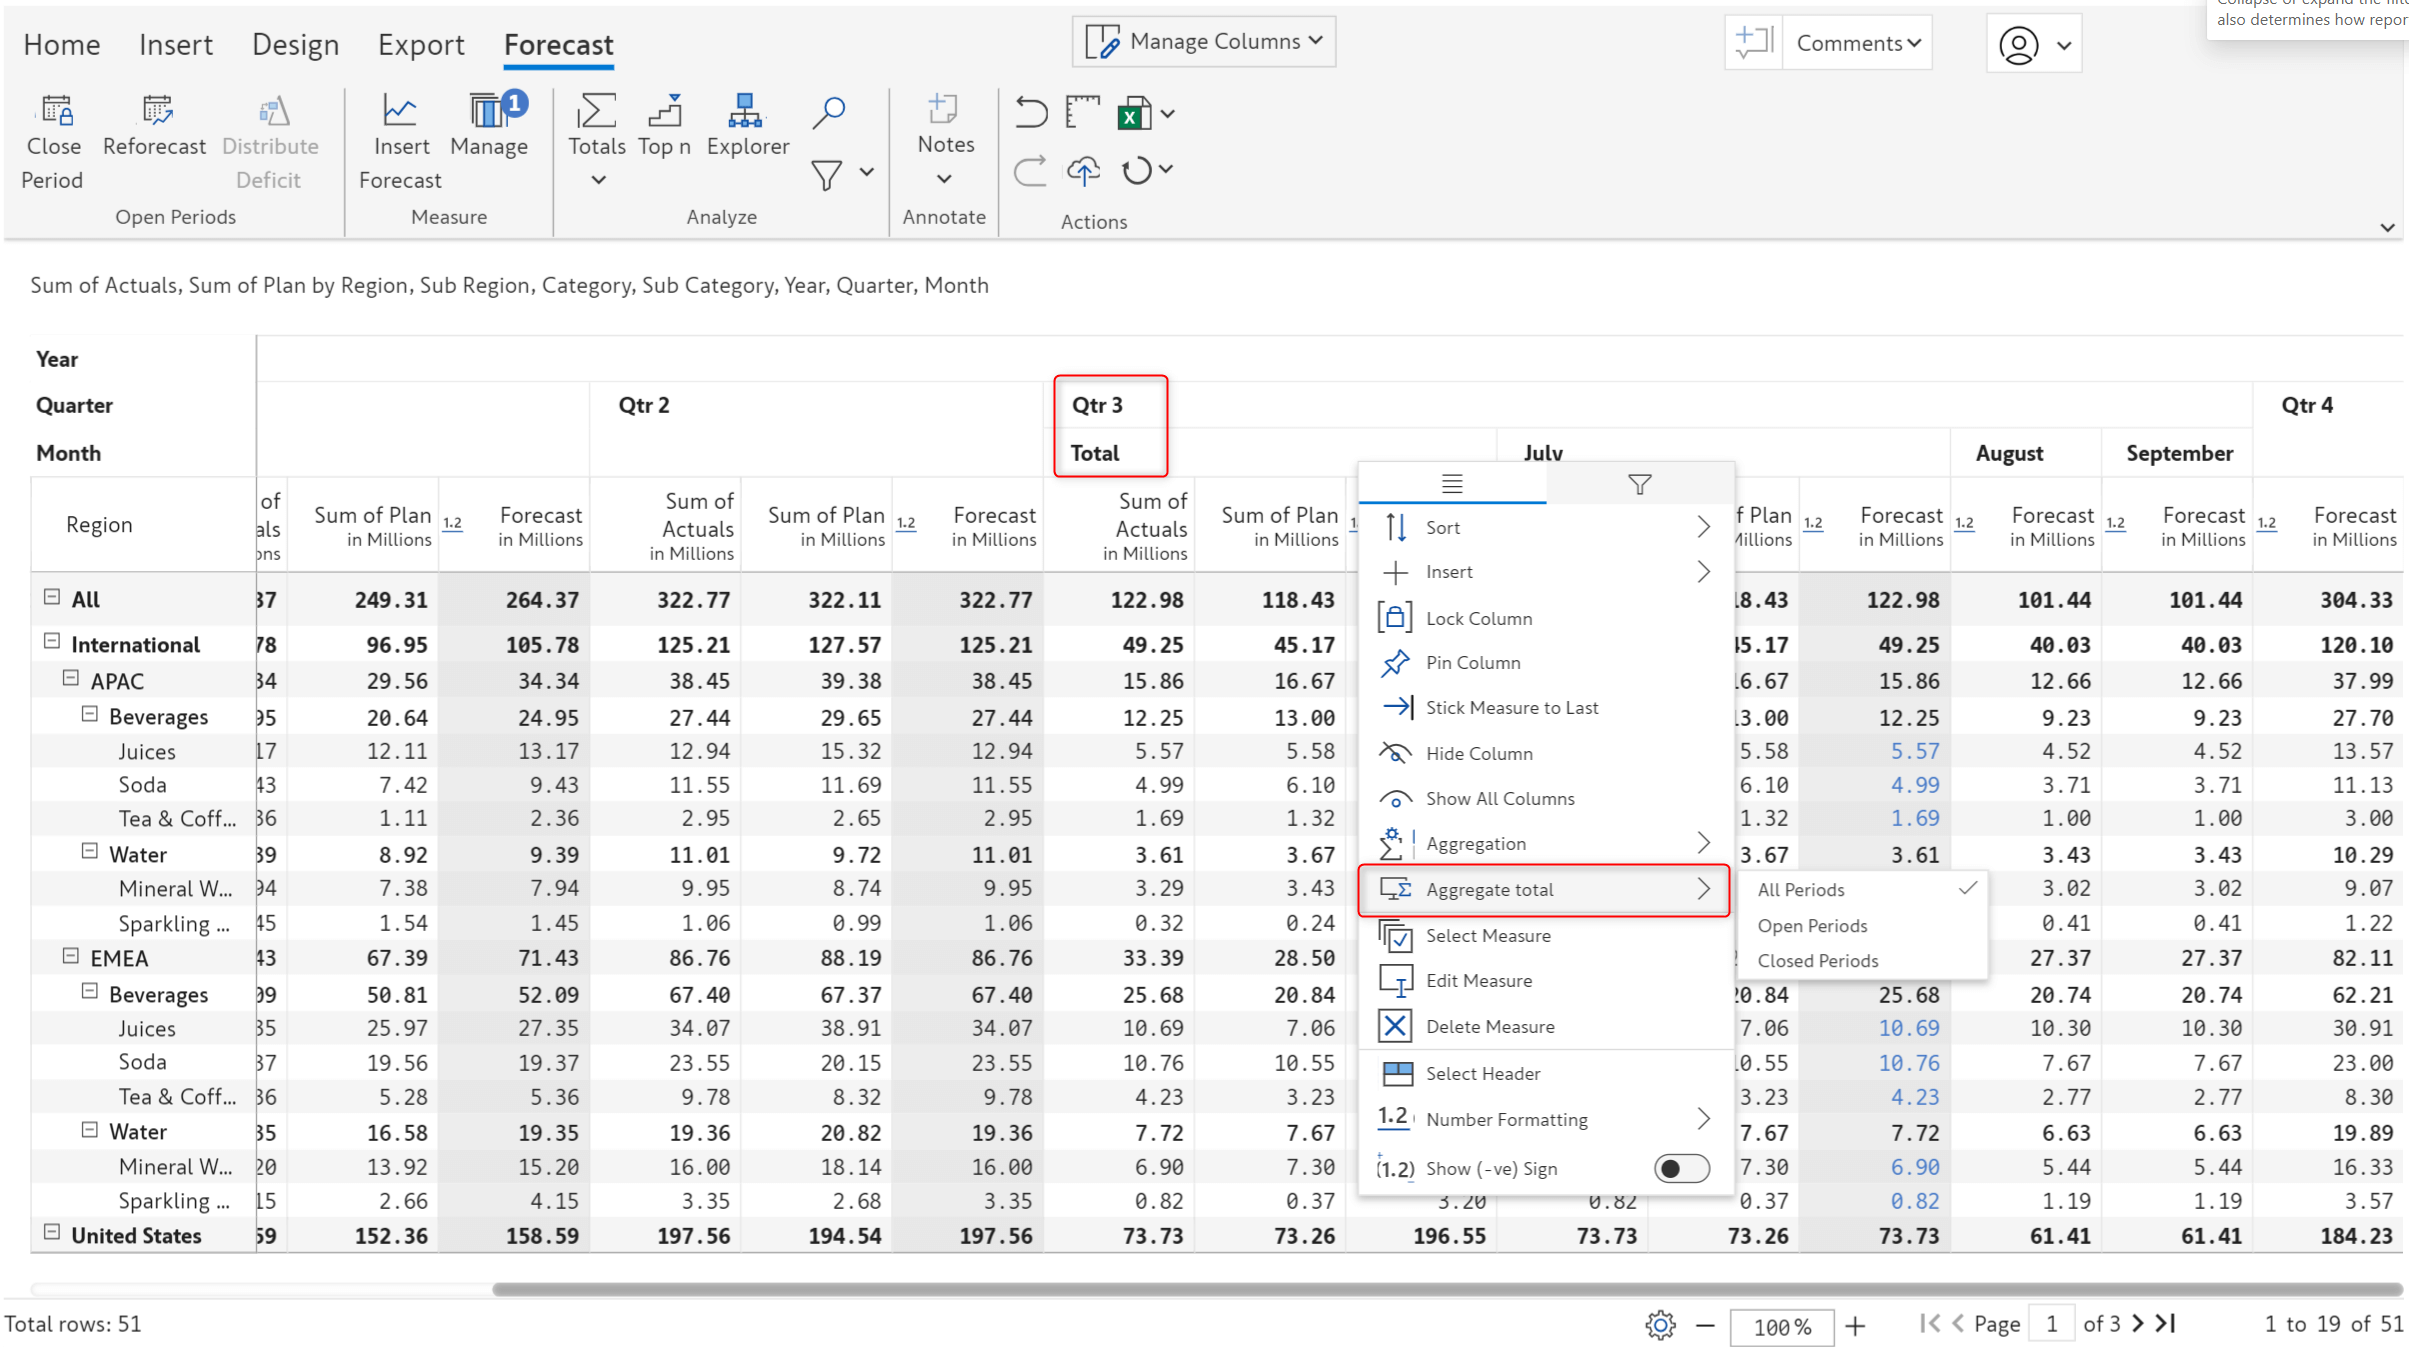
When you generate forecasts with Inforiver, you can determine whether the grand total forecast should be based on closed periods, open forecasts, or both.
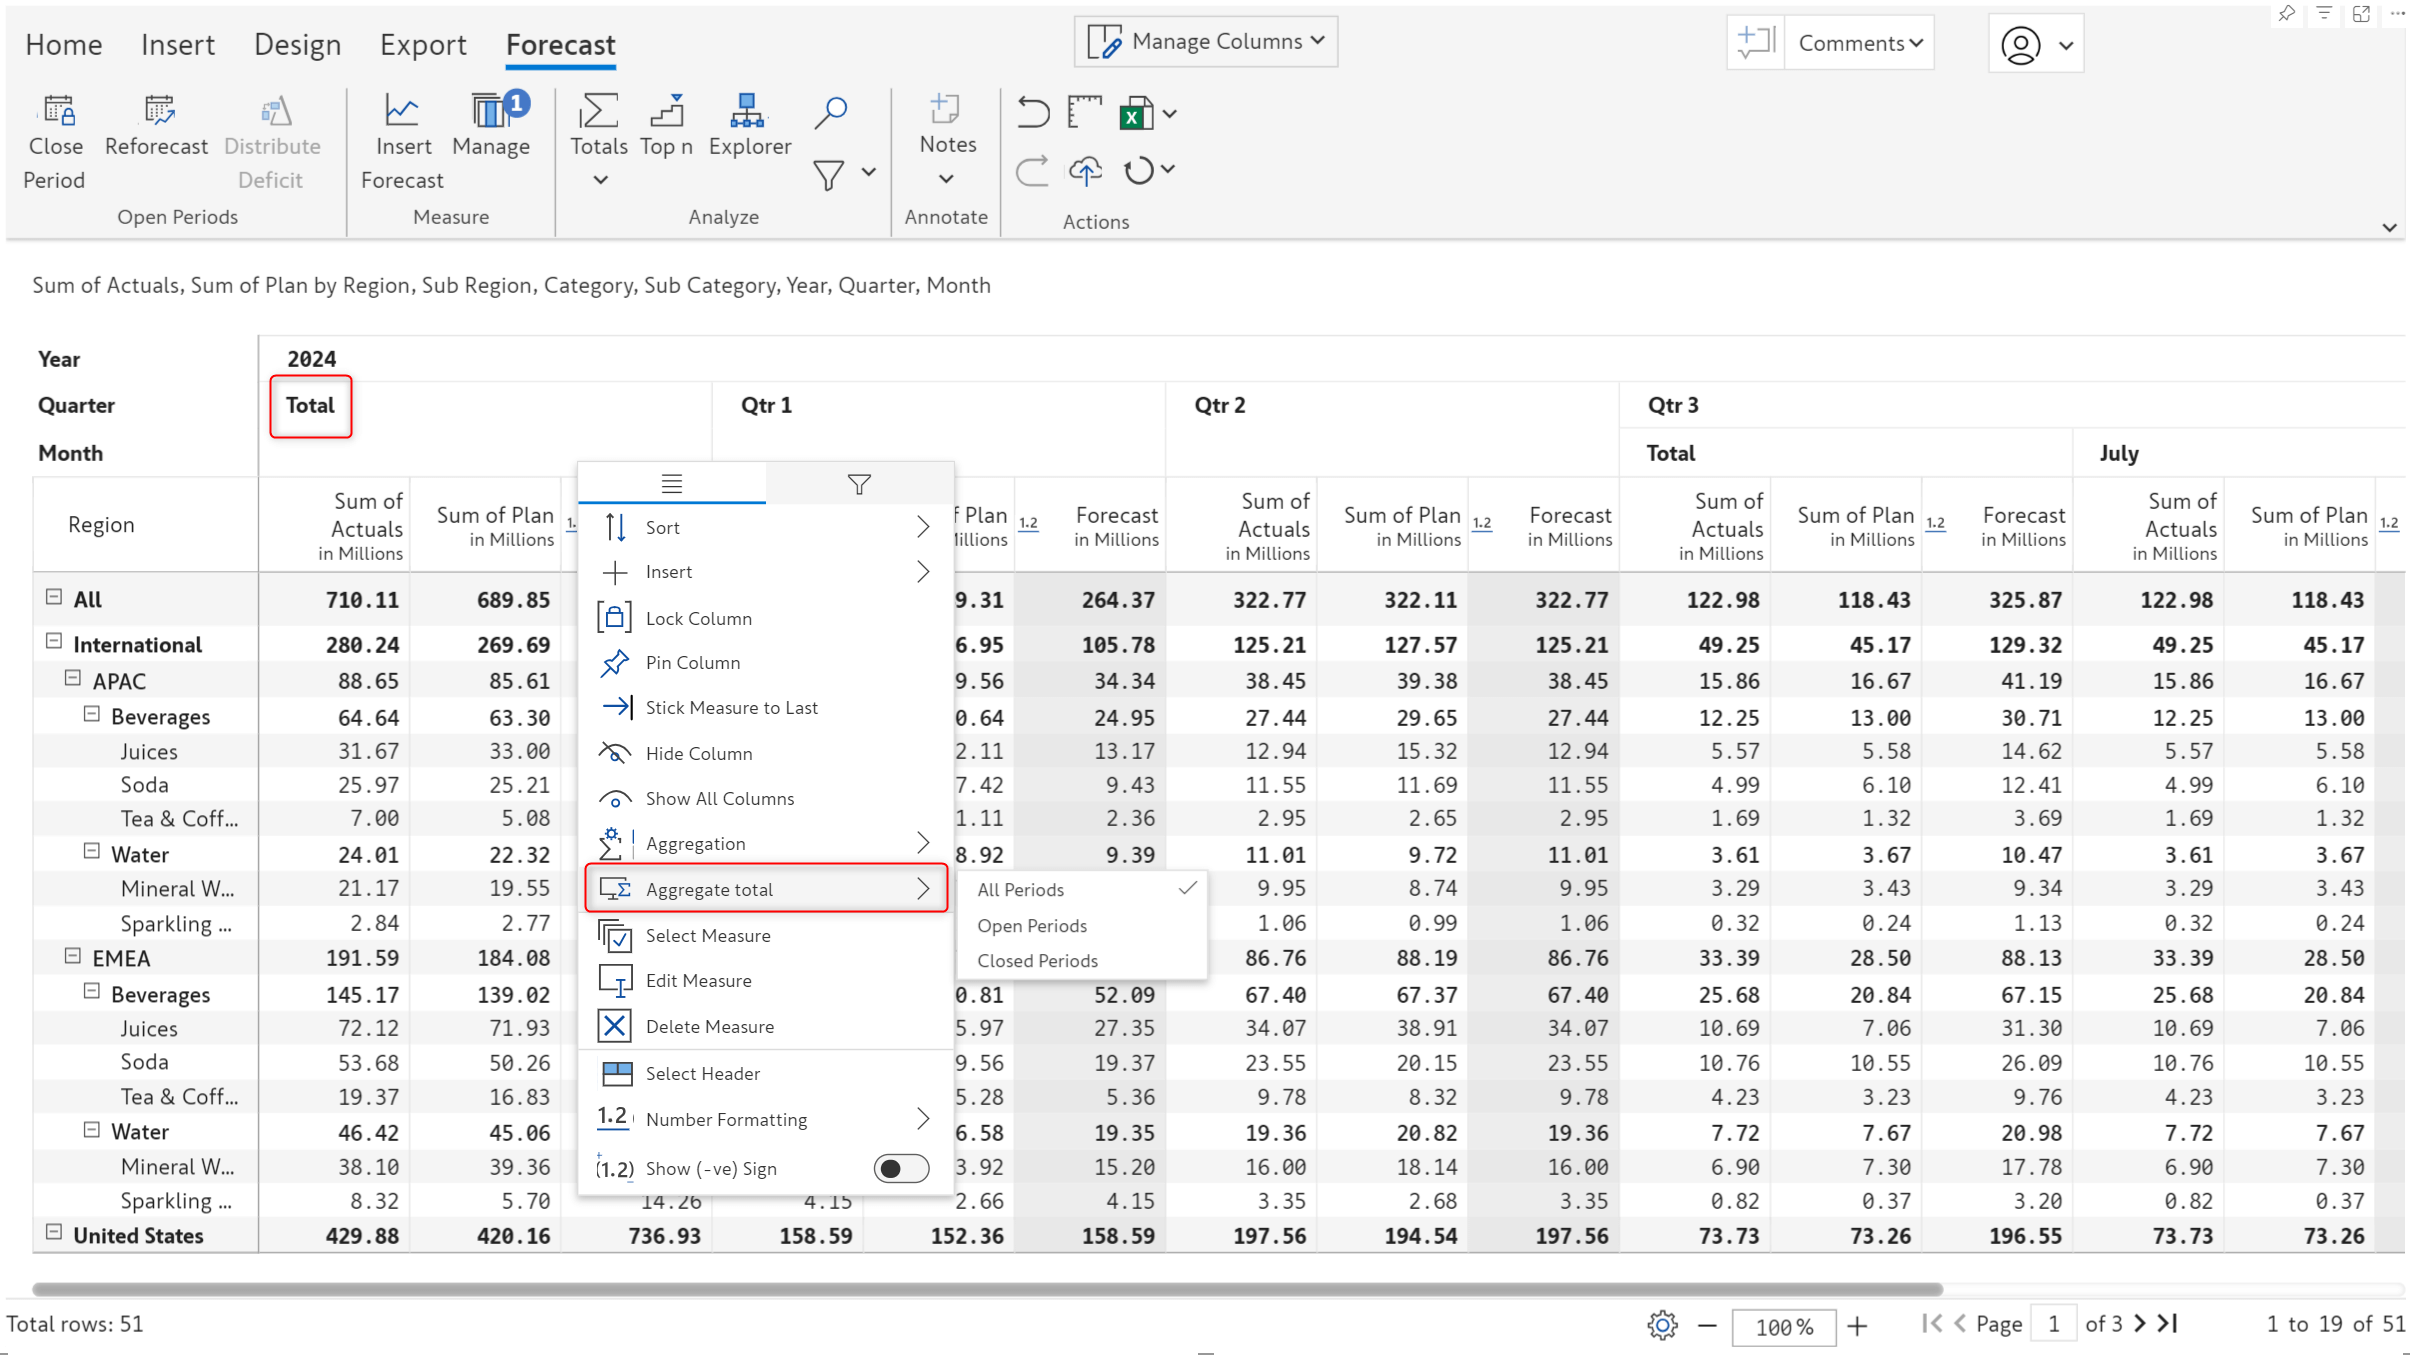
The July release brings you the flexibility to determine the aggregation for forecast sub-totals as well. Use the column gripper for the sub-total forecast to choose between Closed, Open, and All-period options.
In earlier versions, you could only simulate only one value at a time. In this release, we’ve integrated the bulk edit feature with scenarios enabling you to simulate entire row/column categories simultaneously.
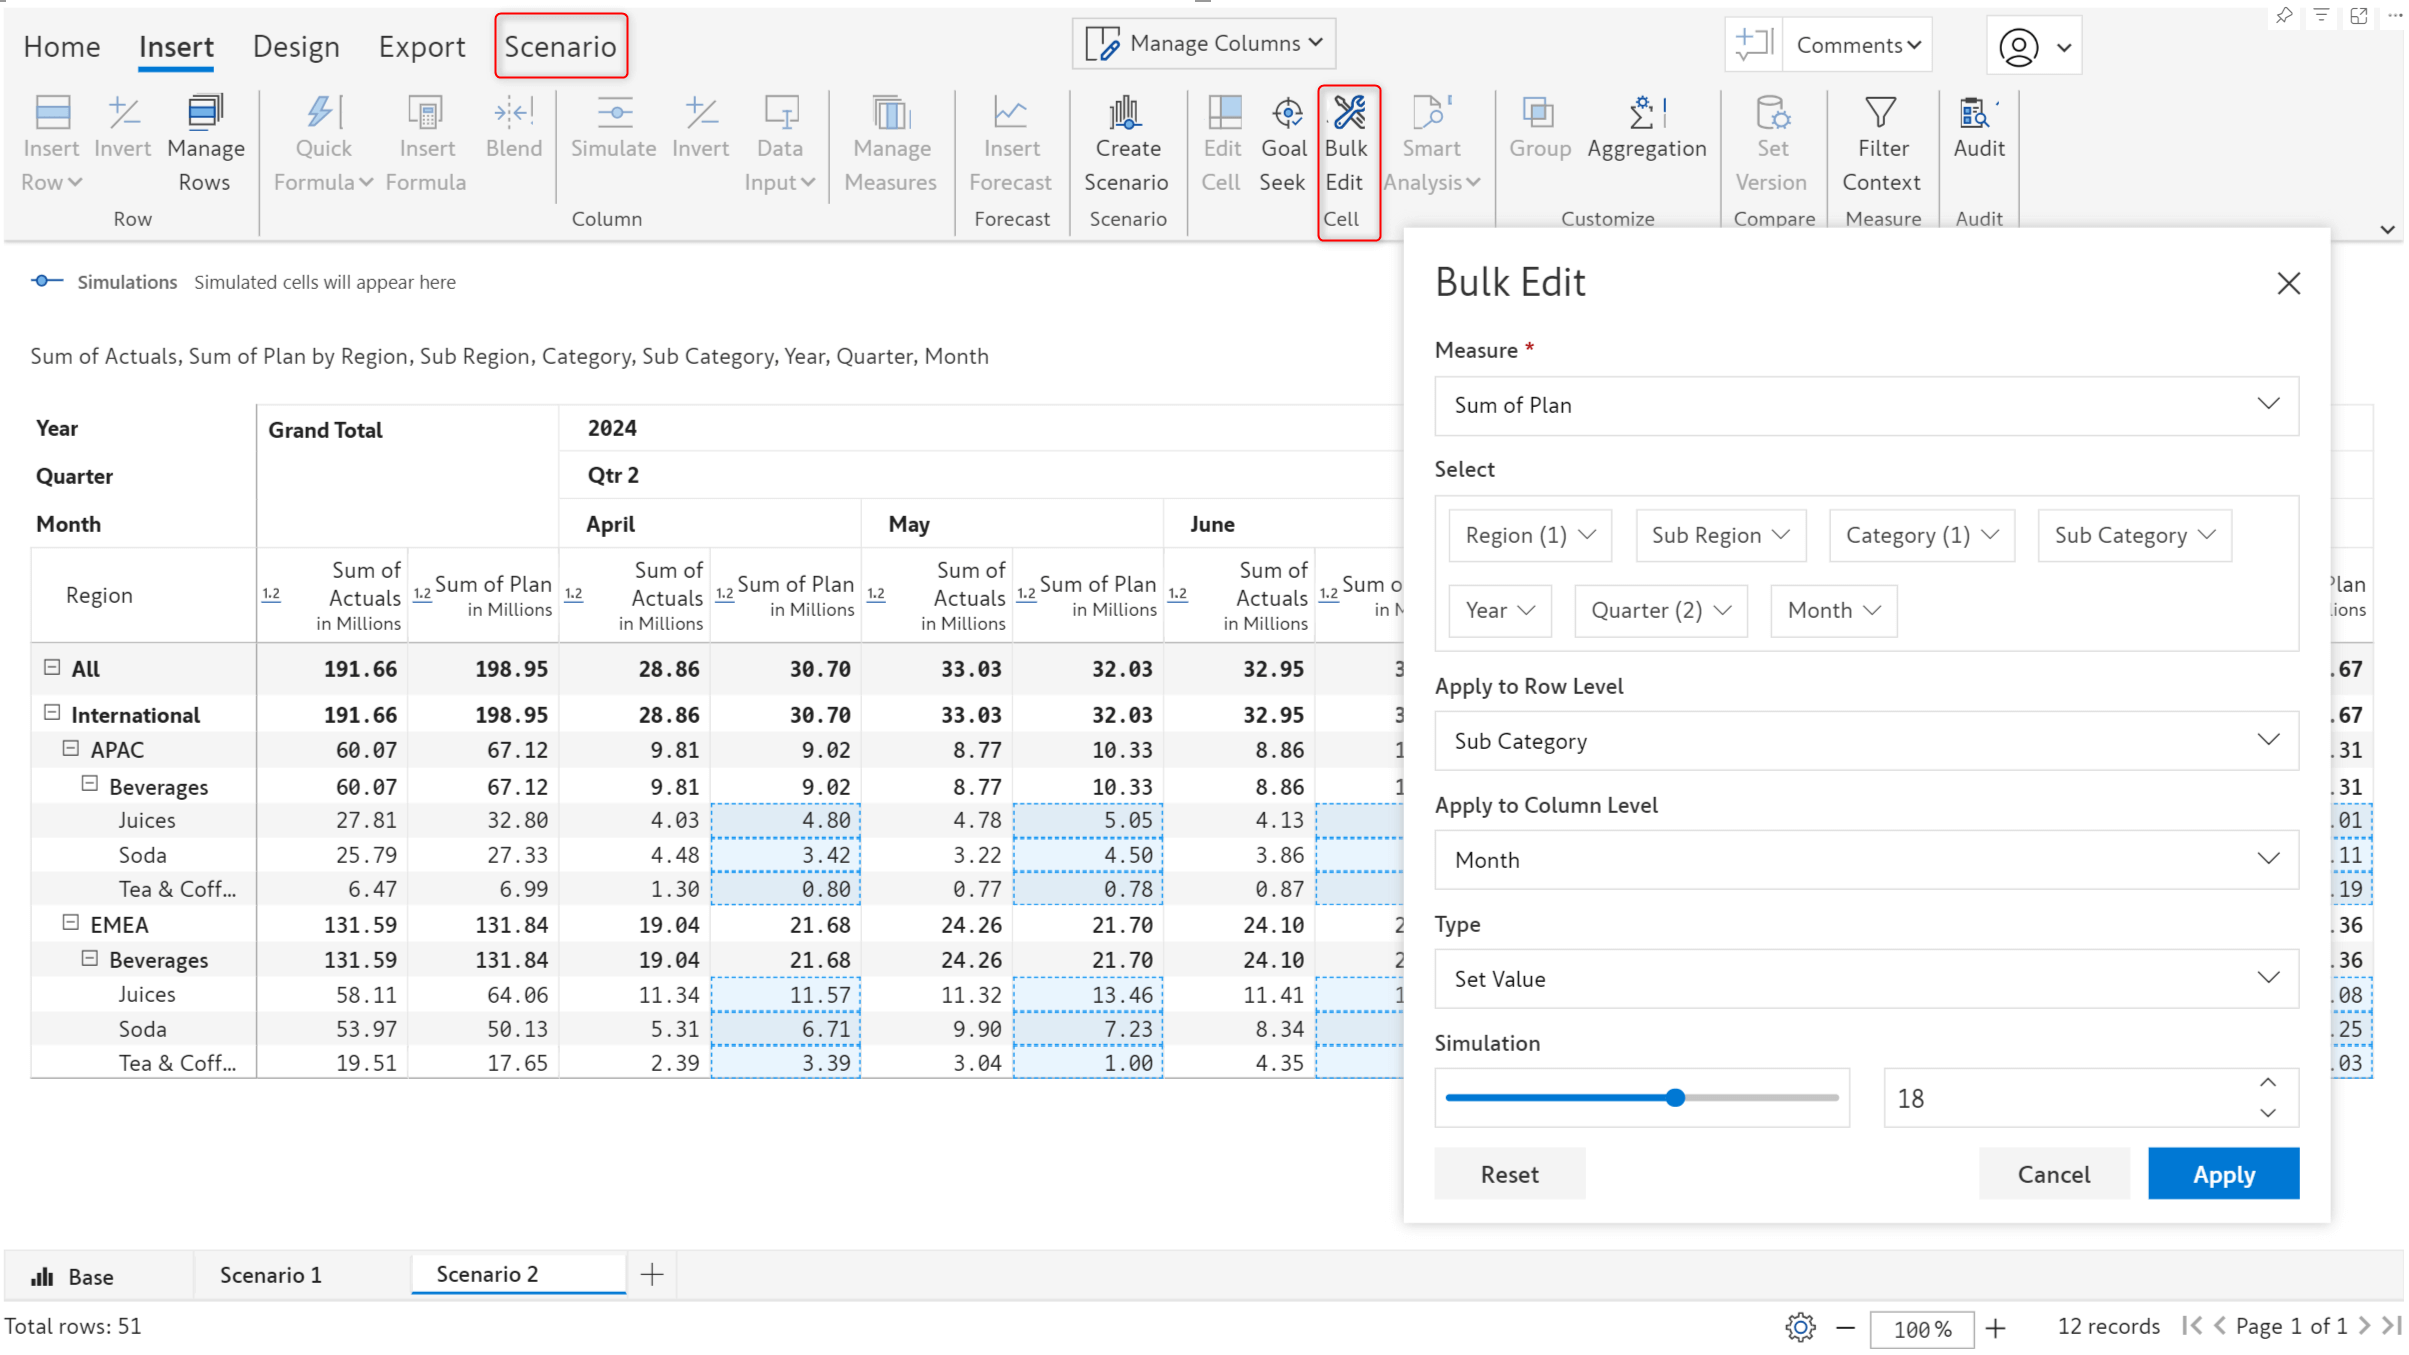
You can effortlessly perform analysis like gauging the impact of an x% increase in sales for a particular region or hiking the bonus for the employees in a particular department by x dollars. You can run bulk simulations in different scenarios and compare the results.
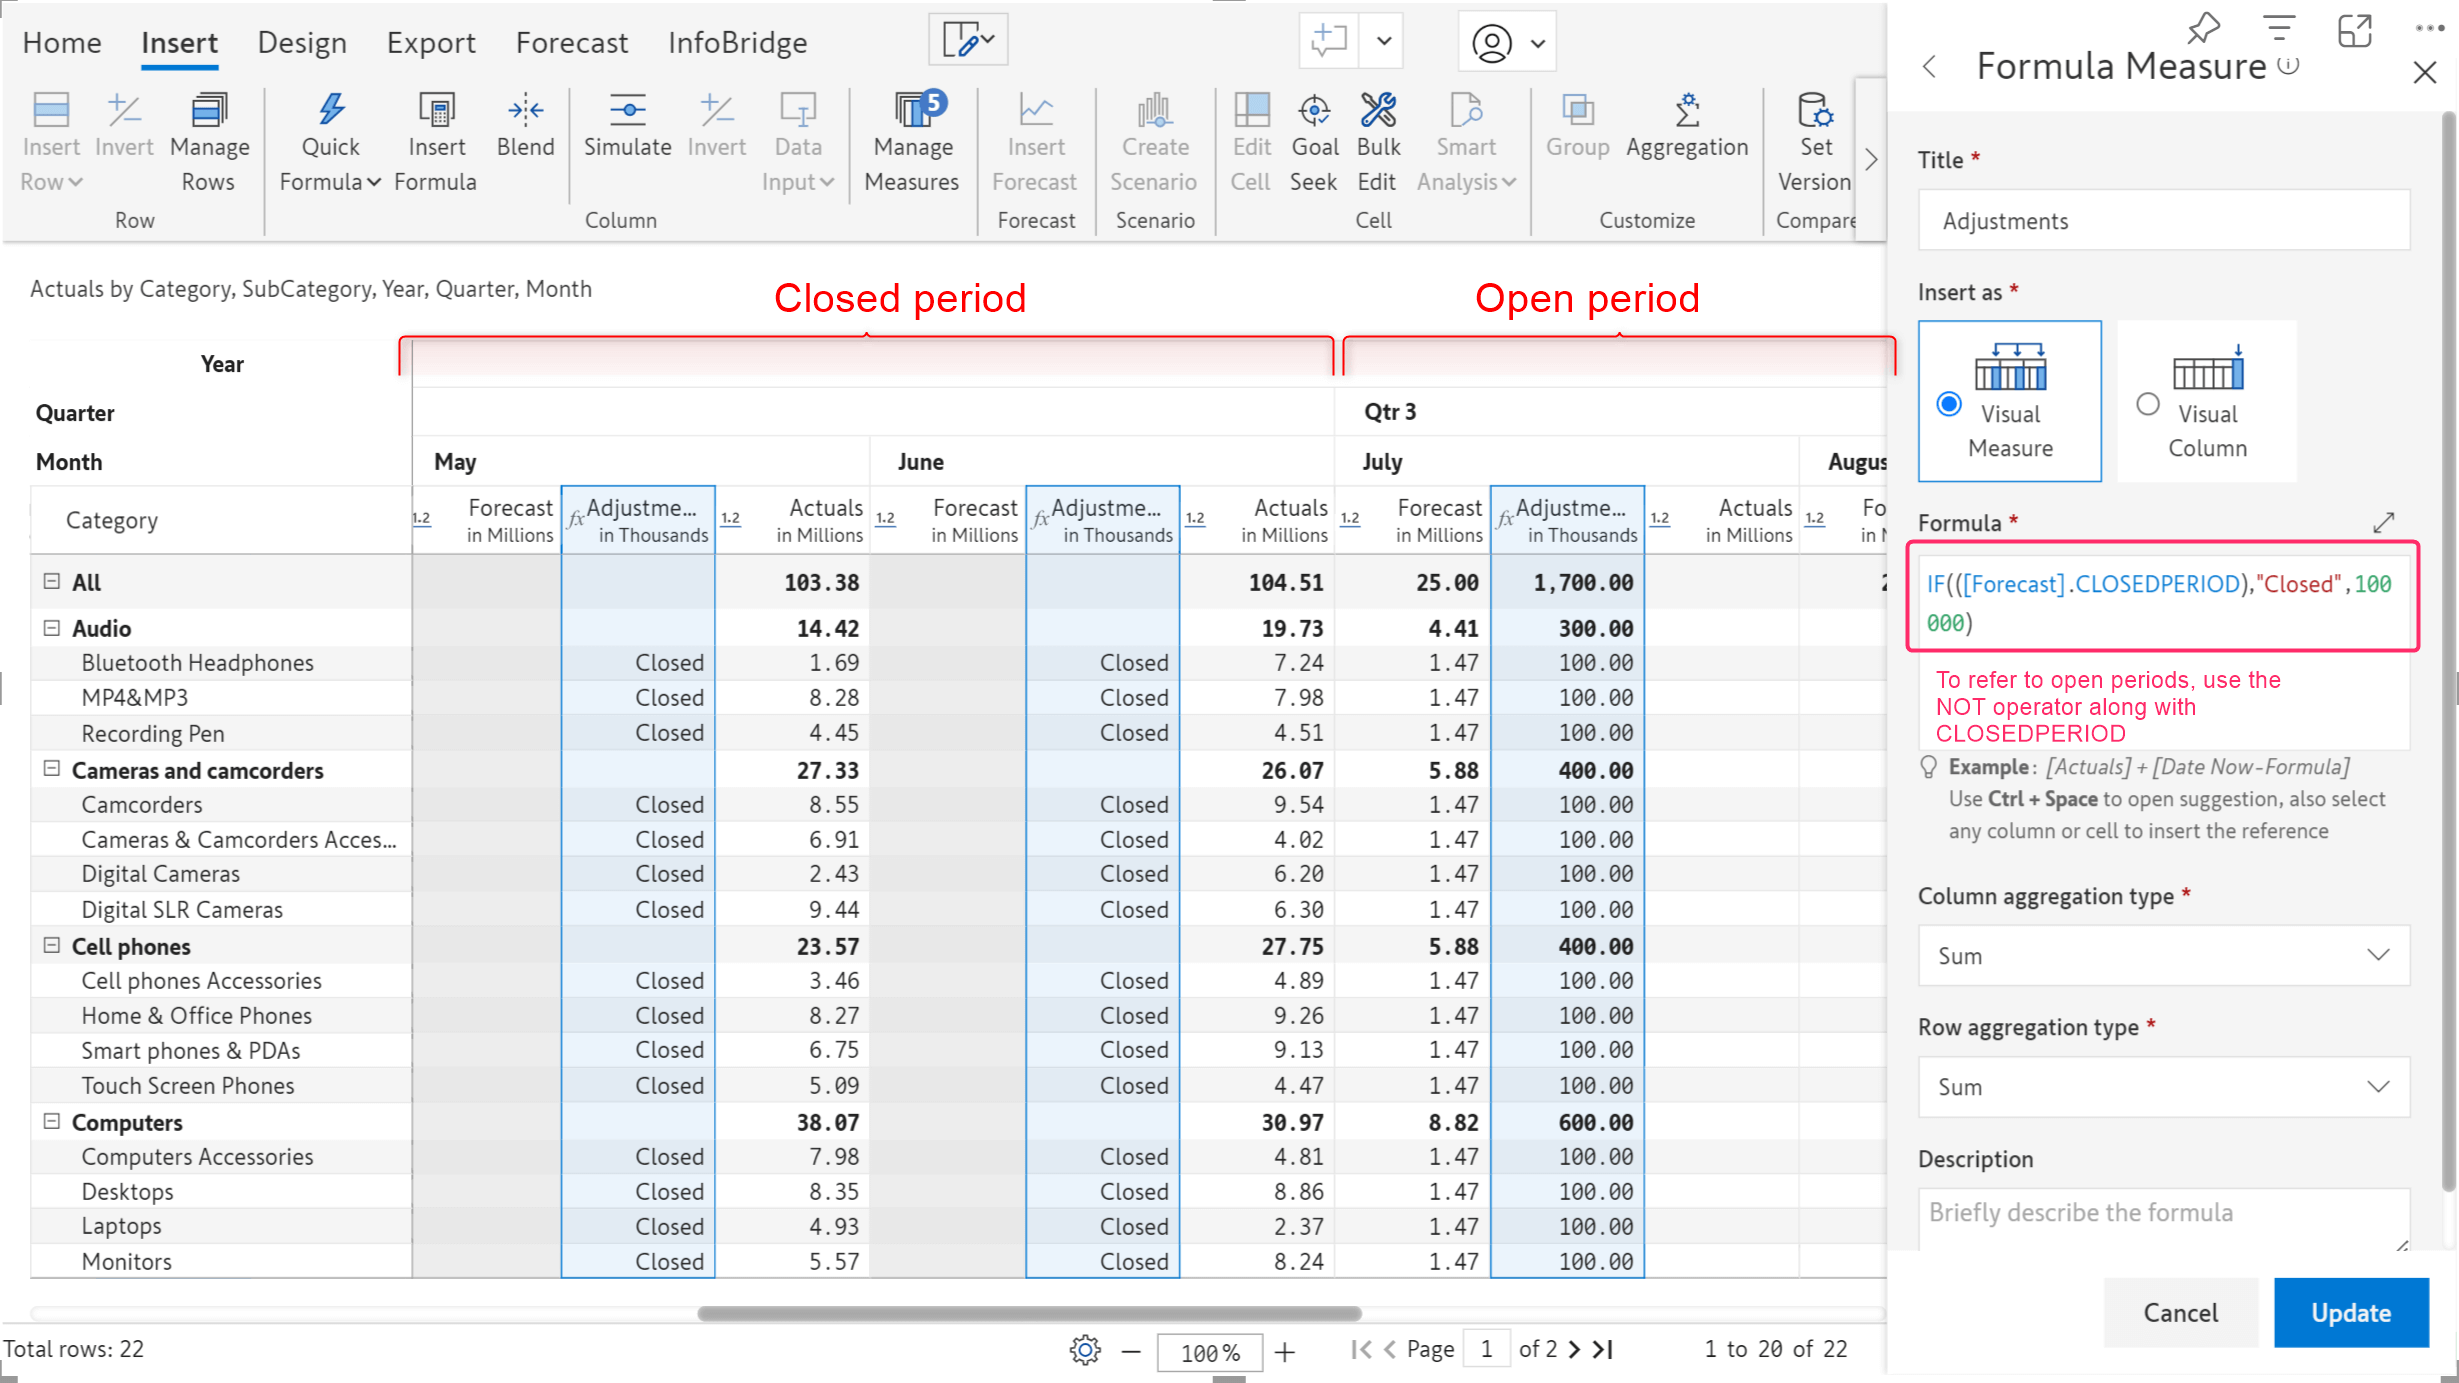
We have introduced a new function that can reference the closed and open periods in a forecast. For example, if you need to perform an action specific to the closed or open periods, you can use the <Forecast name>.CLOSEDPERIOD along with existing functions and identifiers.
Note: To reference open forecasts, you can use NOT(<Forecast name>.CLOSEDPERIOD)
Find the image below where we have added adjustment values to the open periods, and for the closed periods, we have marked them as 'closed'.
Have you written large, complex formulae and struggled with locating and fixing errors? We now display clear and concise error messages. In the maximized formula editor view, you will also notice that we have added line numbers, enabling you to quickly find and fix errors.
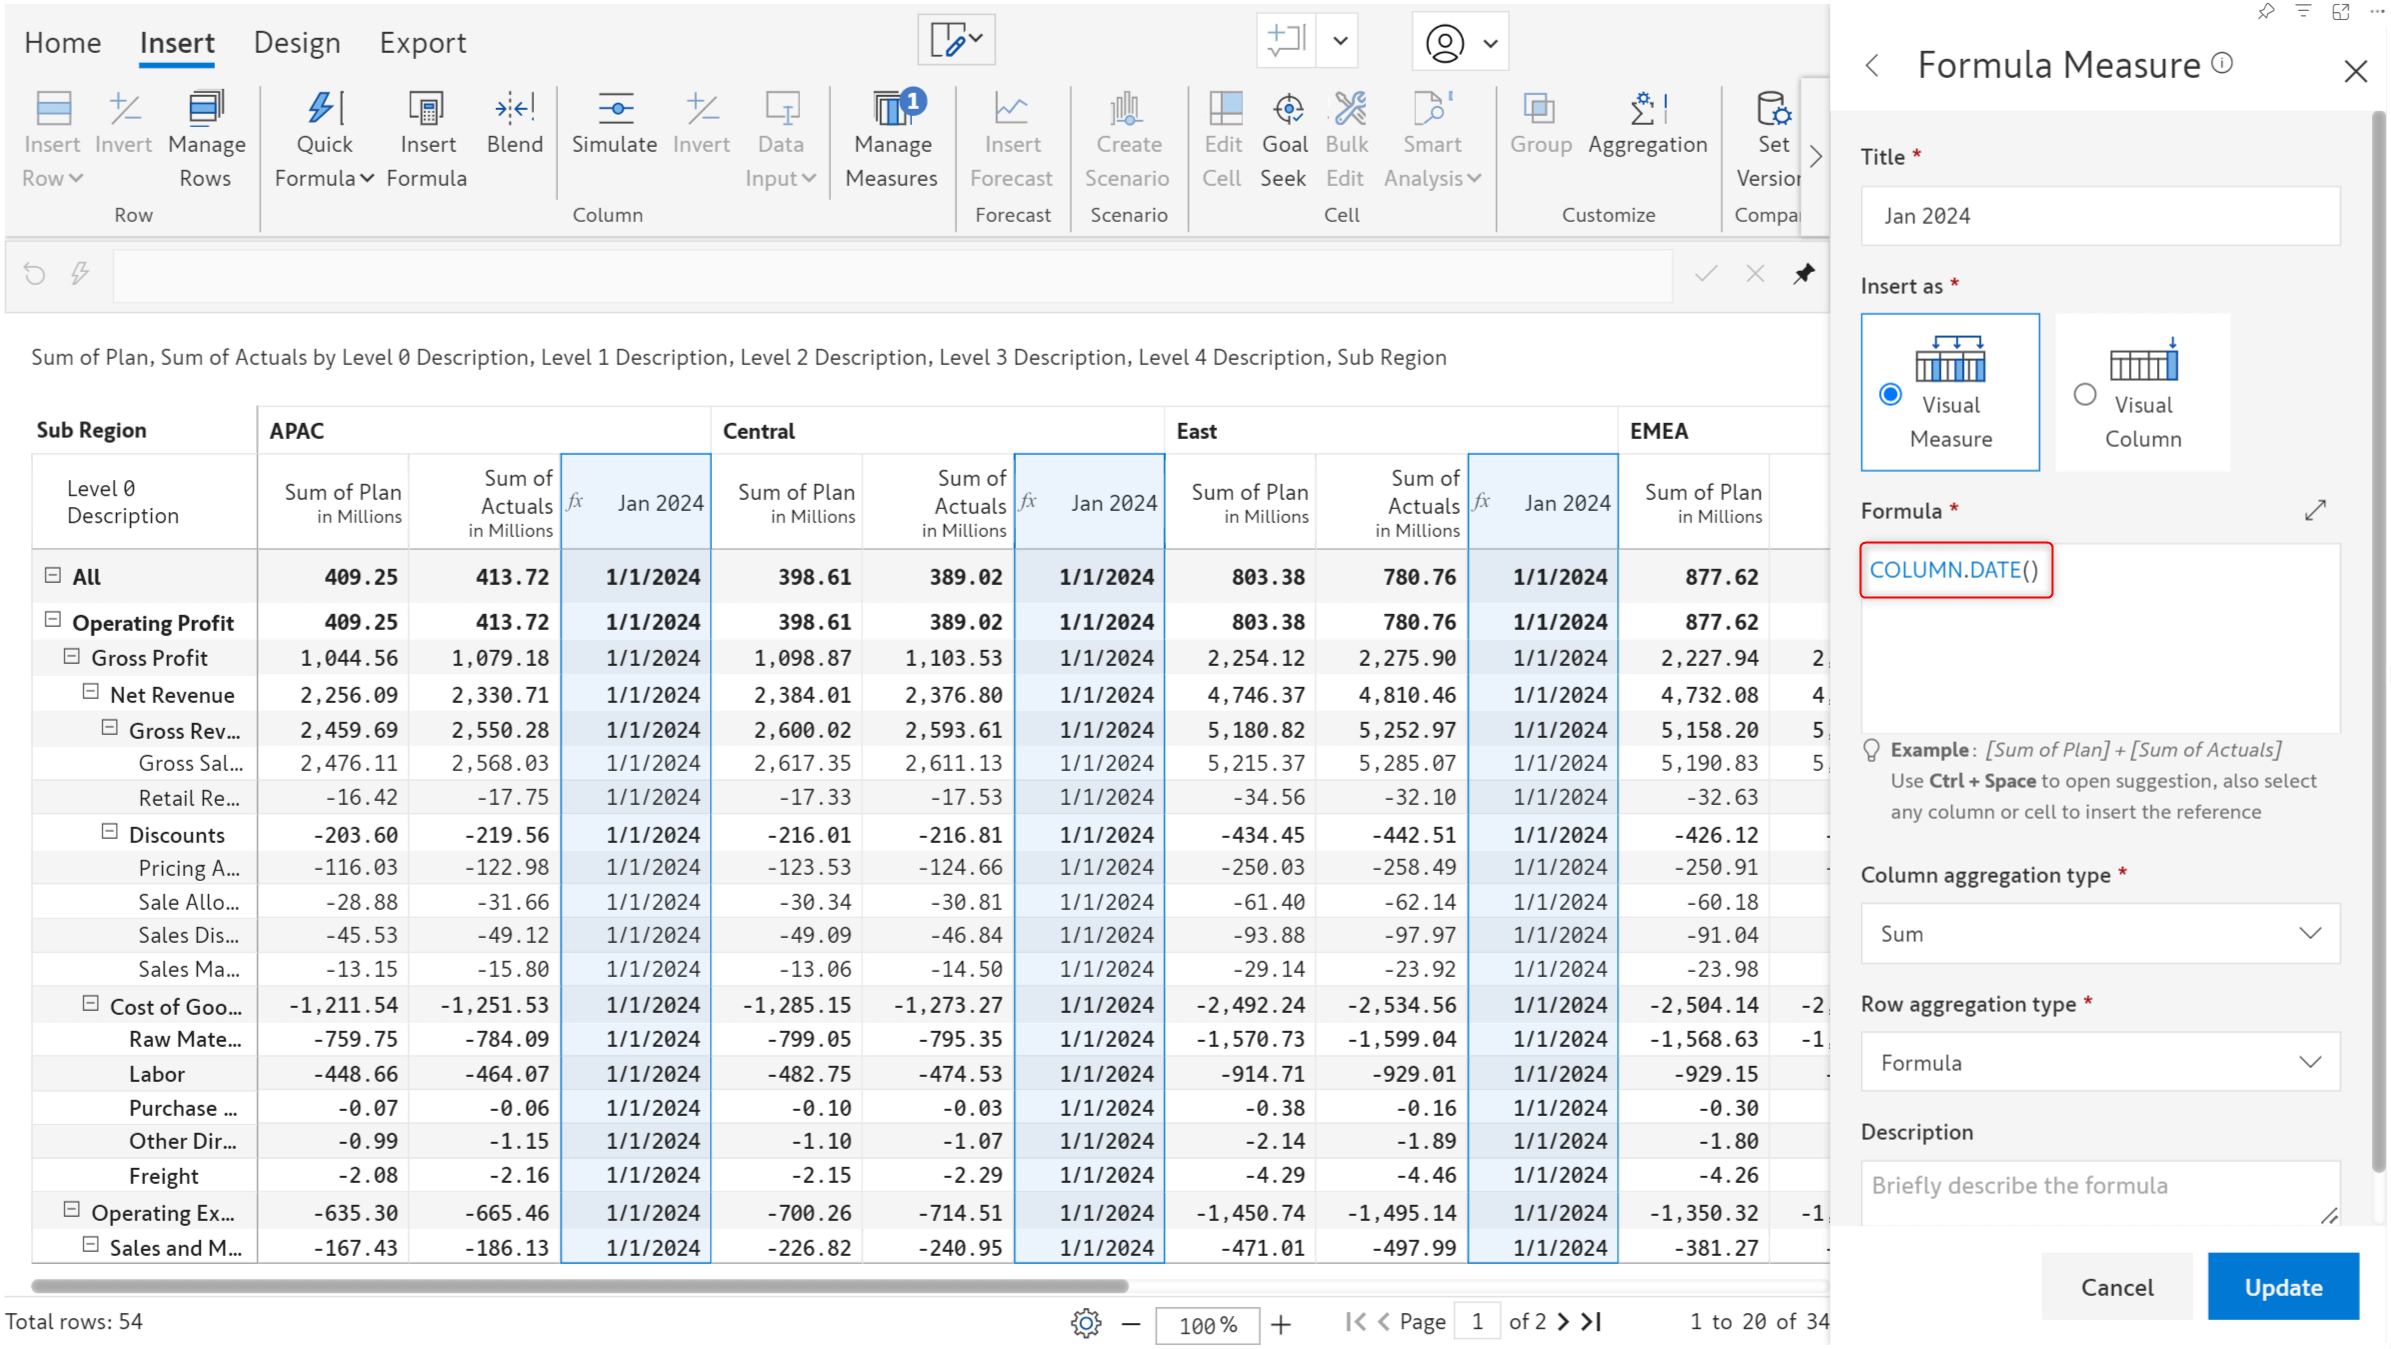
We have added a COLUMN.DATE() function that enables you to reference date values in measure titles in your formulae.
Note: If your columns have a date dimension and you do not specify a title for the formula, COLUMN.DATE() will return the column dimension value.
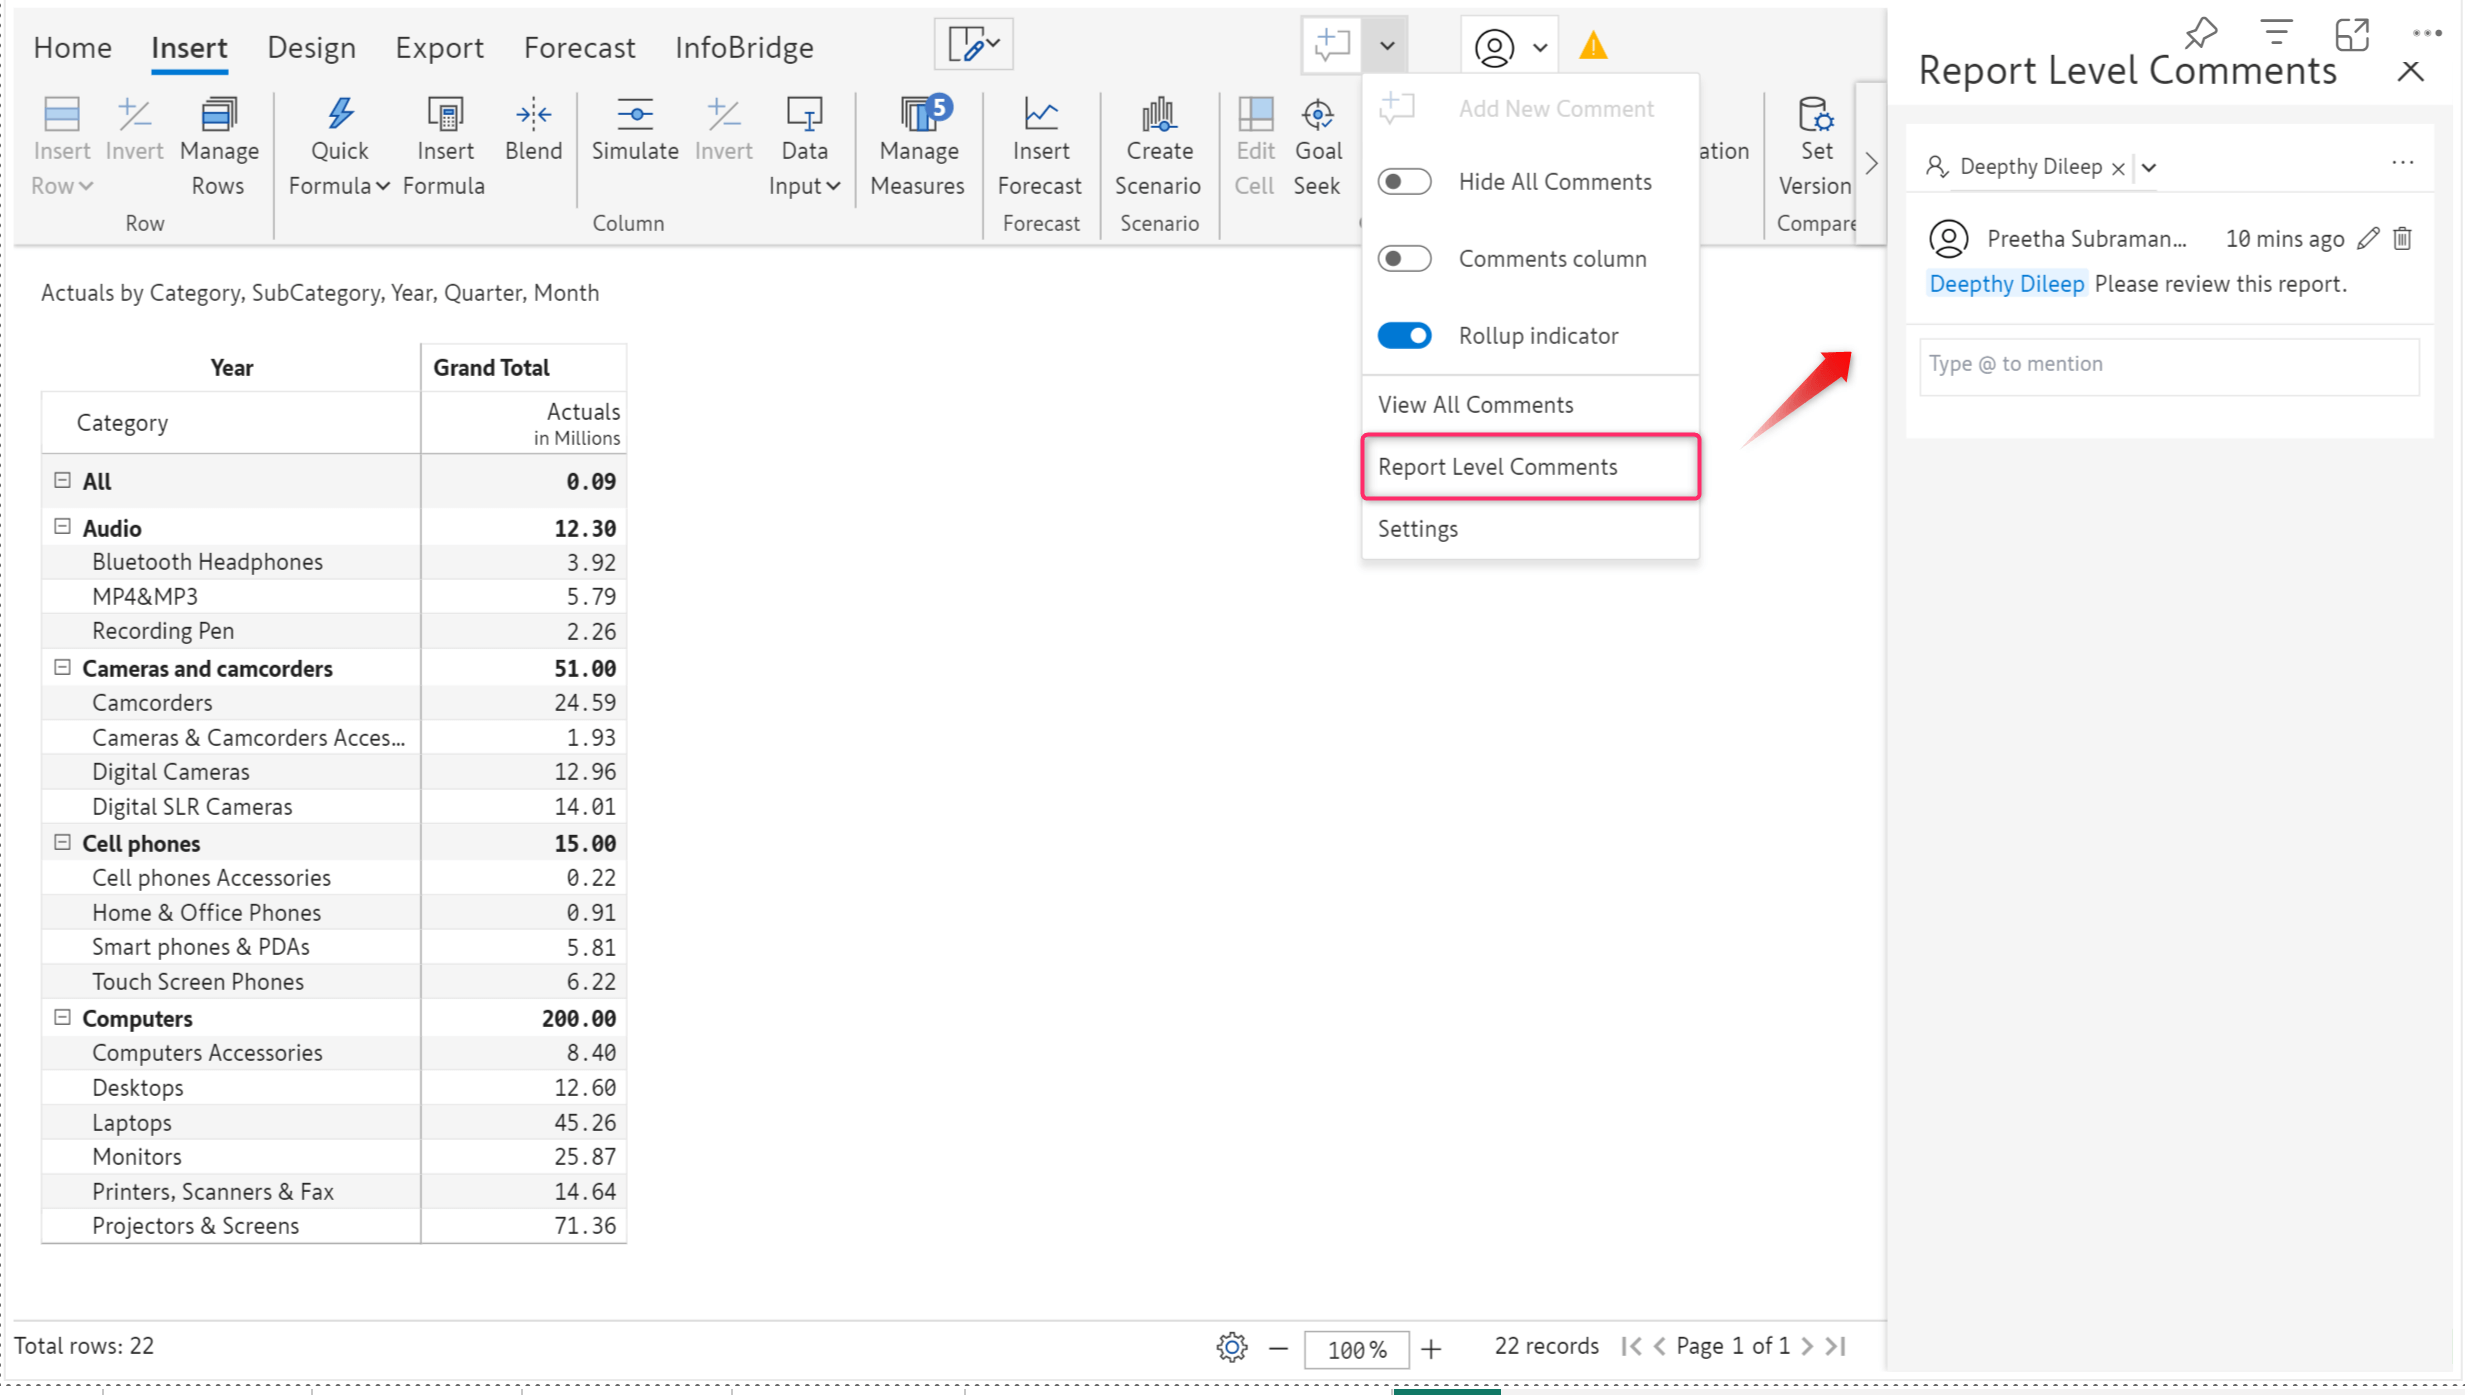
Just like the report summary feature we have for Notes, we have also introduced report-level comments. You can now add report-specific comments while assigning tasks and collaborating with your team.
When you create a new subscription using the latest version, you’ll notice the Dynamic Subscription option.
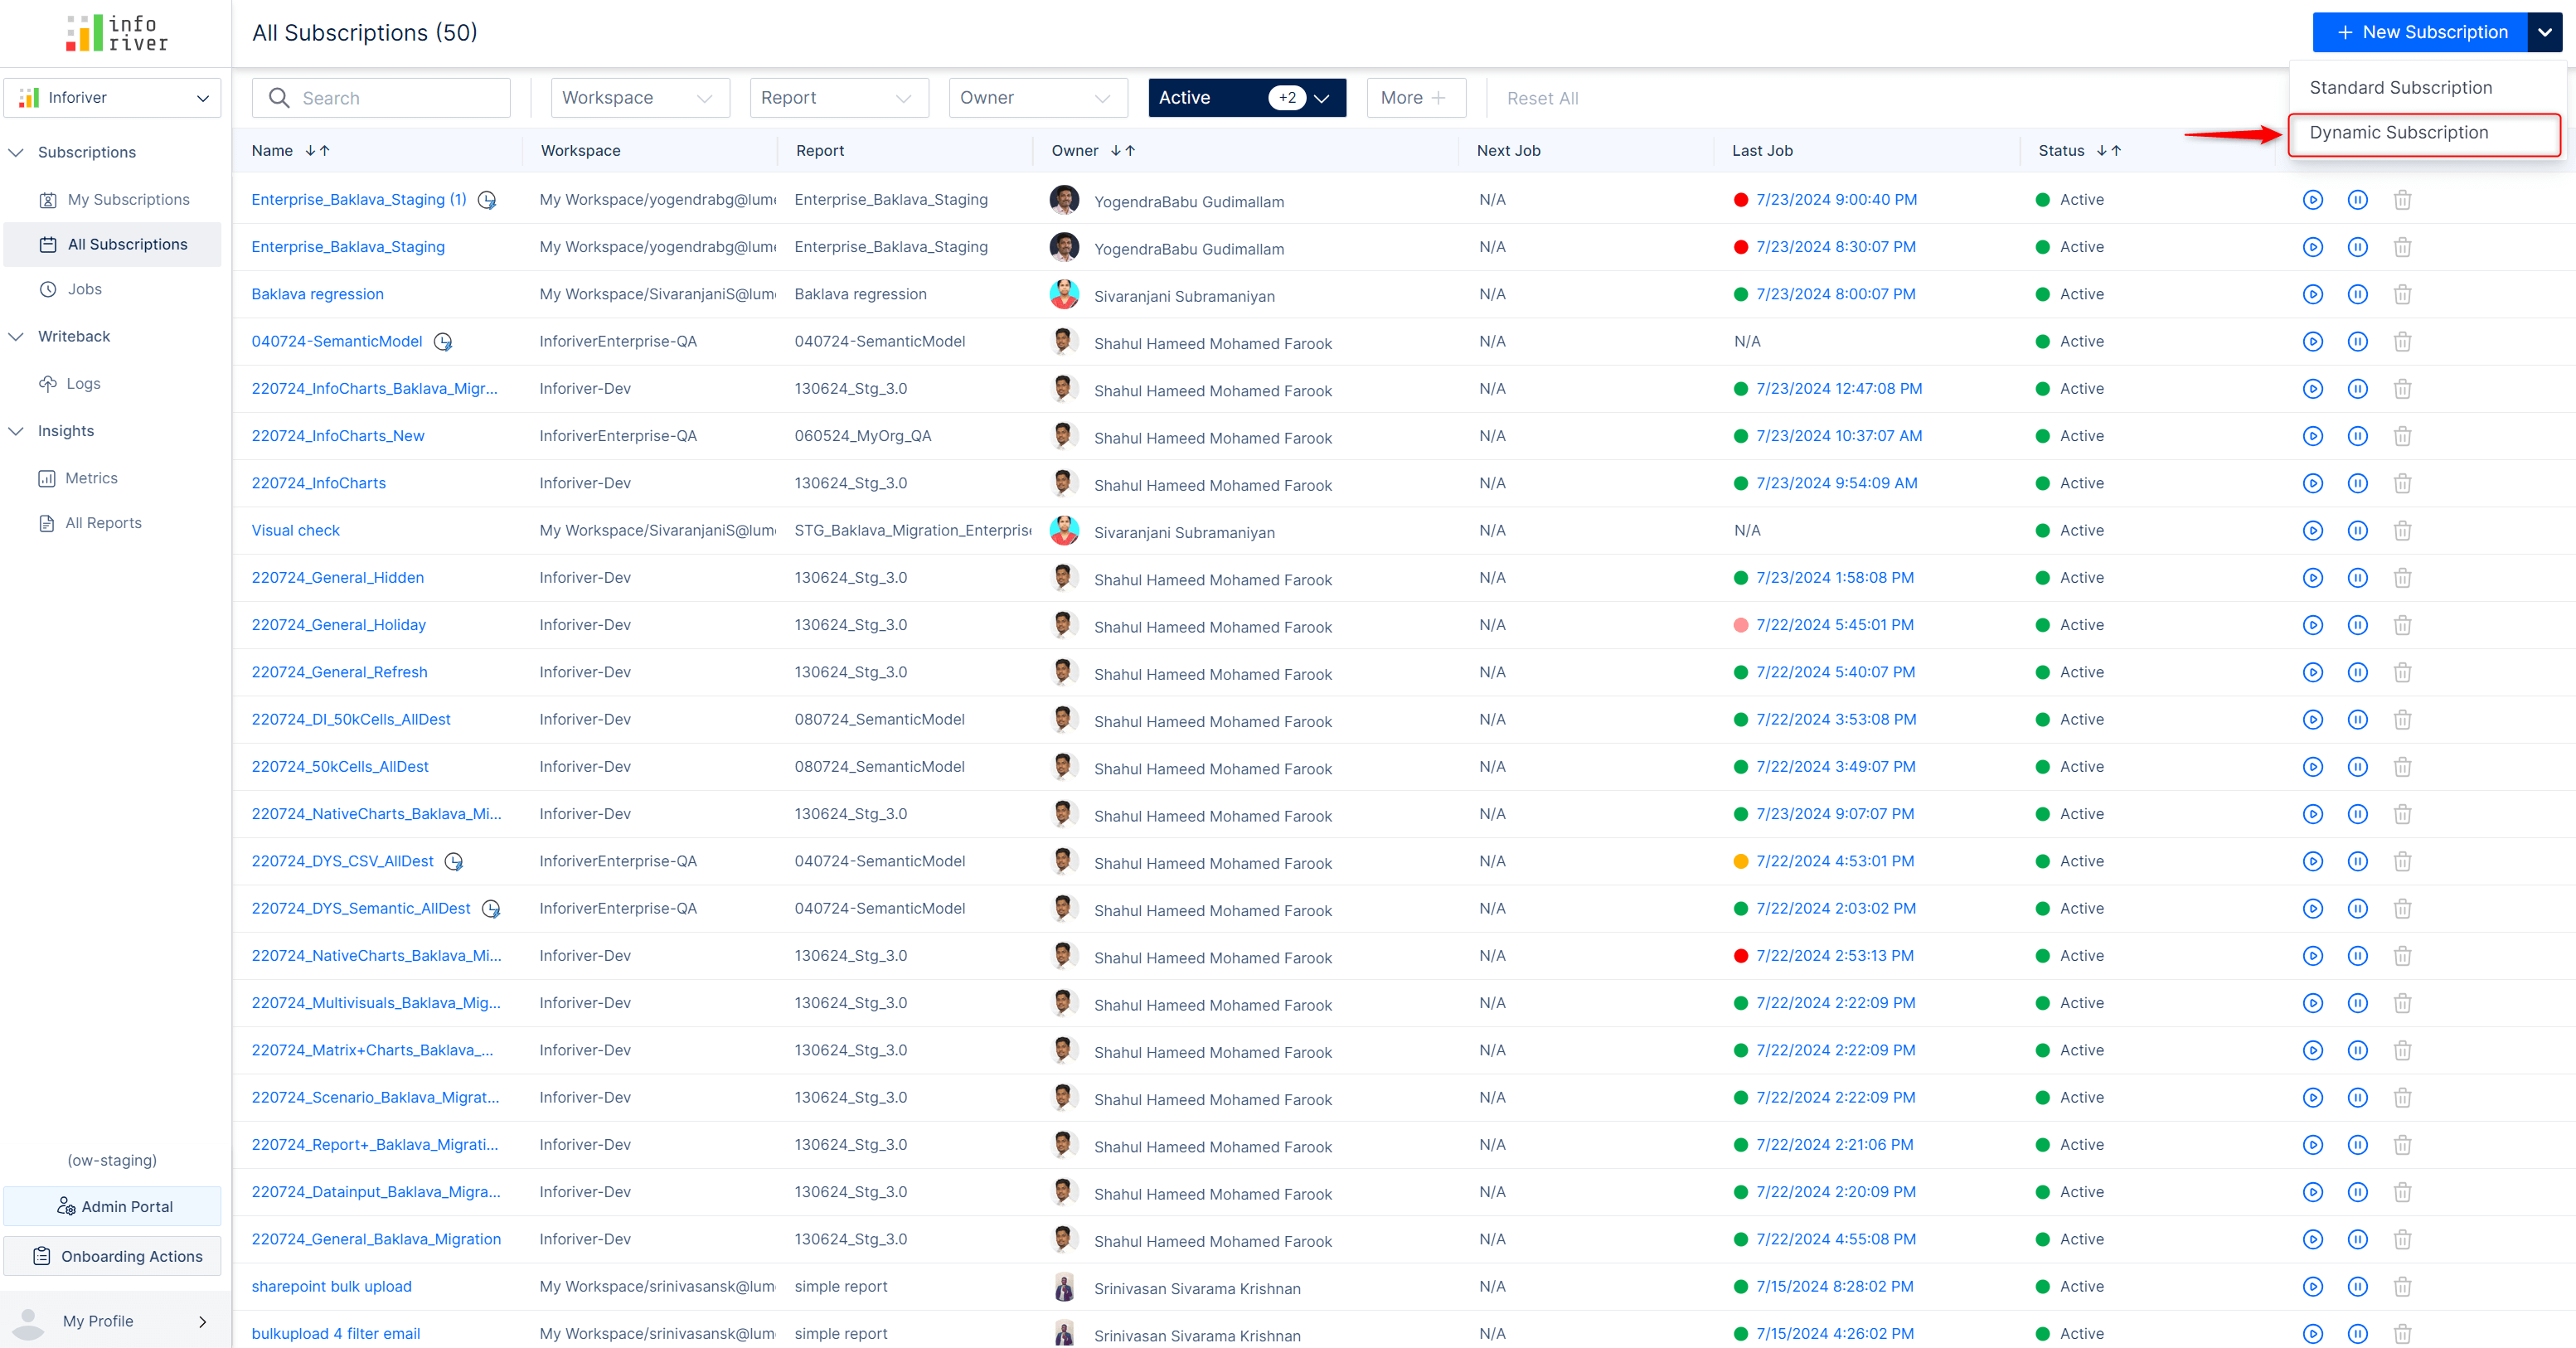
Inforiver allows you to specify filters and regulate the dimension categories shared with users. With dynamic subscriptions, Inforiver can detect email IDs from your semantic models/CSV files and implicitly send the report to a specific user.
Note: This feature applies to datasets that contain Email IDs.
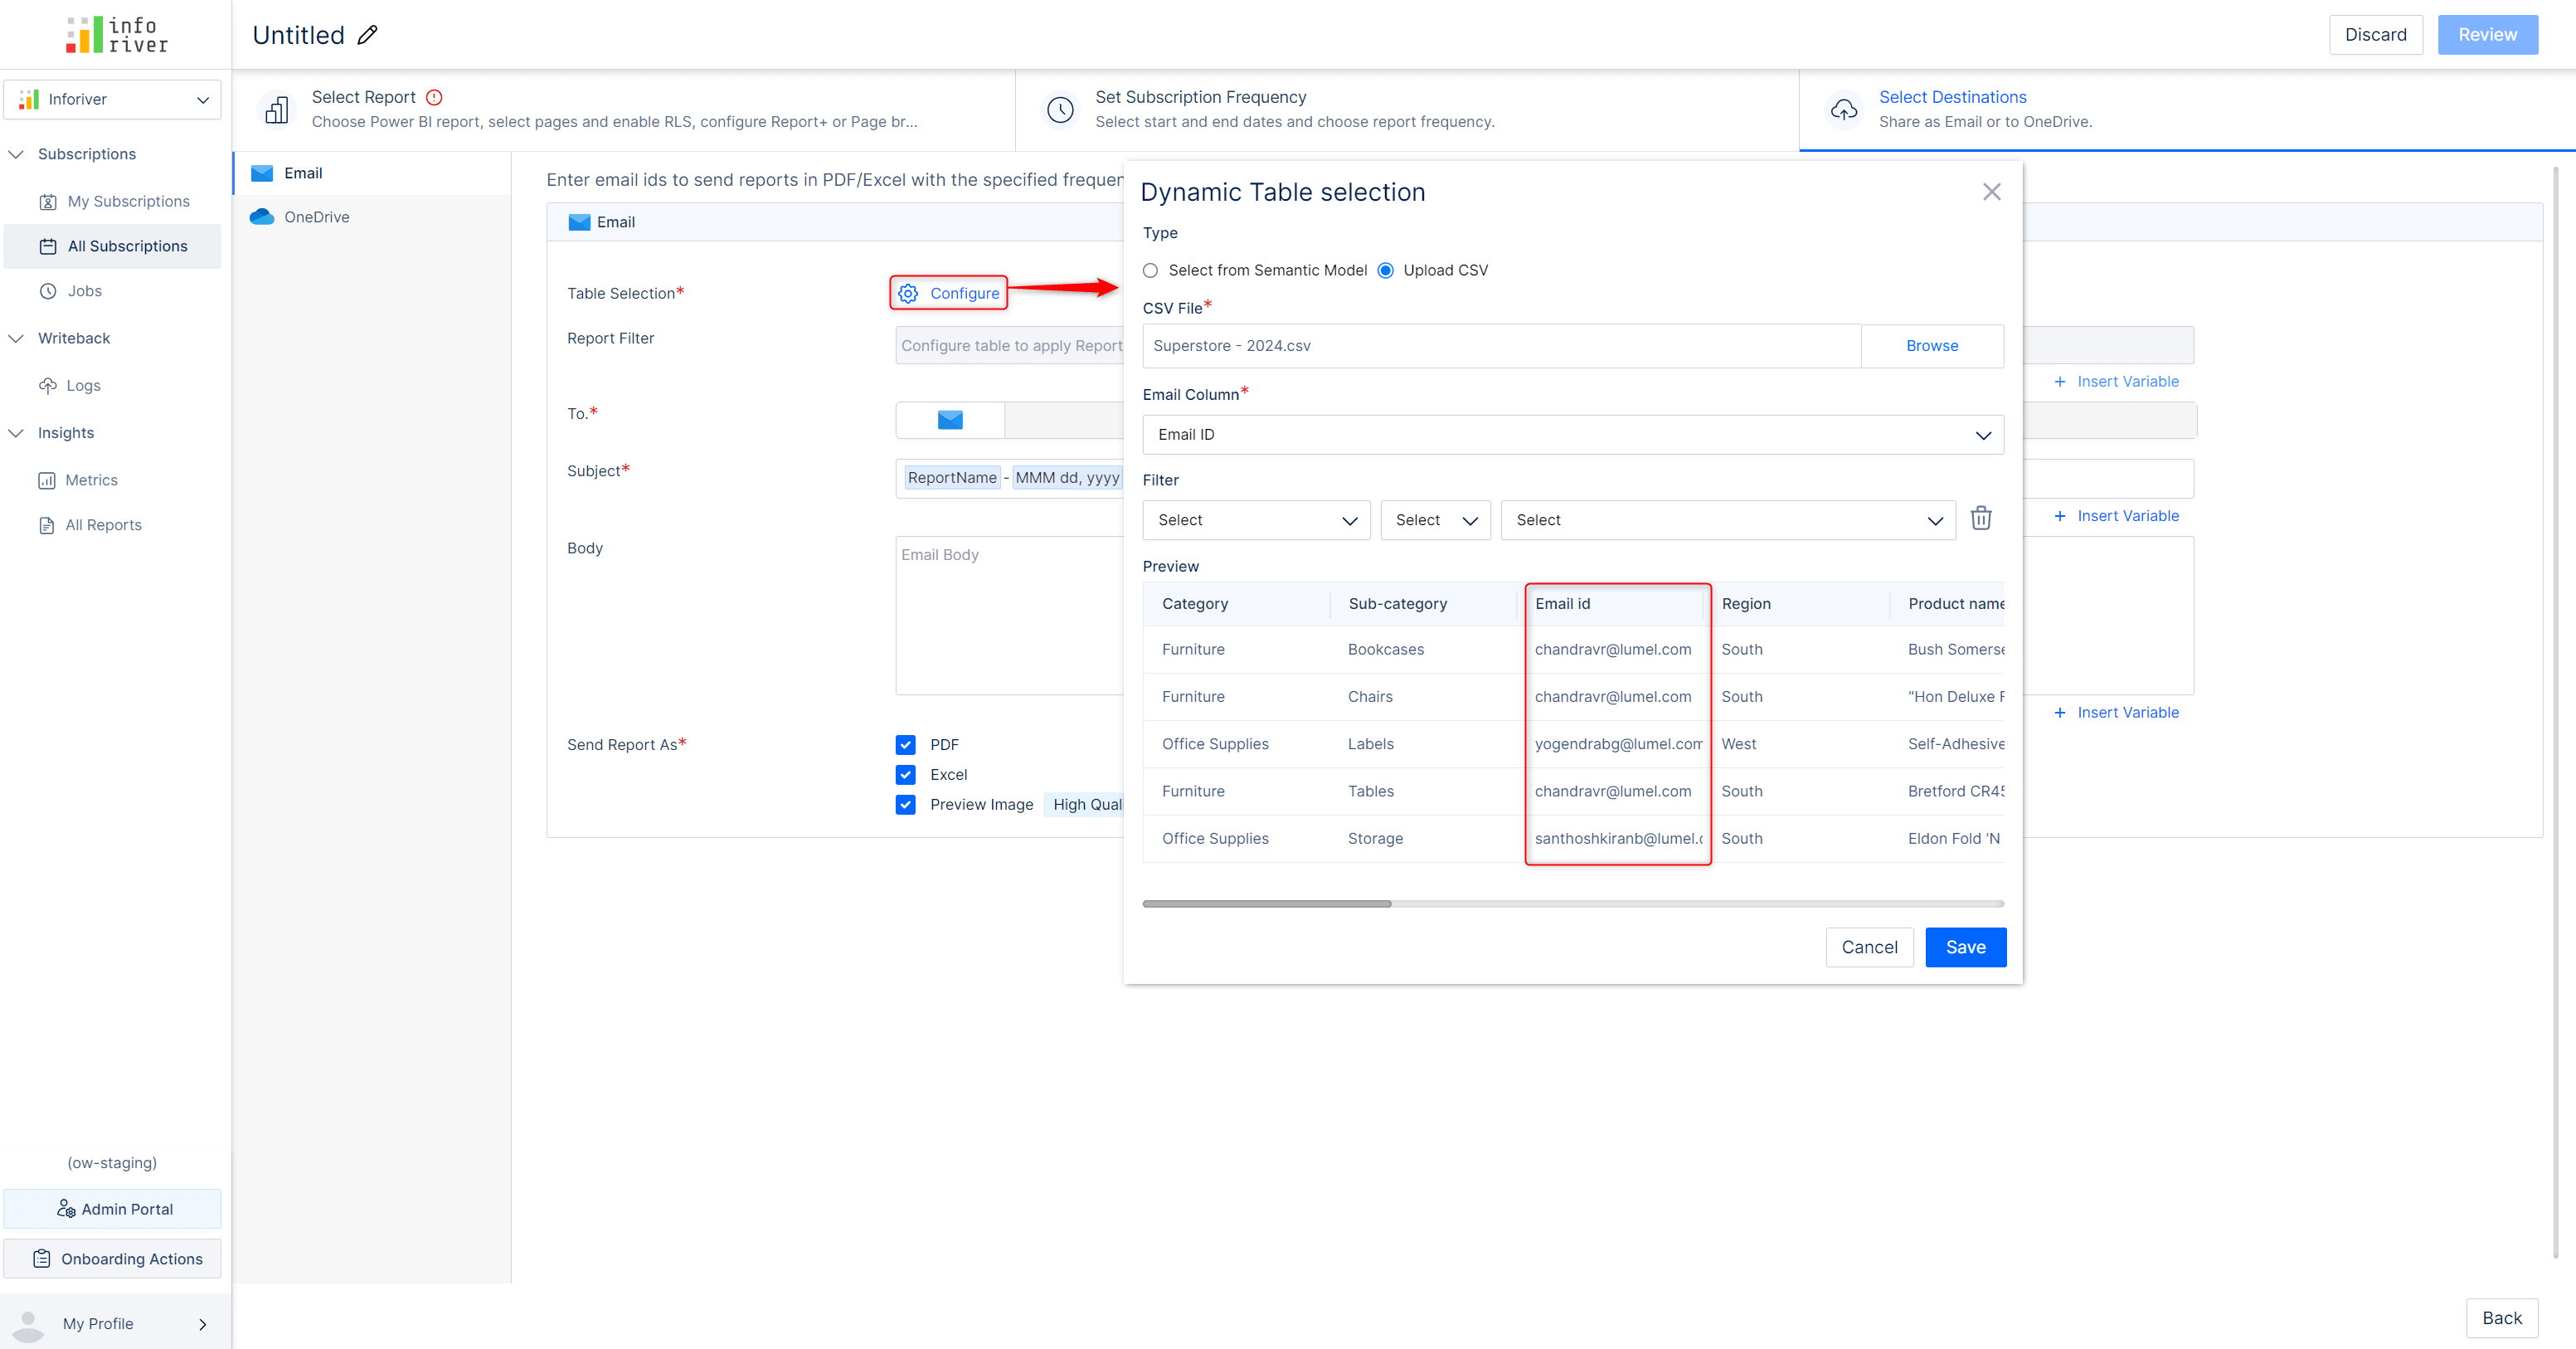
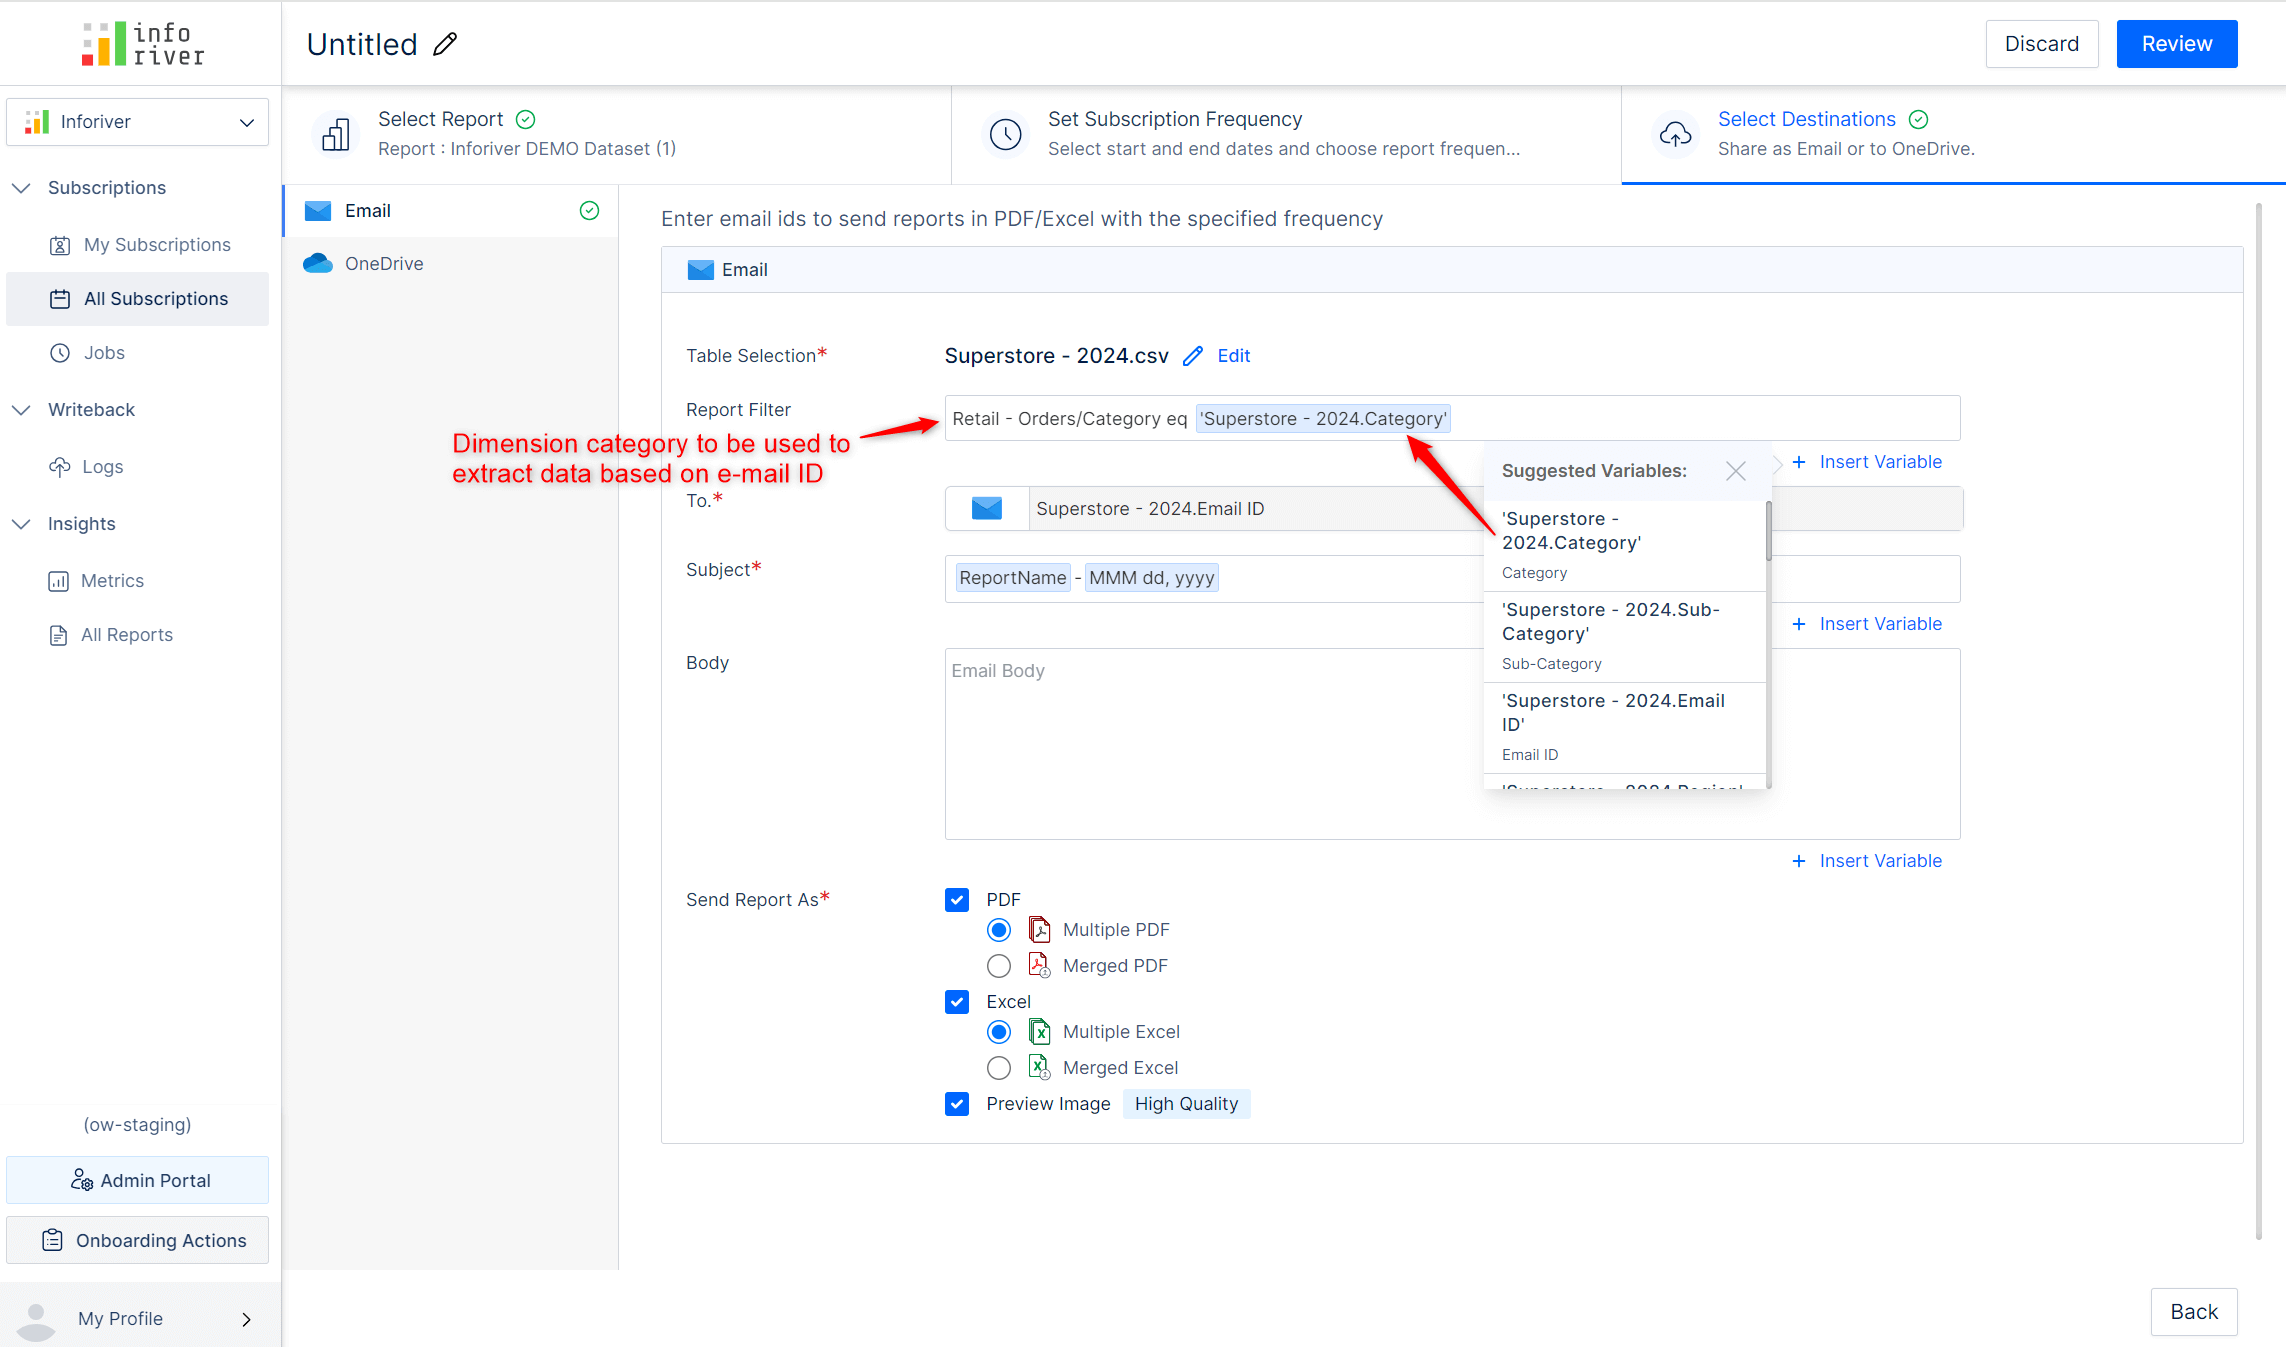
The scheduler will extract the report data by picking the dimension categories assigned to a particular email ID. After you create a report filter that specifies which dimension to use, Inforiver will deliver the report to the configured e-mail ID.
The scheduler has been re-factored, and you will now be able to generate subscriptions for high-volume datasets of up to 75K cells.
Report users can leverage the extensive range of keyboard shortcut keys for effortless accessibility. These include navigation keys to browse menus and shortcut keys to select cells, copy values, distribute totals, trigger writeback, and add comments. For example, you can use Alt + WB to trigger a writeback, Ctrl + M to add a comment, etc. You can refer to the product documentation to view all the keyboard shortcuts.
Please note that keyboard shortcuts are primarily intended for use in reading mode.
You can view your Inforiver license details and plan by clicking on your profile and choosing the License Details option.
Report viewers may apply formatting/Inforiver filters for data analysis and save their changes using the Power BI bookmarking feature. However, if the report author makes any changes to the report, the viewers may not be able to see these changes when bookmarks are applied.
In the Allowed User Controls window, a new option has been added, which gives users the option of using bookmarks.
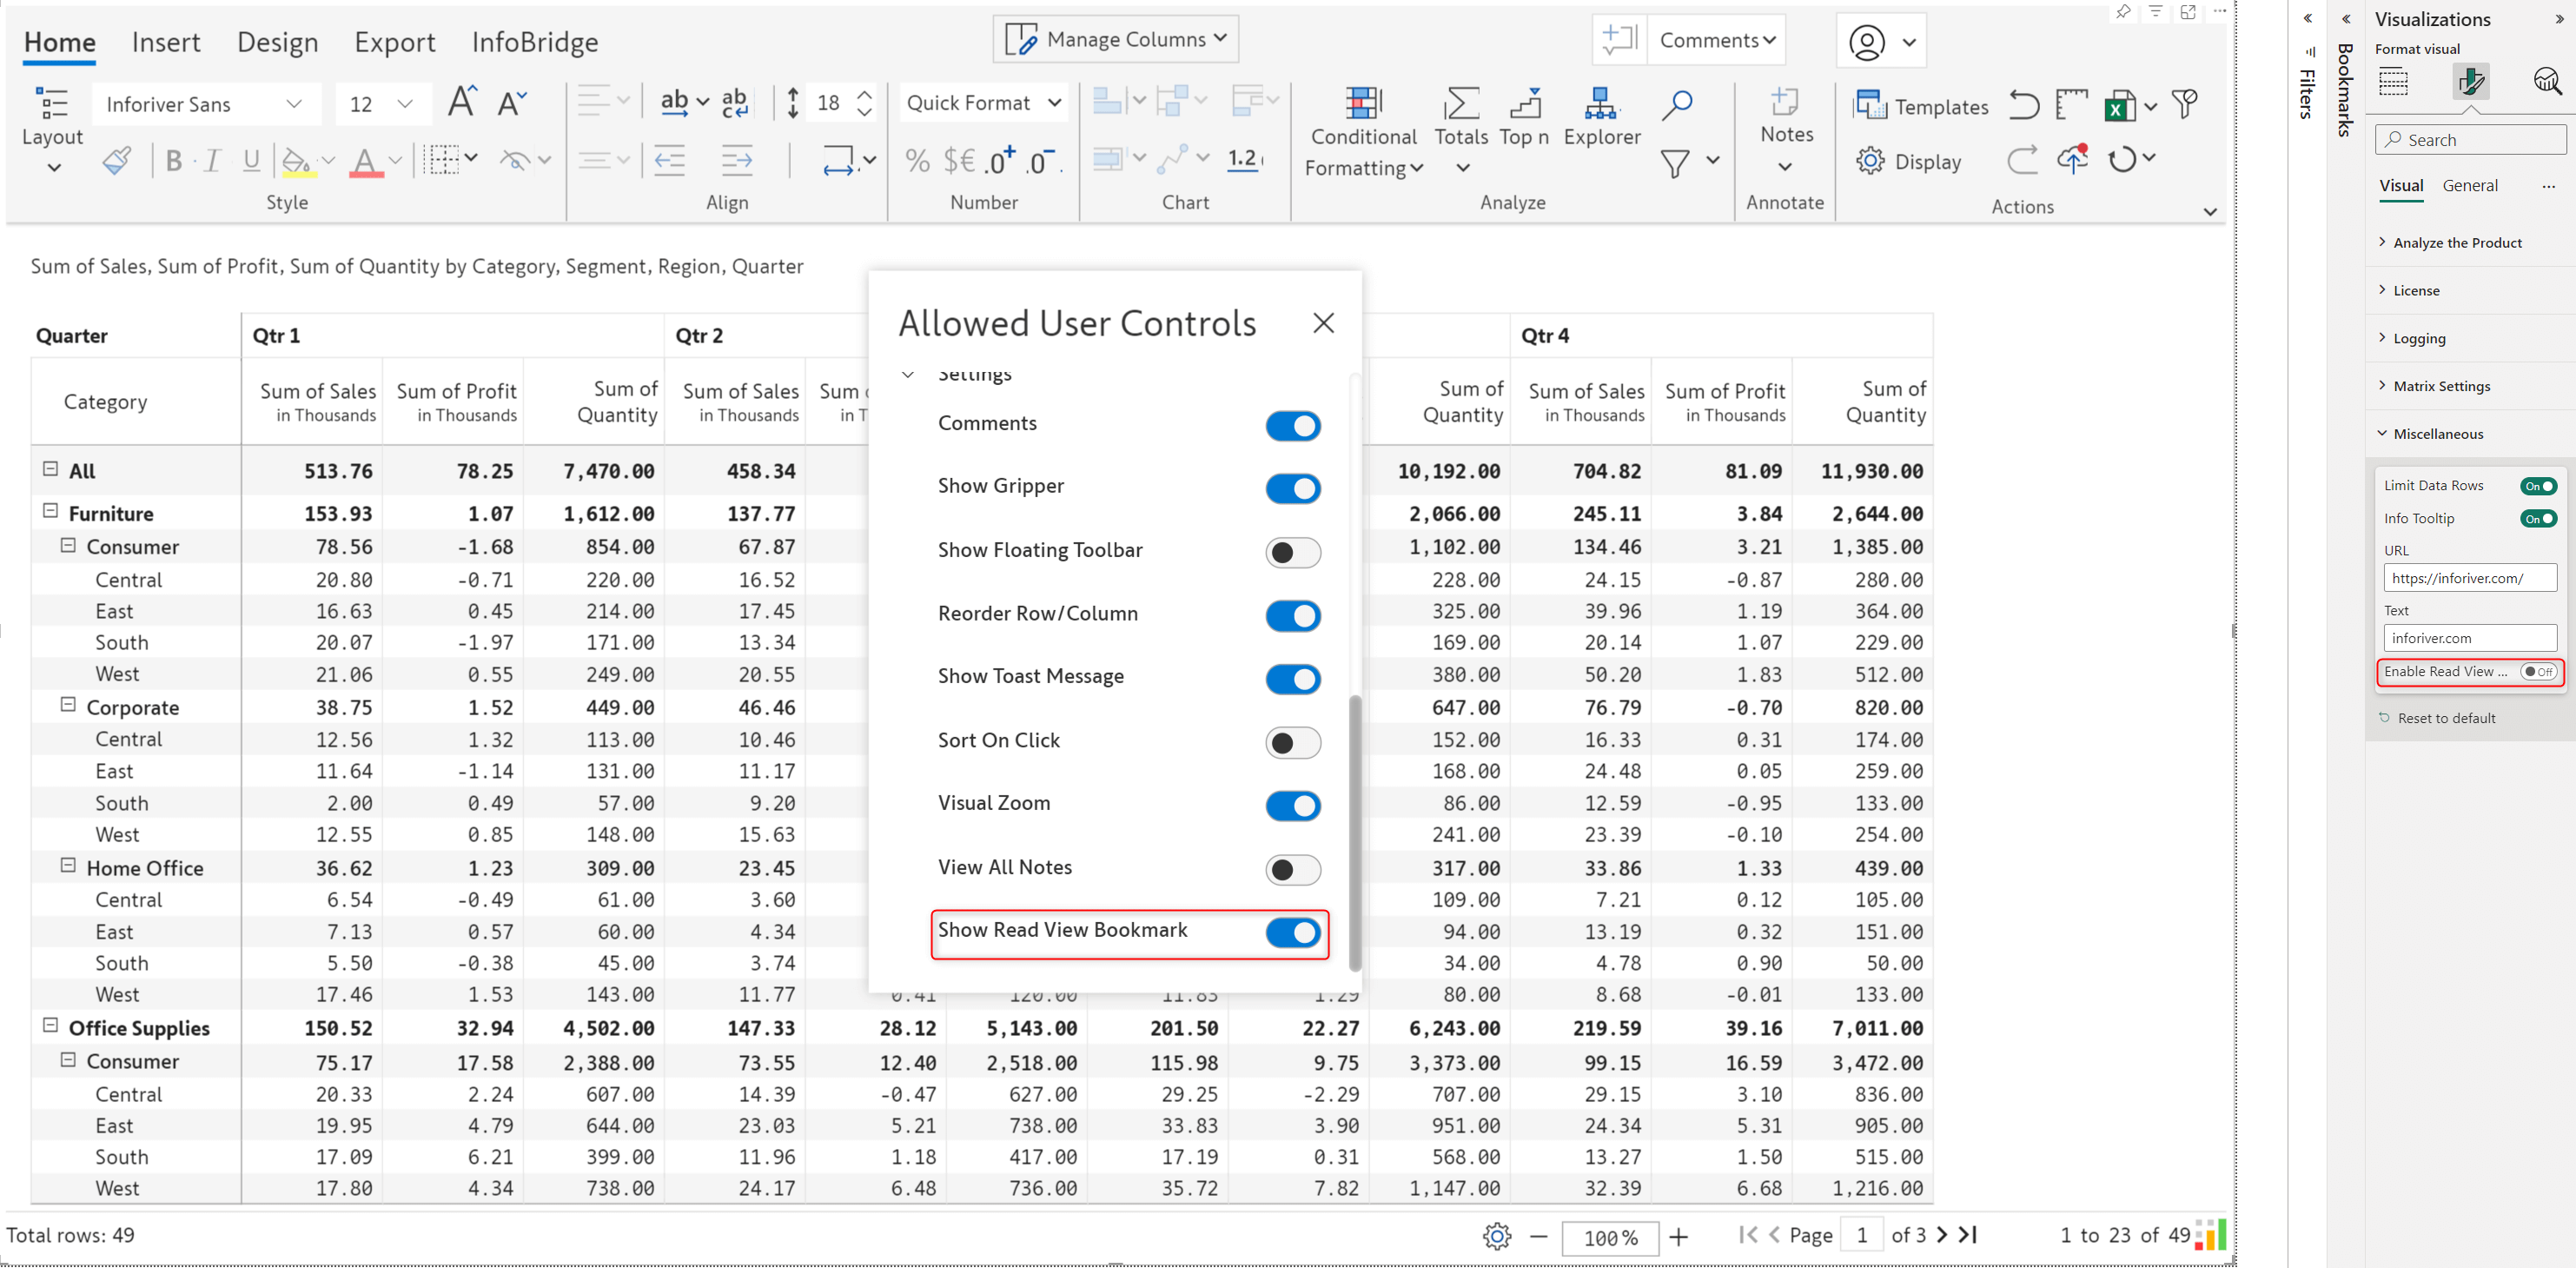
When the Show read View Bookmark option is enabled in Allowed user controls, in reading view, you will notice a Read view bookmarking toggle. When the toggle is disabled, users can create bookmarks, but changes will not be persisted.
With that, we conclude the 3.1. Writeback Matrix release updates.
Your support and feedback enable us to continuously refine Inforiver. We look forward to your suggestions and have many more exciting innovations lined up! Visit the Inforiver Community to share your ideas, vote on others’ submissions, and interact with other users.
Note: Infobridge is available with dedicated license management, pricing, and validity. Reach out to us to know more!

Inforiver helps enterprises consolidate planning, reporting & analytics on a single platform (Power BI). The no-code, self-service award-winning platform has been recognized as the industry’s best and is adopted by many Fortune 100 firms.
Inforiver is a product of Lumel, the #1 Power BI AppSource Partner. The firm serves over 3,000 customers worldwide through its portfolio of products offered under the brands Inforiver, EDITable, ValQ, and xViz.