
Upcoming webinar on 'Inforiver Charts : The fastest way to deliver stories in Power BI', Aug 29th , Monday, 10.30 AM CST. Register Now
Upcoming webinar on 'Inforiver Charts : The fastest way to deliver stories in Power BI', Aug 29th , Monday, 10.30 AM CST. Register Now
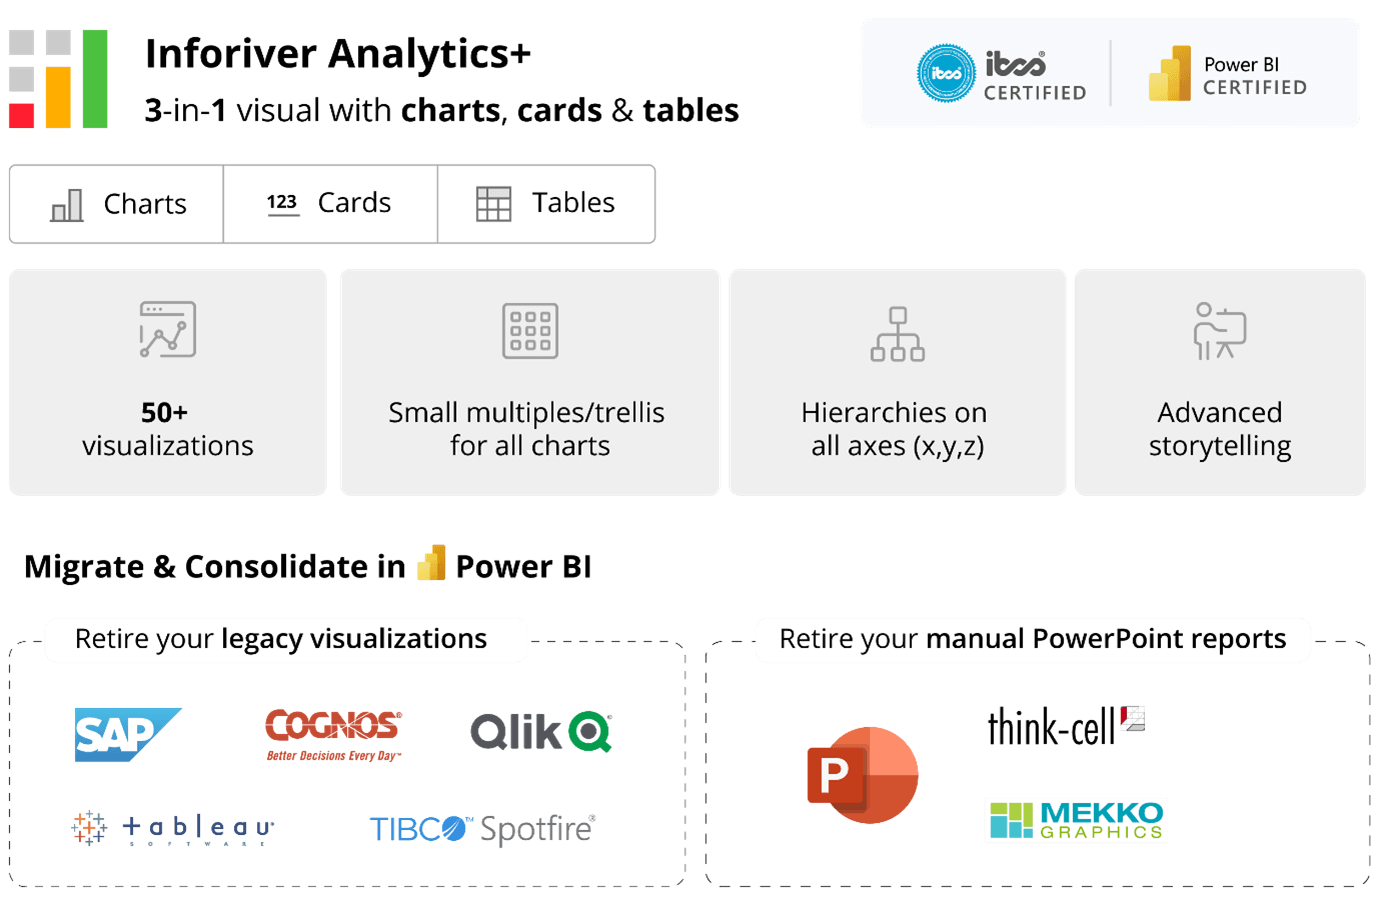
Many organizations prefer to migrate legacy dashboards from tools like Tableau, Spotfire, Qlik, Cognos, SAP to Power BI to realize cost savings. However, there are several key features available in these tools but missing in Power BI that prevent them from consolidating their reporting in a single Power BI platform.
Inforiver Analytics+, a 3-in-1 visual for dashboards and storyboards consisting of 50+ Charts, Cards and Tables, offers a complete storytelling platform that is designed to help enterprises migrate from their dashboards.
In this webinar, experience a LIVE DEMO of how Analytics+ delivers advanced features in Power BI :

Inforiver helps enterprises consolidate planning, reporting & analytics on a single platform (Power BI). The no-code, self-service award-winning platform has been recognized as the industry’s best and is adopted by many Fortune 100 firms.
Inforiver is a product of Lumel, the #1 Power BI AppSource Partner. The firm serves over 3,000 customers worldwide through its portfolio of products offered under the brands Inforiver, EDITable, ValQ, and xViz.