Introducing Inforiver Analytics+: 3-in-1 visual with 50+ Charts, Cards, and Tables
Thursday Dec 14, 2023 at 10 AM CDT
Upcoming webinar on 'Inforiver Charts : The fastest way to deliver stories in Power BI', Aug 29th , Monday, 10.30 AM CST. Register Now

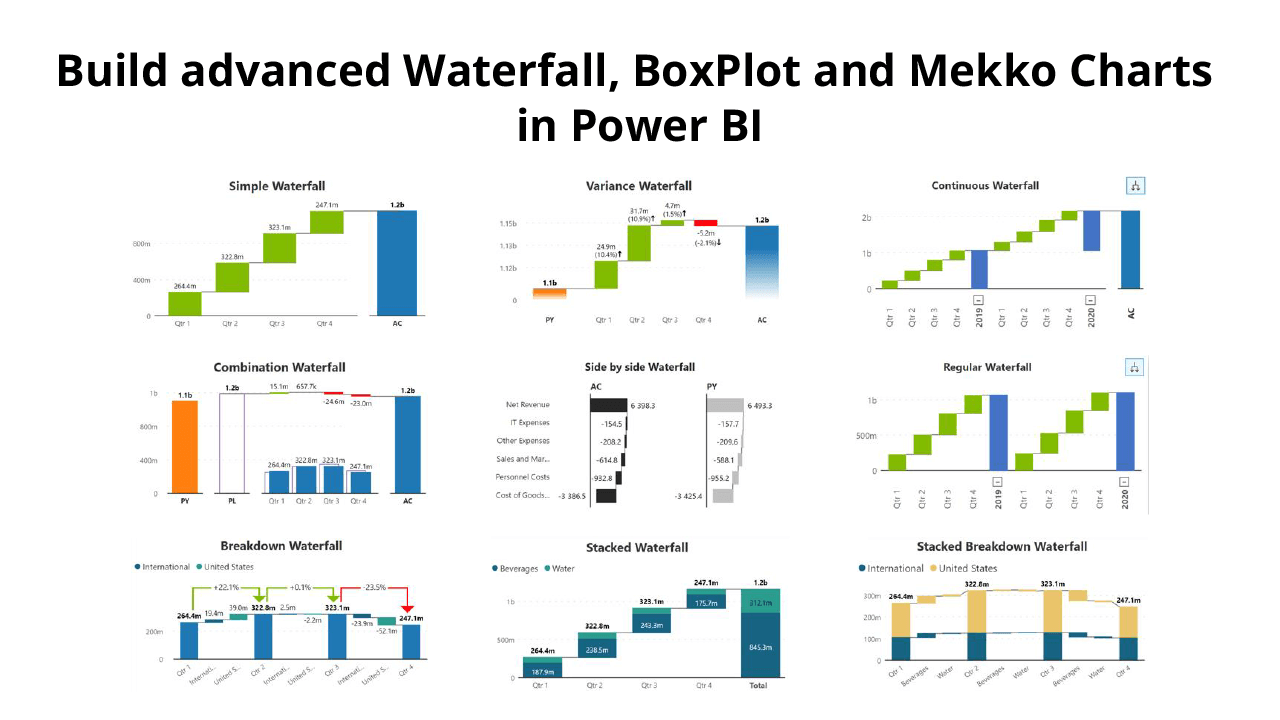
Are you keen to learn how to build advanced Waterfall, Box Plots and Marimekko charts in Power BI? Then this webinar is for you.

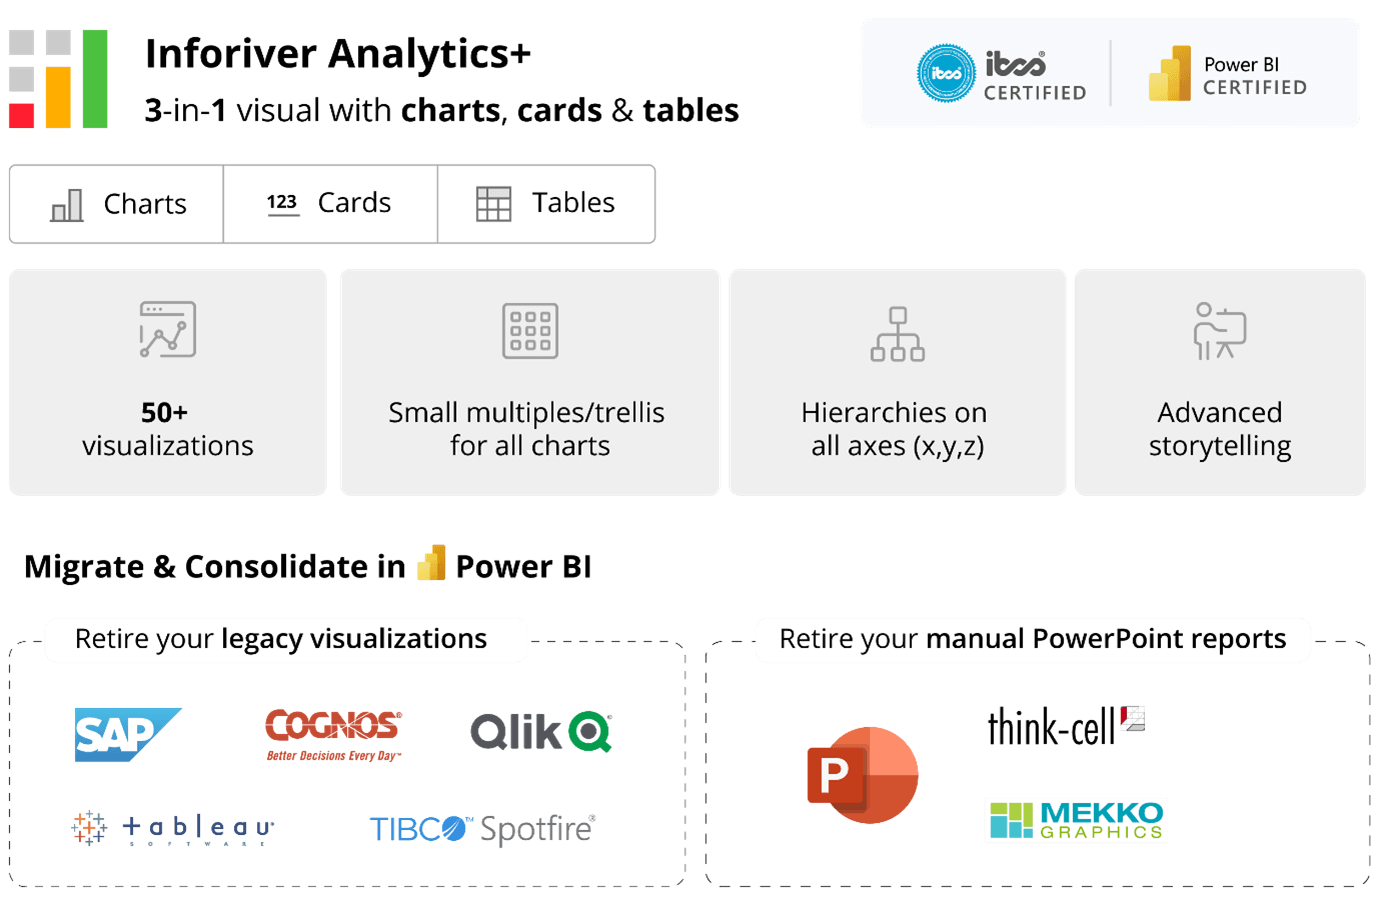
Inforiver launches Analytics+, a 3-in-1 visual for dashboards and storyboards combining 50+ charts, KPI cards and tables for Power BI. The product is IBCS-certified and Power BI certified.
This launch webinar focuses on how Inforiver Analytics+ can help organizations migrate from tools like Tableau, Spotfire, Qlik, Cognos and SAP and consolidate their analytics in Power BI. Analytics+ enables it by delivering key features that are not available in native Power BI but are available in the legacy BI tools.
Organizations using static PowerPoint reports built using add-ins like Think-Cell and MekkoGraphics can also leverage Analytics+ to convert them to dynamic & interactive reports in Power BI.
Specifically, the webinar will offer a LIVE DEMO including the following:
